Team:
Can you believe that the end of week 1 of Phenotype Phebruary is already here?!? Time flies when you’re having fun.
In the first six days, I tried to initiate conversations around phenotyping diseases that were primarily defined by condition occurrence records (T2DM, T1DM, AFib, multiple myeloma, Alzheimers, bleeding). But there continues to be a lot of interest in our community in using measurement values as part of the phenotyping process. So, today, let’s talk about Neutropenia.
Clinical description:
Neutropenia is abnormally low count of neutrophils in the blood. Neutrophils are the primary circulating white blood cells and function as part of the immune system to respond to inflammation and bacterial infections. So, persons with neutropenia are are increased risk of infection. While neutropenia itself can be asymptomatic, symptoms often manifest as a result of an infection, and can include fever, pain in swallowing or gums, or skin abcesses. Neutropenia can be congenital or acquired, and acute or chronic, and is known to be associated with various conditions and attributed to drug exposure. While neutropenia is specifically referred to decreased neutrophils, other conditions are known to observe neutropenia in conjunction with other phenomena. Pancytopenia is decrease in red blood cells, white blood cells, and platelets. Leukopenia is low white blood cells of any time, which generally is inclusive of neutropenia.
Neutropenia can be diagnosed by measurement of neutrophils. One diagnostic criteria for severe neutropenia is absolute neutrophil count (ANC) < 500 cells per microliter of blood, while moderate neutropenia can be identified by ANC between 500-1000 cells per microliter, and mild neutropenia is classified as ANC between 1000 - 1500 cells per microliter. Severe neutropenia poses the greater infection risk, and is often where medical attention is recommended. However, since severe neutropenia is rare, it can be difficult to identify and classification, even with ease of measurement from a complete blood count test. Additional bone marrow biopsy may be required as a diagnostic procedure.
Treatment for neutropenia can include granulocyte colony stimulating factor (G-CSF), including filgrastim, and antibiotics to manage bacterial infections.
Phenotype development:
So, neutropenia is a diagnosis, and it can be identified by a neutrophil count. A complete blood count with differential can provide this value, and can be routinely ordered in both an outpatient and outpatient setting. Should be straightforward, right?
Well, there are a few prior publications using claims and electronic health records looking at neutropenia, most in the context of cancer patients, and few that I could find provided much in the way of validation. Kim et al, " Accuracy of identifying neutropenia diagnoses in outpatient claims data", PDS in 2011 showed that diagnosis codes make for very poor phenotypes for neutropenia in outpatient data.
A nice paper from the OHDSI community, Jeon et al, " Characterizing the Anticancer Treatment Trajectory and Pattern in Patients Receiving Chemotherapy for Cancer Using Harmonized Observational Databases: Retrospective Study", in JIR Medical Informatics last year focused on characterizing chemotherapy treatment episodes examined the pattern of neutropenia proximal to therapy, using lab values from a hospital database. (Good job @Hokyun @SCYou @Jeremy_Warner @rimma @rwpark )
One topic that comes up in some phenotype discussions is data fitness-for-use. This is particularly relevant if we look to conduct analyses across our data network, where there can be substantial variation on what specific data are available for use.
Take these four databases as illustrative example:
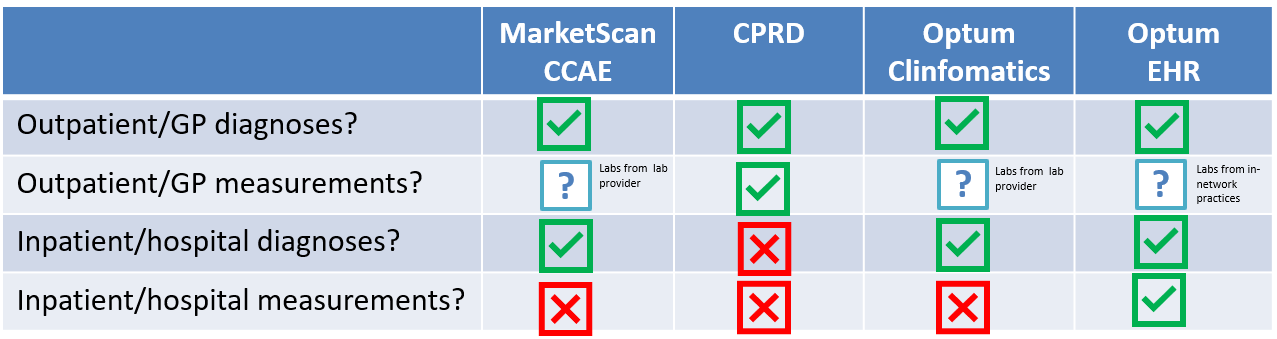
Neutropenia could be observed via outpatient diagnosis, outpatient labs, inpatient diagnosis, or inpatient diagnosis. But, few databases have complete capture of all four of those elements. And the lack of completeness and the dimension of missingness can, at least partly, explain why there could be heterogeneity in results of an analysis of, for example, the incidence of neutropenia in a general population.
As we build phenotypes, we can consider the components that can be used to make up the definition: diagnosis and measurement, and we can also combine them together into a composite definition that attempts to take advantage of all information that could be available. Then, CohortDiagnostics can be a helpful tool to compare cases identified via diagnosis with cases identified by measurement, and also allow assessment of visit context for each element.
But first, we have to define each component. I’ve previously walked through how you can create a condition conceptset, whether by starting with a published codelist or by using PHOEBE to get some recommendations. Today, I’d like to highlight the added complexity when working with measurements.
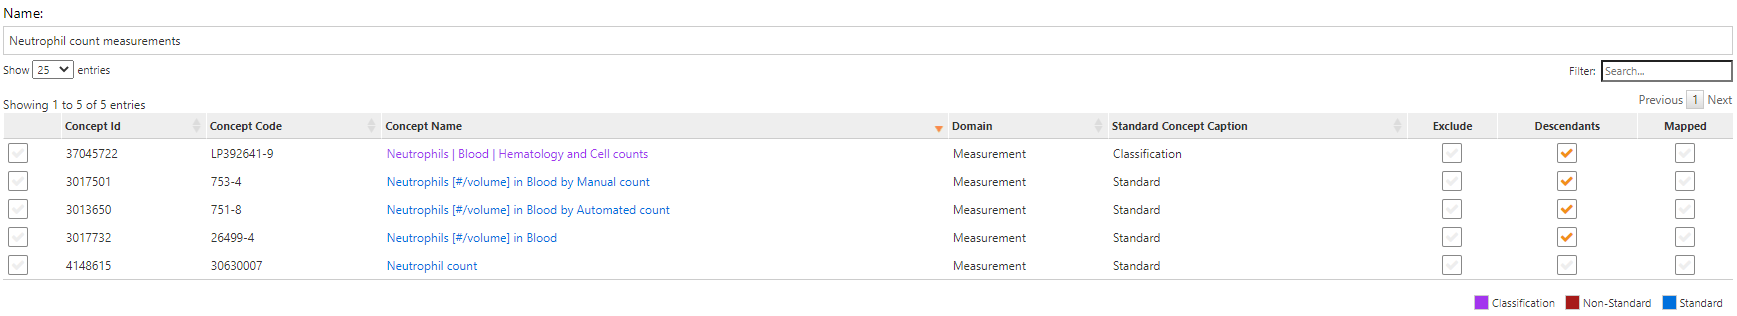
While our OMOP common data model standardizes data structure and vocabularies, some domains are more aligned than others. In the context of measurements, we have a combination of challenges: first, we need to identify the set of mesurements that can yield the value of interest; LOINC provides a robust set of potential measurements, and SNOMED also provides some standard measurement concepts, and the task is to identify the superset of relavant concepts. Here are concepts for neutrophil counts:
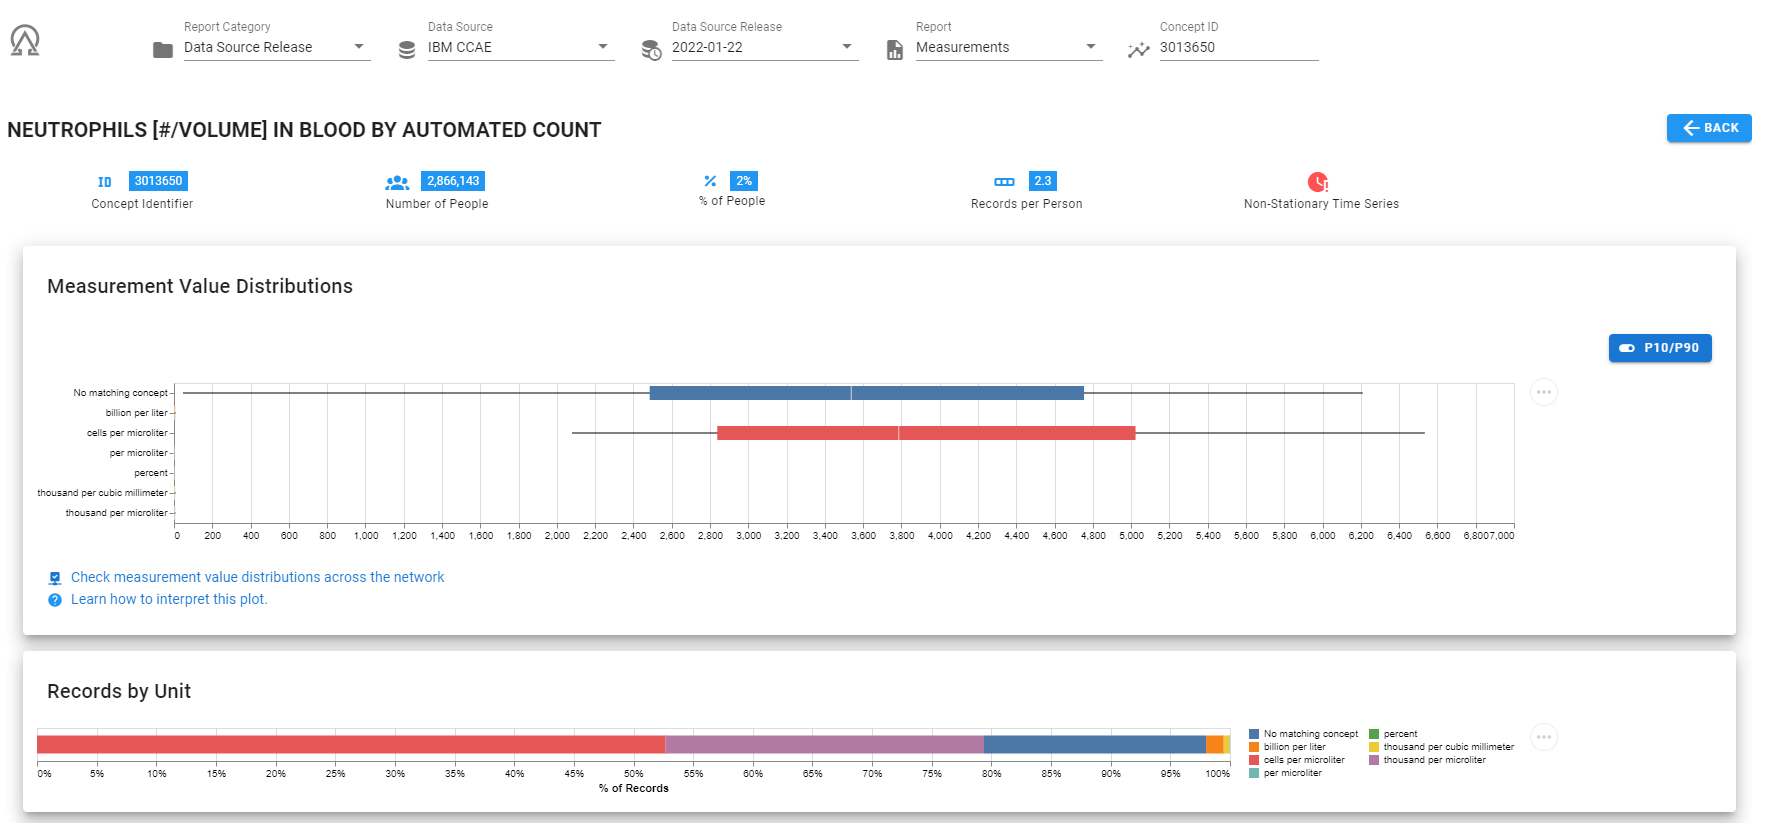
second, FOR EACH MEASUREMENT, you have to identify the set of units that are used for the measurement, and determine the appropriate values to apply for each measurement-unit combination. Figuring this out can be messy.
Luckily, if you’ve used the full OHDSI stack, then ACHILLES has already pre-computed the distribution of values across all measurement-unit pairs. And this information can be accessed mulltiple ways: via SQL against the ACHILLES results tables, via the ACHILLES browser, or via the ATLAS data sources tab, or via ARES (the tool @Frank presented at OHDSI2021 Symposium).
Here’s a screenshot of ARES, showing me that in the CCAE database, for the concept 3013650, ‘NEUTROPHILS [#/VOLUME] IN BLOOD BY AUTOMATED COUNT’ , we observed 7 different units (including ‘unknown’). The majority of records had unit of ‘cells per microliter’, but there was also a good chuck with unit ‘thousand per microliter’. And here, we can see these two units are are different scales.
Once we assemble all the measurement-unit combinations and determine their appropriate ranges, we can implement that into our ATLAS definition. What we’ve learned the hard way though across our OHDSI network is there is tremendous diversity in measurements and units used, and doing a network study with measurements can require iterations to make sure that your definition is inclusive of what’s out there. This is a particular area of interest for @Vojtech_Huser, who has led important work to think about how we can further harmonize our measurement data across our network. But until we get adoption of consistent approaches to measurement-unit standardization, we’ll be relegated to compiling together the set of possibilities that may arise.
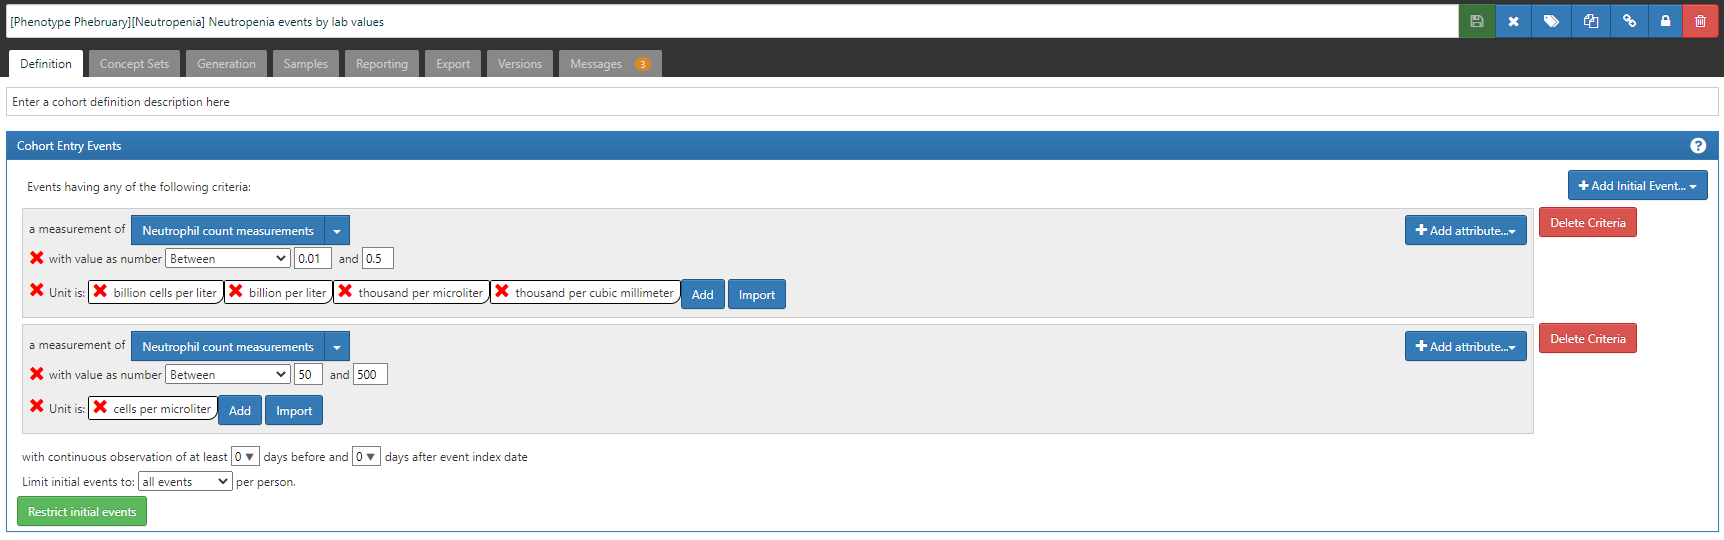
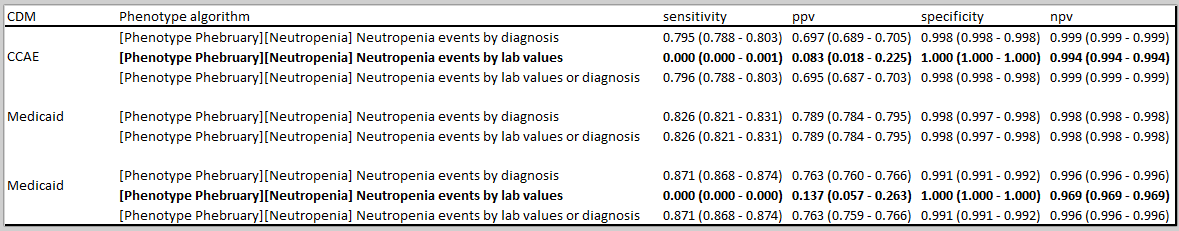
So, here are three Neutropenia definitions to consider, with their ATLAS-phenotype links:
- Neutropenia events based on diagnoses
- Neutropenia events based on lab values
- Neutropenia events based on diagnoses or labs
My preference would be to use the inclusive definition #3 across all sites, even those without labs. But, when evaluating the phenotype I would also use #1 and #2 to understand the contributions of each component. But the bigger issue is how to consider interpreting results across a collection of databases when capture of inpatient/outpatient labs can be so variable.
Do you consider incomplete lab data just another source of sensitivity error? How do you consider combining together conditions and labs when the diagnostic criteria is based on a measurement? What can we do to improve our network capture and coordination of measurement-units to expand our use of the data that is available?