Welcome to Phenotype Phebruary Day 6!
Up to this point, we’ve discussed phenotype targets that are generally considered chronic diseases (T2DM, T1DM, AFib, multiple myeloma, Alzheimer’s). As such, our focus has been primarily on identifying cohort entry, with the subposition that once a person enters the cohort, they remain in that health state until the end of their observation.
Today, I’d like to talk about creating a cohort definition that allows for a person to enter and exit the cohort multiple times. We’ll use hemorrhagic events and bleeding-related hospitalizations as our example. This will subsume a couple phenotypes high on the OHDSI wishlist : hemorrhagic stroke and gastrointestinal bleeding.
Our motivating use case: In our AFib discussion, we noted a recent paper by Ray et al, " Association of Rivaroxaban vs Apixaban With Major Ischemic or Hemorrhagic Events in Patients With Atrial Fibrillation", in JAMA in Dec2021. In that study, the target and comparator populations were persons with AFib with DOAC exposure, so we should be clear how we could use our AFib cohort, intersect it with a new user drug cohort, and identify the patients eligible to be analyzed. That was the easy part, now we’ll tackle the trickier bit: finding the outcomes for those patients. In their publication, Ray et al classify and define ischemic and hemorrhagic events, with ischemic events including ischemic strokes and systemic embolisms, and hemorrhagic events including hemorrhagic strokes and bleeding-related hospitalizations. Today, I’ll just focus on that second aspect.
Clinical description:
I had fun looking for a clinical definition to report here without sounding stupid: Medlineplus gave me this: “Bleeding is the loss of blood”. Google’s healthbox provides defines bleeding (aka hemorrhage) as “the release of blood from a broken blood vessel, either inside or outside the body”. Perhaps not terribly informative.
In part, its because it’s an ill-specified phenotype target: hemorrhage can be the result from a broad constellation of injuries, can occur anywhere throughout the body, and can have consequences that vary from inconsequential/self-remedying to fatal. External bleeding is usually easy to detect (look for red), and if that does not resolve after a few minutes of applying pressure may require to seek medical attention. Internal bleeding may be initially asymptomatic, but initial signs can include hypotension, abnormal heart rate or breathing, drowsiness or loss of consciousness, in addition to observing blood from ear, mouth, nose, or anus, or when coughing/vomiting, or black/bloody stool. Bleeding is commonly caused by trauma, but non-traumatic conditions can result in blood vessel rupture, as can medications that interact with blood, such as anticoagulants and antiplatelets.
Broadly, bleeding events can be classified by their origin. Often, particular consideration is given to serious bleeding events from the head (intracranial hemorrhage), gastrointestinal tract, and genitourinary tract. Each of these bleeds can be considered phenotype targets in their own right.
Hemorrhagic stroke is a specific event caused by bleeding, when blood vessels rupture inside tissues or around the brain. Hemorrhagic stroke may have additional initial symptoms, including numbness or weakness in face or side of body, difficulty speaking or walking. Hemorrhagic stroke requires immediate medical attention, and can include intensive care monitoring.
Phenotype development:
Ray et al. detailed their phenotype algorithm in the Supplemental Materials, which was adapted from prior published work their team had conducted to evaluate a bleeding algorithm.
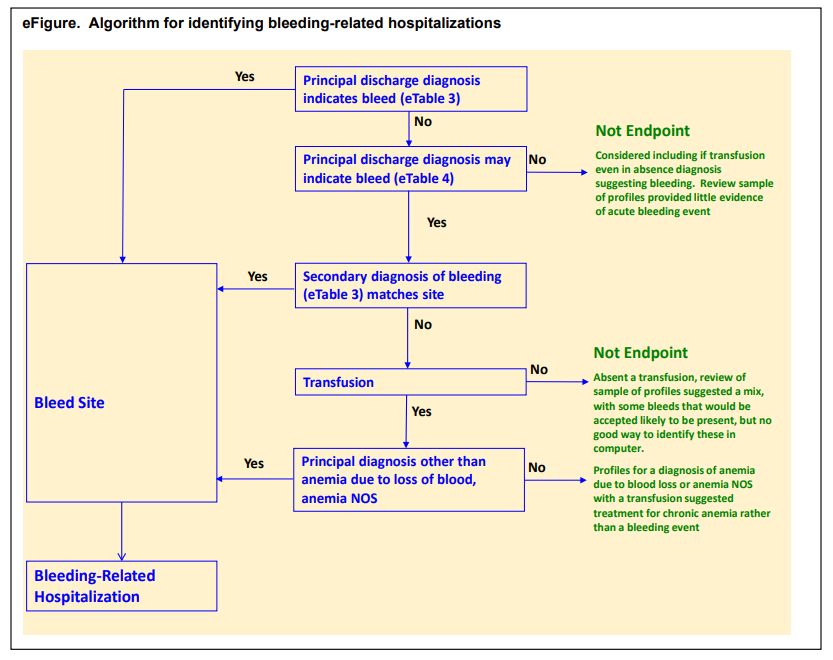
Their schematic showed that events were identified based on a ‘definite’ code in a primary discharge diagnosis position of a hospital admission OR a ‘possible’ code in a primary position combined with either a secondary ‘definite’ code or a transfusion.
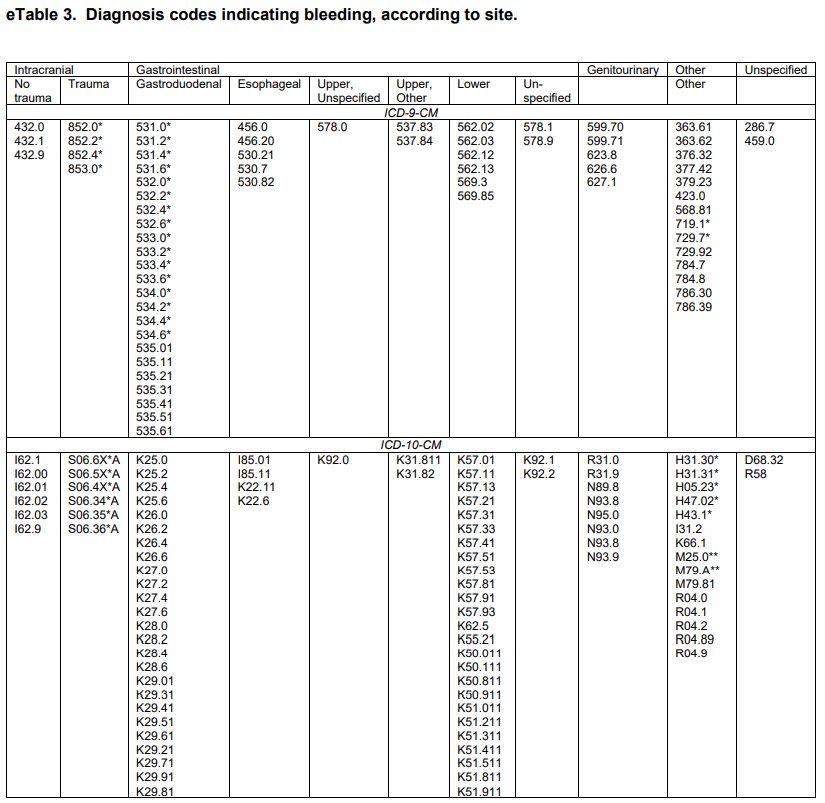
They provided detailed lists of ICD9CM and ICD10CM codes for specific bleeding sites, as code lists for ‘definite’ and ‘possible’ cases:

Now, I could have followed the process that I’ve outlined in prior Phenotype Phebruary posts: using ATLAS to search for each source code, find its correponding standard concept, add to a conceptset, and repeat until all codes are evaluated. But look at those source code lists…that’s a lot of codes! So, as much as I love ATLAS, I’m gonna need help to get this task done. Time to roll up my sleeves and do a little coding myself…
Remember, ATLAS is just a GUI interacting with the OHDSI vocabularies, allowing the point-and-click from the vantage point of a given concept. But sometimes, you need to work with lists of codes, and perform bulk operations on the list. Since the OHDSI vocabularies are stored in a relational database, this is a perfect task for SQL.
Let’s illustrate this with the Ray list of ICD9 and ICD10 codes for ‘gastrointestinal / gastroduodenal - definite’ codes. My task is to create one list of standard concepts that covers all of Ray’s source codes. Here’s a query that does just that:
–Gastrointestinal gastroduodenal hemorrhage- definite
select distinct c1.concept_id
from
(
select *
from concept
where vocabulary_id = ‘ICD9CM’
and (
concept_code like ‘531.0%’
or concept_code like ‘531.2%’
or concept_code like ‘531.4%’
or concept_code like ‘531.6%’
or concept_code like ‘532.0%’
or concept_code like ‘532.2%’
or concept_code like ‘532.4%’
or concept_code like ‘532.6%’
or concept_code like ‘533.0%’
or concept_code like ‘533.2%’
or concept_code like ‘533.4%’
or concept_code like ‘533.6%’
or concept_code like ‘534.0%’
or concept_code like ‘534.2%’
or concept_code like ‘534.4%’
or concept_code like ‘534.6%’
or concept_code in (‘535.01’,‘535.11’,‘535.21’,‘535.31’,‘535.41’,‘535.51’,‘535.61’)
)union all
select *
from concept
where vocabulary_id = ‘ICD10CM’
and (concept_code in (‘K25.0’, ‘K25.2’, ‘K25.4’, ‘K25.6’,
‘K26.0’, ‘K26.2’, ‘K26.4’, ‘K26.6’,
‘K27.0’, ‘K27.2’, ‘K27.4’, ‘K27.6’,
‘K28.0’, ‘K28.2’, ‘K28.4’, ‘K28.6’,
‘K29.01’, ‘K29.21’, ‘K29.31’, ‘K29.41’, ‘K29.51’, ‘K29.61’, ‘K29.71’, ‘K29.81’, ‘K29.91’ )
)
) source_codes
inner join concept_relationship cr1
on source_codes.concept_id = cr1.concept_id_1
and cr1.relationship_id = ‘Maps to’
inner join concept c1
on cr1.concept_id_2 = c1.concept_id
and c1.standard_concept = ‘S’
inner join (select distinct descendant_concept_id from concept_ancestor where ancestor_concept_id in (437312 /bleeding/, 4071689 /blood vessel finding/)) ca1
on c1.concept_id = ca1.descendant_concept_id
;
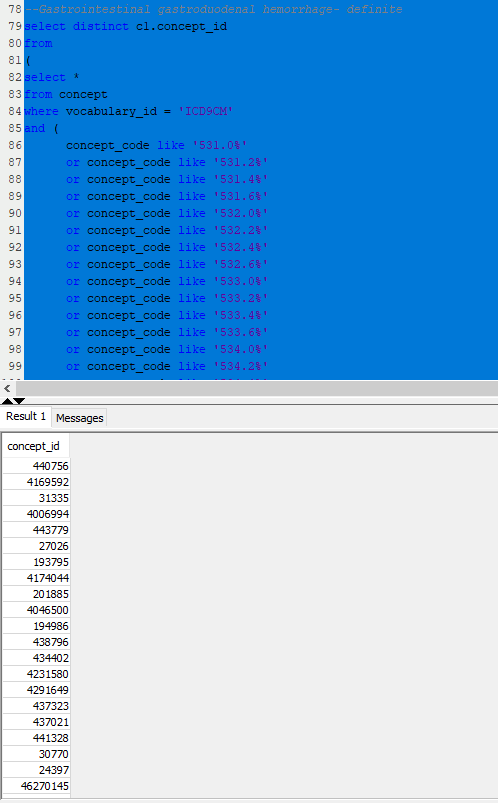
Here’s my SQL console with the results:
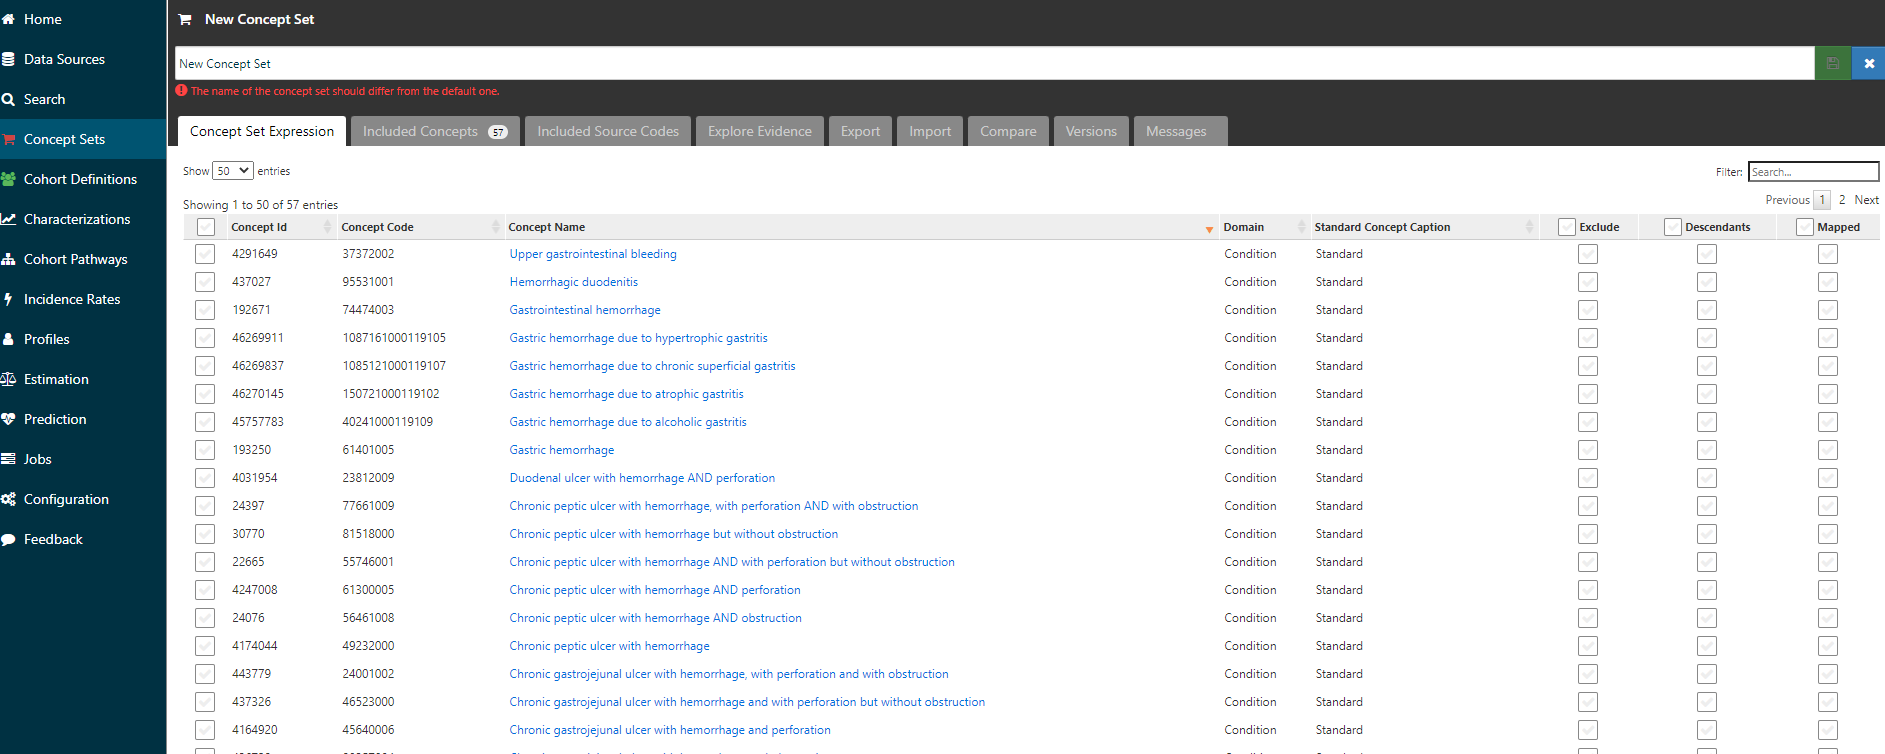
Then, with the list of CONCEPT_IDs that my query returns in my SQL console, I can copy/paste them into ATLAS. Here, I create a new conceptset (blue button on top right after clicking on ‘Concept Sets’ in the left menu), then navigate to the ‘Import’ tab, select the ‘Concept identifiers’ tab, copy my list, and click the green ‘Add to Concept Set’ button.

Now, I can go back to the ‘Concept Set Expression’ tab, and voila, I see that I’ve pulled in 57 concepts:
And if I navigate over to the ‘Included source codes’ tab, I can verify that I’ve now covered all the ICD9CM and ICD10CM codes that I started with (and also evaluate if any additional codes have been brought along for the ride by the ICD->SNOMED mappings).

Using this trick of combining a little SQL with ATLAS import can save a lot of time, particularly if you’ve got a long list that you’re starting with.
Here’s a file that contains the SQL I used to work through the codelists in the Ray JAMA paper (sorry for Word file format, it’s only because of limitations of forums here).
Phenotype Phebruary hemorrhagic events sql for source to standard.docx (19.0 KB)
Ok, so we have conceptsets for all the bleeding subtypes of interest. Now, we have to build the cohort definition logic that uses them.
First, we want to reproduce the logic outlined in the Ray supplement, in case we thought this was a good study to try to emulate (wink @agolozar ). We want hospitalizations where EITHER the primary diagnosis is one of the ‘definite’ codes OR (the primary diagnosis is a ‘possible’ code AND (another diagnosis in the same visit is a ‘definite’ code from the same anatomical site OR there was blood transfusion) ). While it can seem like a bit of a complicated logic, ATLAS handles it just fine. Screenshot below shows the first bit of the logic, but if you are really interested in the full thing, you’ll want to log into ATLAS-phenotype to review it yourself. A couple items to point out here: 1) we use the CONDITION_STATUS_CONCEPT_ID field to delineate if a condition occurrence record is ‘primary’. 2) We determine that the condition record occurs during the hospitalization by requiring the condition start to be between the visit start date and visit end date. 3) the ‘possible’ logic requires use of the ATLAS ‘Group’ criteria. That’s what lets us make a logic of A OR (B AND (C OR D))…think of the Group as the way to make the parentheses in your Boolean operation. 4) Entry event here is ‘all events’, not ‘earliest event’ (this is what will let us have multiple events). 5) I have shown one composite conceptset of all ‘definite’ concepts but I also have separate conceptsets for each site-specific listing that Ray provided.
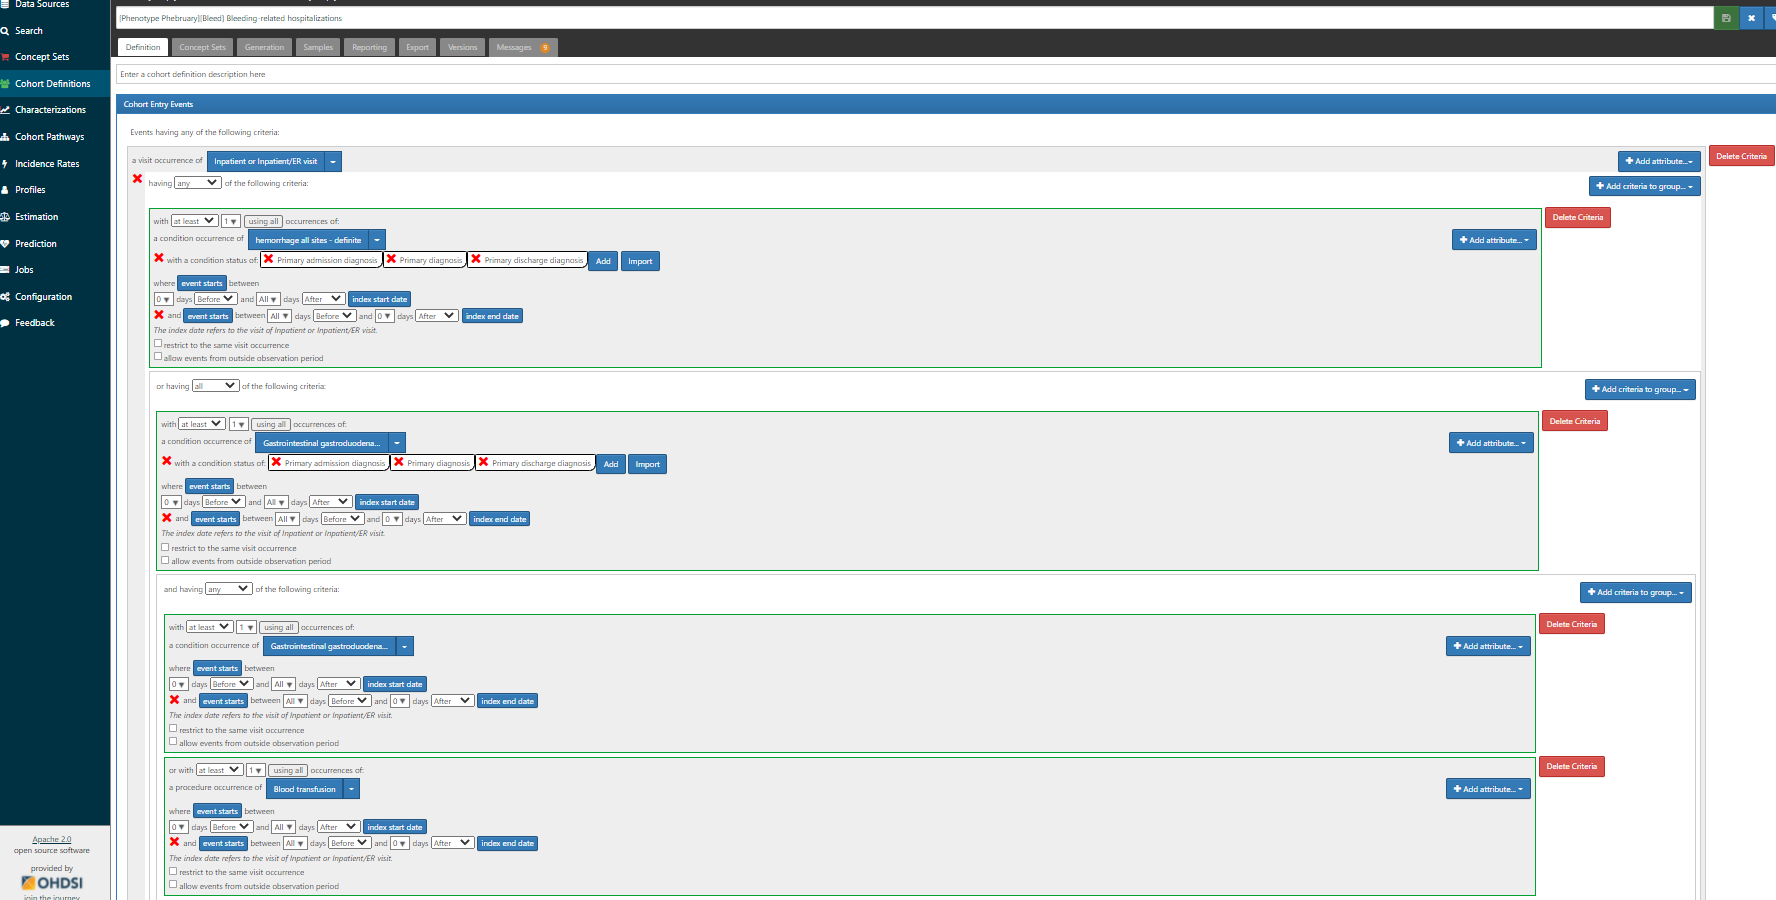
I want to also highlight the Cohort Exit strategy here. Since the entry is indexed on the Visit Start Date, we specify that exit is on the ‘end date’ (+ 0 days), using the Event Persistence type of ‘fixed duration relative to initial event’. This basically means all events will be from admission to discharge. If one hospitalization qualified with multiple diagnoses, it will be collapsed together into one event.

Now, this notion of relying on ‘primary position’ has been extensively applied in observational research of US administrative claims data, and for some conditions, it has been shown upon validation that primary position has been more specific than codes using the secondary diagnosis positions. But, there are two major issues to consider: 1) imposing a rule that increases specificity may come at the cost of sensitivity, and that tradeoff should be empirically evaluated, and 2) there are lot more databases in the world than use US claims datasets, and not all of those sources have the same notion of ‘primary position’, so this algorithm may not be generalizable.
An alternative definition that one could evaluate would be to simply focus on hospitalizations that contain any of the Ray ‘definite’ codes. Certainly the logic is a heckuva lot simpler. Screenshot below, and ATLAS-phenotype link here:
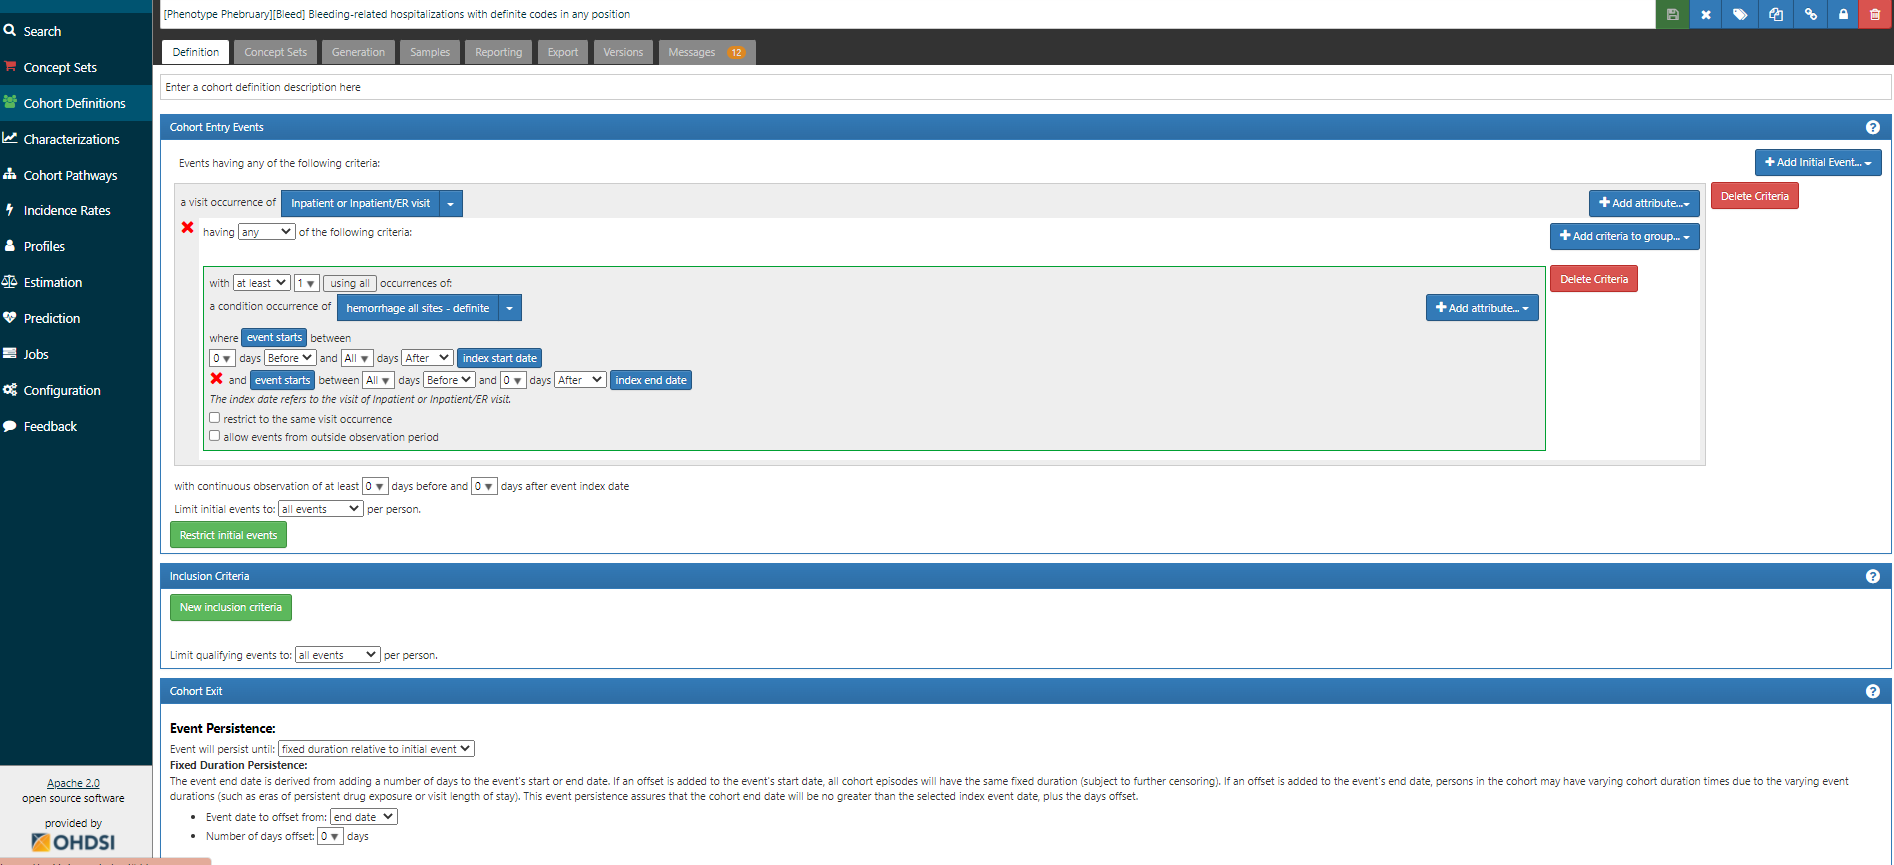
But even this definition will be limited across our OHDSI data network, as we know of many databases that do not capture inpatient visits. Now clearly if the phenotype target is ‘bleeding-related hospitalizations’, then use of a database without hospitalizations would not be fit-for-use. But if the phenotype target is ‘bleeding events’ more broadly, then one could consider another alternative definition (ATLAS-phenotype link here):

Here, you’ll see we are taking all condition occurrence record with a ‘definite’ concept. But note how the Cohort Exit strategy has changed. Now, we can’t anchor on the visit end (because we aren’t using visits at all). So, instead we set the Event Persistence to 0 days from condition start, and use the era collapse gap size to 30d, to combine together records that may be part of the same episode.
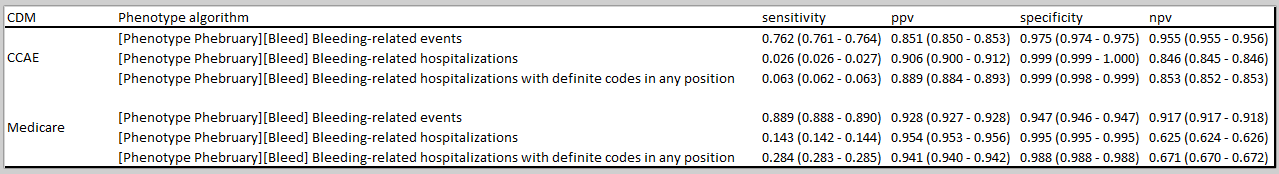
Now, which of these three definitions is ‘best’ is something that needs to be empirically evaluated, and its going to be based both on the impact of sensitivity and specificity errors, as well as the data content available in the source. This is a great example where CohortDiagnostics would be very useful across a network of databases, because the impact of these alternatives will certainly vary widely. For example, it could help understand how many persons and records have occurred for each database (to understand the extent of recurrence), how long the cohort eras are, which concepts drove the index events, etc. @Gowtham_Rao can illustrate this for some of the data we have access to, but it would be awesome to see other data partners execute these definitions and share their CohortDiagnostics results as well.
There are TONS of studies on bleeding events. Perhaps you are an author of one! If so, what did you encounter when phenotyping the outcome? And if you aren’t (yet) an author, what strategy do you think you’d employ to build or re-use a phenotype algorithm for your database? What can we take away from the bleeding event experience that we can carry forward to other phenotypes of recurrent events? Lemme hear from you!