OHDSI Home | Forums | Wiki | Github

Phenotype Phebruary Day 4- Multiple Myeloma

Team:

Welcome to Phenotype Phebruary Day 4! We’ve discuss phenotyping metabolic diseases (T2DM and T1DM) and a cardiovascular disease (AFib), so let’s turn our attention to a different disease area that is a particularly active focus for many community collaborators - oncology. OHDSI’s Oncology workgroup has made good progress in thinking about advances in the OMOP CDM and OHDSI vocabularies to accommodate the study of cancers and their treatments. Another key opportunity, that I know @agolozar is quite keen to lead within the Oncology WG, is developing phenotype algorithms for each cancer target, and evaluating those algorithms across a diverse array of databases that could potentially be used to generate evidence, including administrative claims, electronic health records, specialty oncology EHRs, and cancer registries. Phenotype Phebruary seems the perfect time to get community collaboration toward this objective, starting today with Multiple Myeloma.

Clinical description:

Multiple myeloma is a type of blood cancer that affects plasma cells. Malignant white blood cells develop in bone marrow, suppressing healthy plasma cells that produce antibodies against infection. Malignant plasma cells produce M protein, which can cause tumors, kidney damage, bone destruction and impaired immune function. They also cause decreased production of red blood cells and platelets, which can result in anemia and bleeding.

Multiple myeloma is diagnosed based on plasmacytoma identified on biopsy, >30% malignant plasma cells in bone marrow aspiration, evaluated levels of M protein from protein electrophoresis in the blood or urine, osteolytic lesions observed on imaging, and IgG or IgA antibody levels in the blood. Additional diagnostics tests may include measurement of Beta2-microglobulin level. Management of multiple myeloma typically requires pharmacologic treatment with proteasome inhibitors (including bortezomib, carfilzomib, ixazomib), immunomodulatory drugs (like lenalidomide, pomalidomide, thalidomide), steroids (dexamethasone, prednisone), monoclonal antibodies (such as elotuzumab, daratumumab, isatuximab, belantamab), and chemotherapy (doxorubicin, melphalan, cyclophoshamide, bendamsutine, vincristine). Autologous stem cell transplant may be considered for those eligible. Patients may also be treated with bisphosphonates to reduce risk of bone loss.

Multiple myeloma is more common in men than women, more common in Black or African American than whites, more common in older ages (with most cases occurring after 40 years old)

Phenotype development:

There have been several prior publications studying multiple myeloma in observational data, including a few with validation efforts of phenotype algorithms.

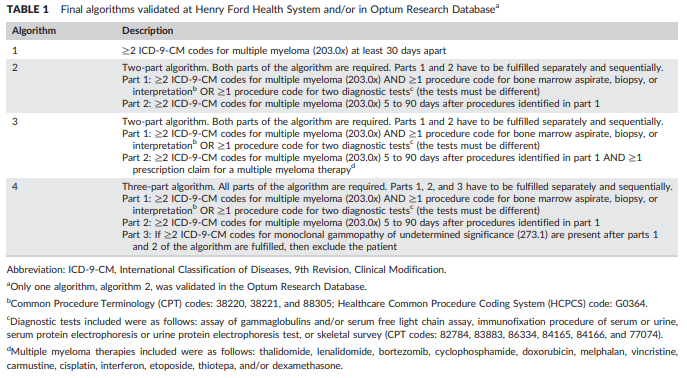
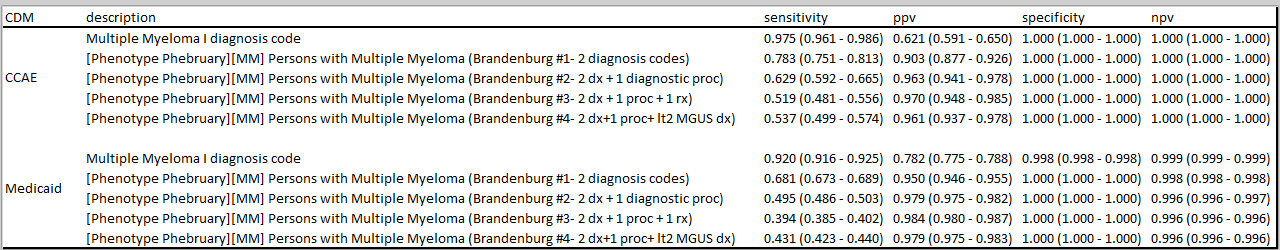
Brandenburg et al, " Validating an algorithm for multiple myeloma based on administrative data using a SEER tumor registry and medical record review", published in Pharmacoepidemiology and Drug Safety in 2019, provides a useful assessment of four alternative phenotype algorithms:

image

The authors developed and evaluated these four algorithms initially within Henry Ford Health System, then applied the algorithm within the Optum claims database to estimate positive predictive value through source record adjudication of a sample of the cases identified by their preferred algorithm (#2).

I’ll note: @jswerdel included this study in his phenotype algorithm performance benchmark, which he presented at OHDSI2020. His past work on this topic made my live a million times easier as I was putting this together, so big shout out and thanks to Joel for that. I’ll let him comment on the empirical results of applying PheValuator to these definitions.

Here’s how we can implement each of the Branderburg algorithms using ATLAS:

Algorithm 1: “≥2 ICD‐9‐CM codes for multiple myeloma (203.0x) at least 30 days apart” (ATLAS-phenotype link here)

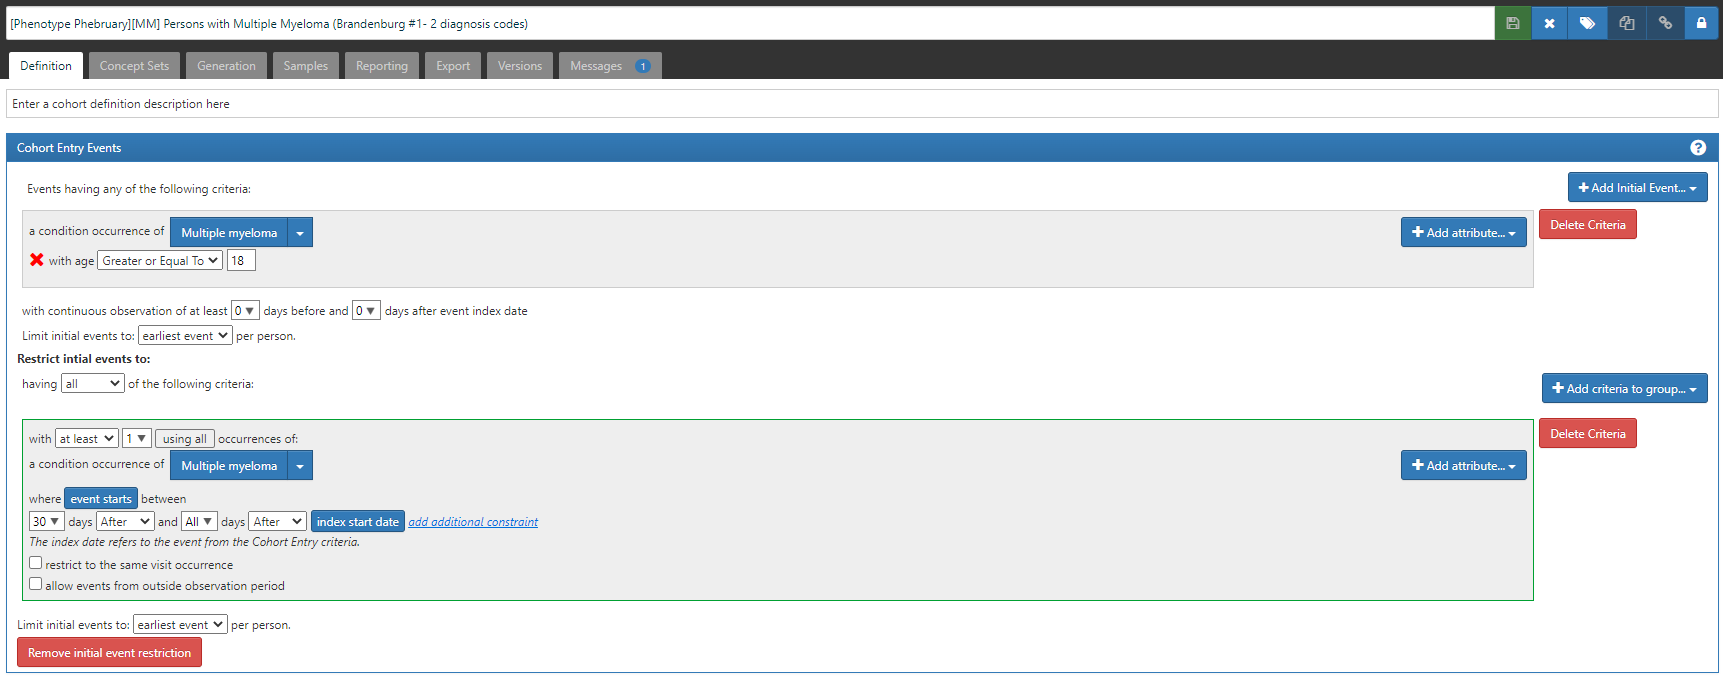
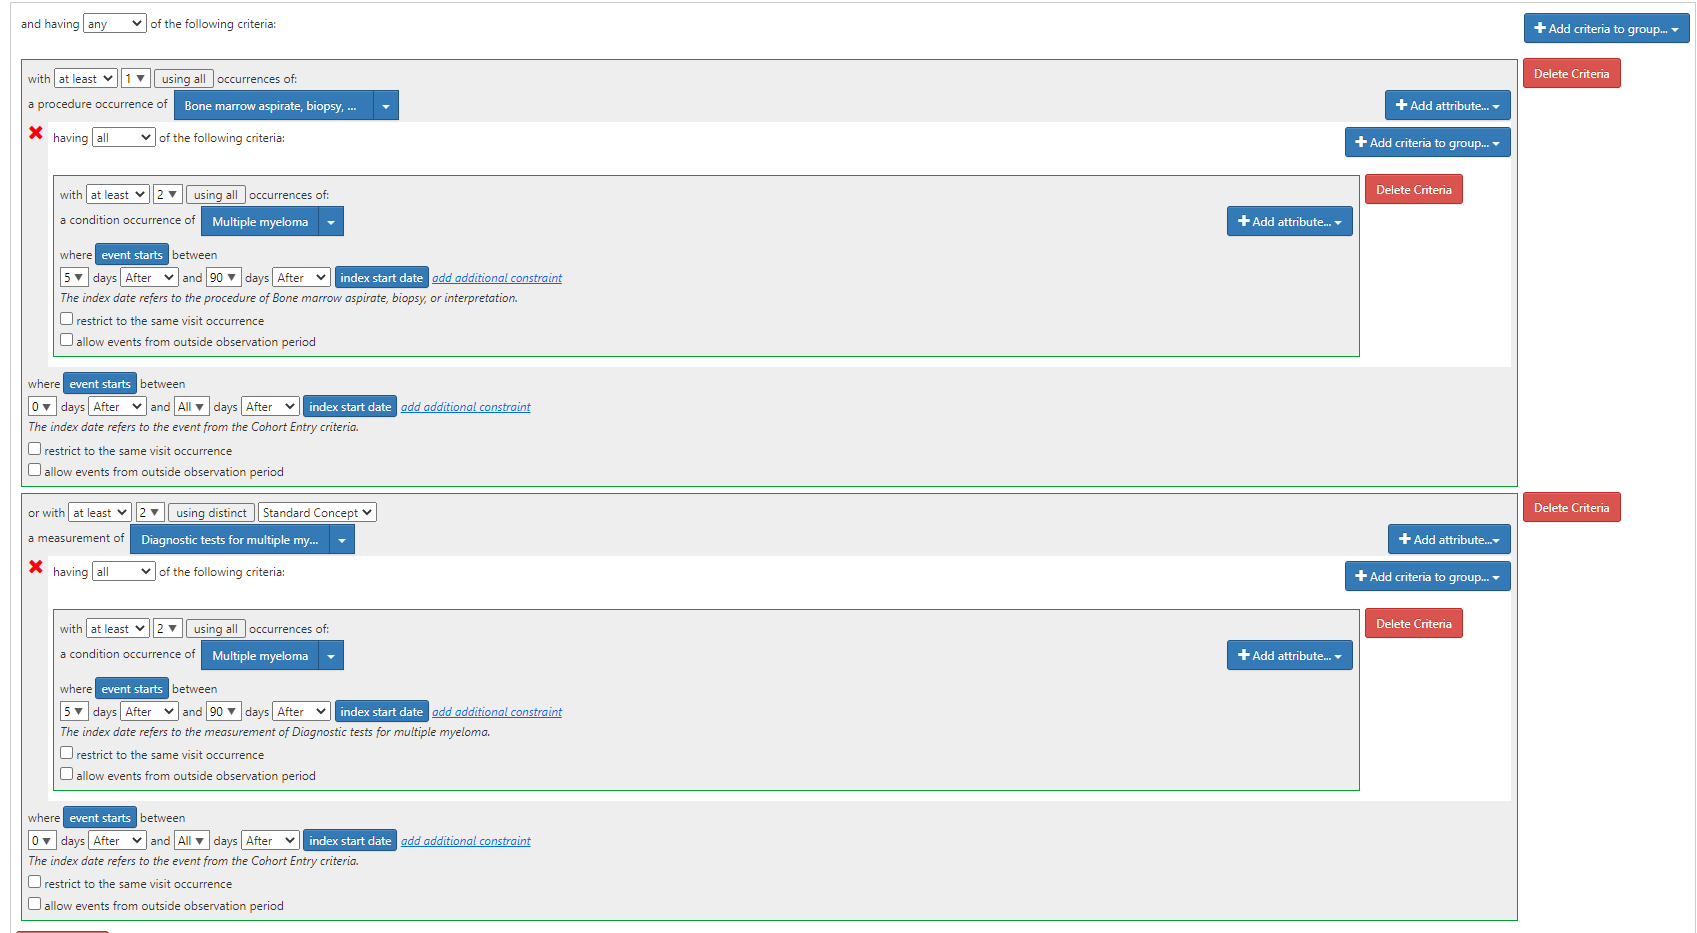
Algorithm 2: “Two‐part algorithm. Both parts of the algorithm are required. Parts 1 and 2 have to be fulfilled separately and sequentially. Part 1: ≥2 ICD‐9‐CM codes for multiple myeloma (203.0x) AND ≥1 procedure code for bone marrow aspirate, biopsy, or interpretation OR ≥1 procedure code for two diagnostic tests (the tests must be different) Part 2: ≥2 ICD‐9‐CM codes for multiple myeloma (203.0x) 5 to 90 days after procedures identified in part 1” (ATLAS-phenotype link here)

Start with algorithm #1, then add this extra clause:

Algorithm 3: “Two‐part algorithm. Both parts of the algorithm are required. Parts 1 and 2 have to be fulfilled separately and sequentially.Part 1: ≥2 ICD‐9‐CM codes for multiple myeloma (203.0x) AND ≥1 procedure code for bone marrow aspirate, biopsy, or interpretation OR ≥1 procedure code for two diagnostic tests (the tests must be different) Part 2: ≥2 ICD‐9‐CM codes for multiple myeloma (203.0x) 5 to 90 days after procedures identified in part 1 AND ≥1 prescription claim for a multiple myeloma therapy” (ATLAS-phenotype link here)

Algorithm 3 amends the clause shown for Algorithm 2 by adding the additional drug requirement:

(note, the drug list used in the publication is likely incomplete, as other drugs are currently in use, including daratumumab, carfilzomib, ixazomib, pomalidomide, elotuzumab, isatuximab, belantamab.

Algorithm 4: “Three‐part algorithm. All parts of the algorithm are required. Parts 1, 2, and 3 have to be fulfilled separately and sequentially.Part 1: ≥2 ICD‐9‐CM codes for multiple myeloma (203.0x) AND ≥1 procedure code for bone marrow aspirate, biopsy, or interpretation OR ≥1 procedure code for two diagnostic tests (the tests must be different) Part 2: ≥2 ICD‐9‐CM codes for multiple myeloma (203.0x) 5 to 90 days after procedures identified in part 1 Part 3: If ≥2 ICD‐9‐CM codes for monoclonal gammopathy of undetermined significance (273.1) are present after parts 1 and 2 of the algorithm are fulfilled, then exclude the patient” (ATLAS-phenotype link here)

I think it’s a nice testament that these fairly complex algorithms, each with their own custom source code lists, could all be modeled directly in ATLAS without any issue. And added bonus, now that they are standardized to OMOP CDM and standard concepts, they’ll work not only for ICD9 codes provided, but can also be extended to other source codes (like ICD10CM to focus on the current myeloma cases in our US databases).

Phenotype evaluation:

Brandenburg et al. used source record verification as their approach to validation in the Optum database, whereby 104 charts were extracted to confirm the diagnosis. Their estimate of PPV was 86%.

In many databases, source records are not available. In other circumstances, the time and resources associated with manual chart review is prohibitive. We’ve talked about PheValuator and CohortDiagnostics as OHDSI tools that can be used to support the evaluation process. Today, I’d like to highlight how patient profile reviews can be conducted directly within ATLAS. By reviewing all available structured data in the CDM for a sample of patients satisfying a cohort definition, an adjudicator can classify cases as ‘true positive’, ‘false positive’ (or ‘inconclusive’) in a manner consistent with source record verification.

So, lets review some patient profiles for algorithm #2 in the MarketScan CCAE database!

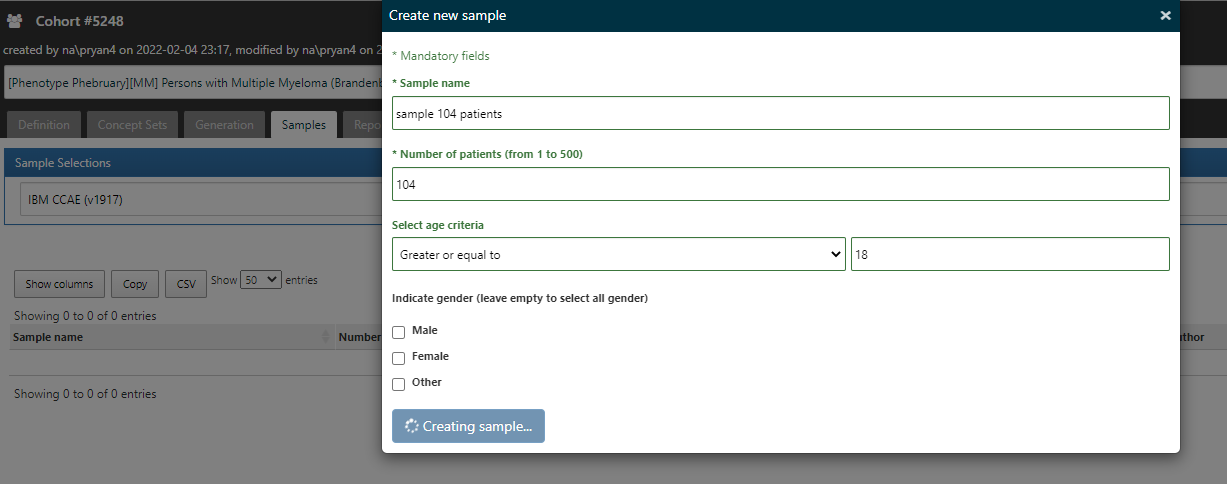
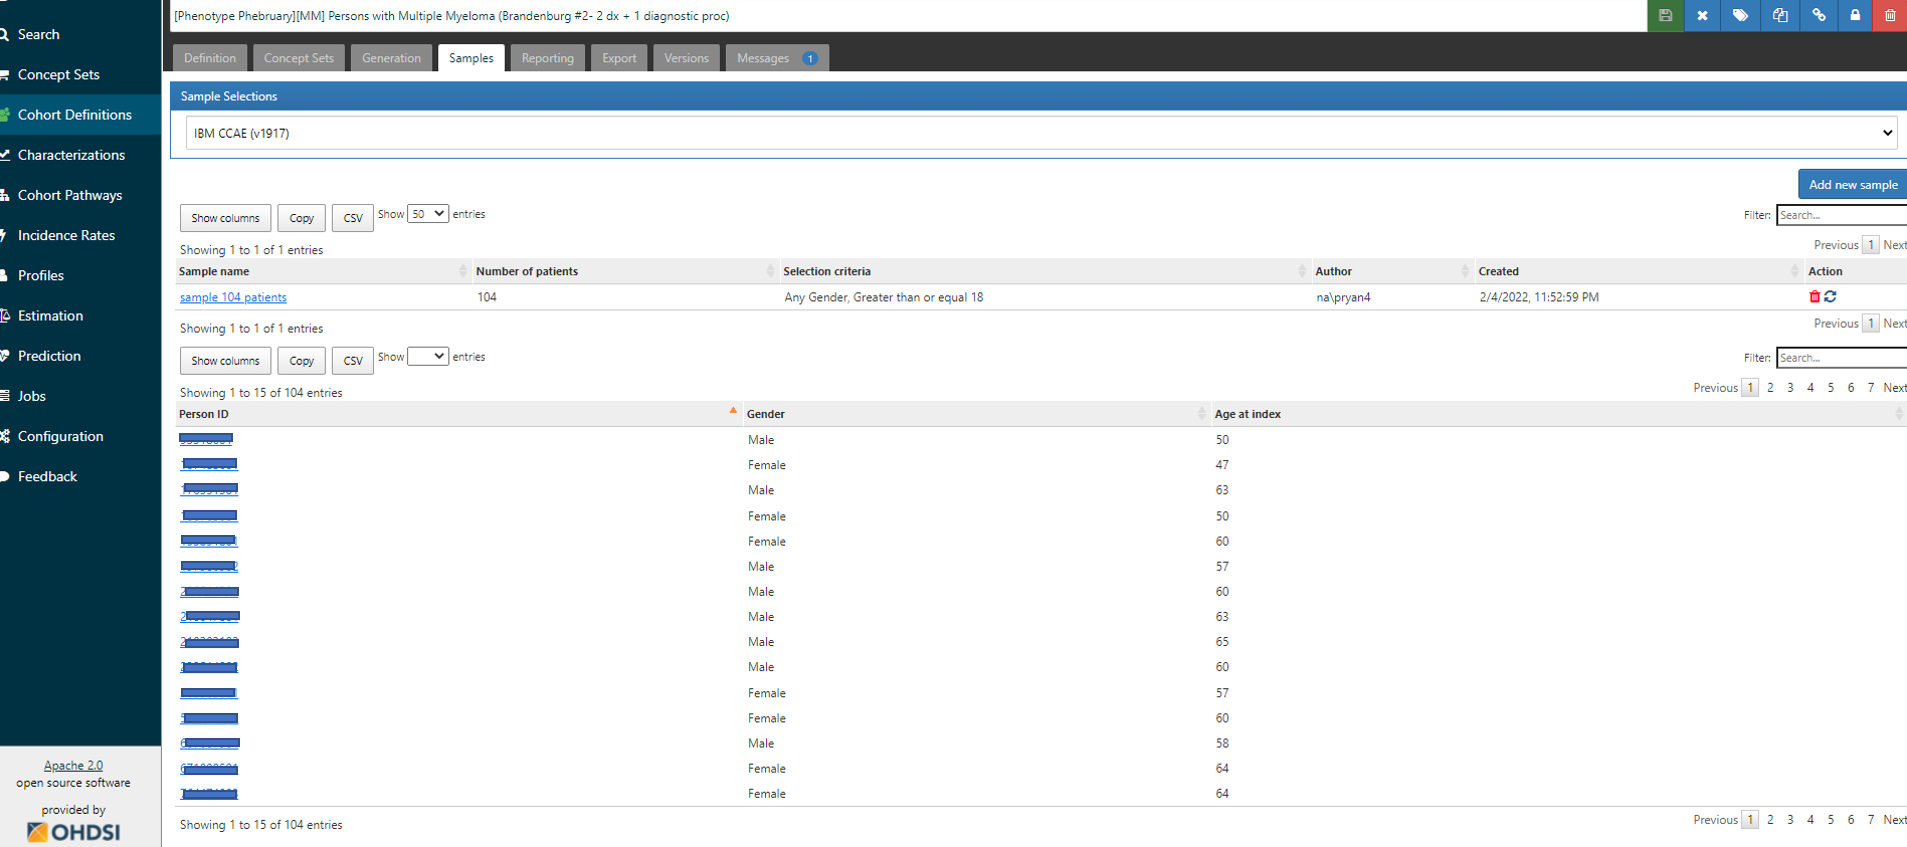
In ATLAS, from the Cohort Definitions left menu, where you’ve built your algorithm under the ‘Definition’ top tab, you’ll note there are other top tabs: Definition, Concept Sets, Generation, Samples, Reporting, Export, Versions, Messages. I start by going to Generation, and executing the cohort definition against the CCAE database (where I find I have 28.151 patients in the cohort). I then toggle over to the Samples tab, and request that I get 104 cases (just like the Optum validation in the Brandenburg study)…

Once the sample is created, I can see links to select any person_id of the sampled cohort members:

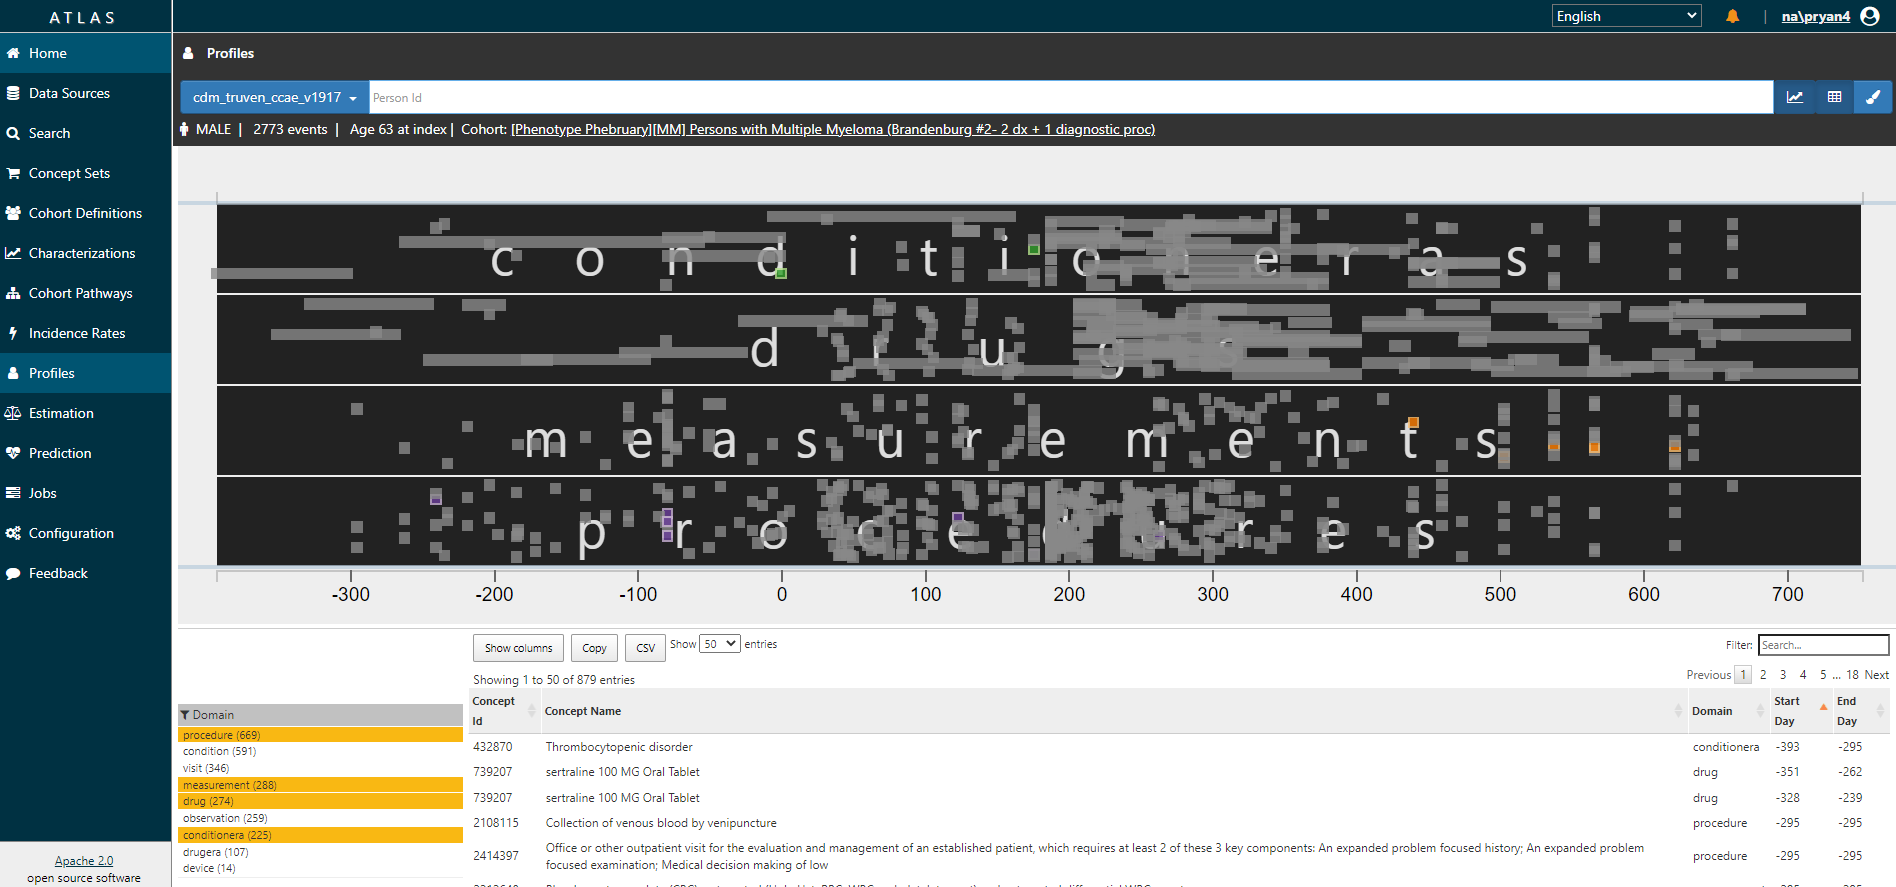
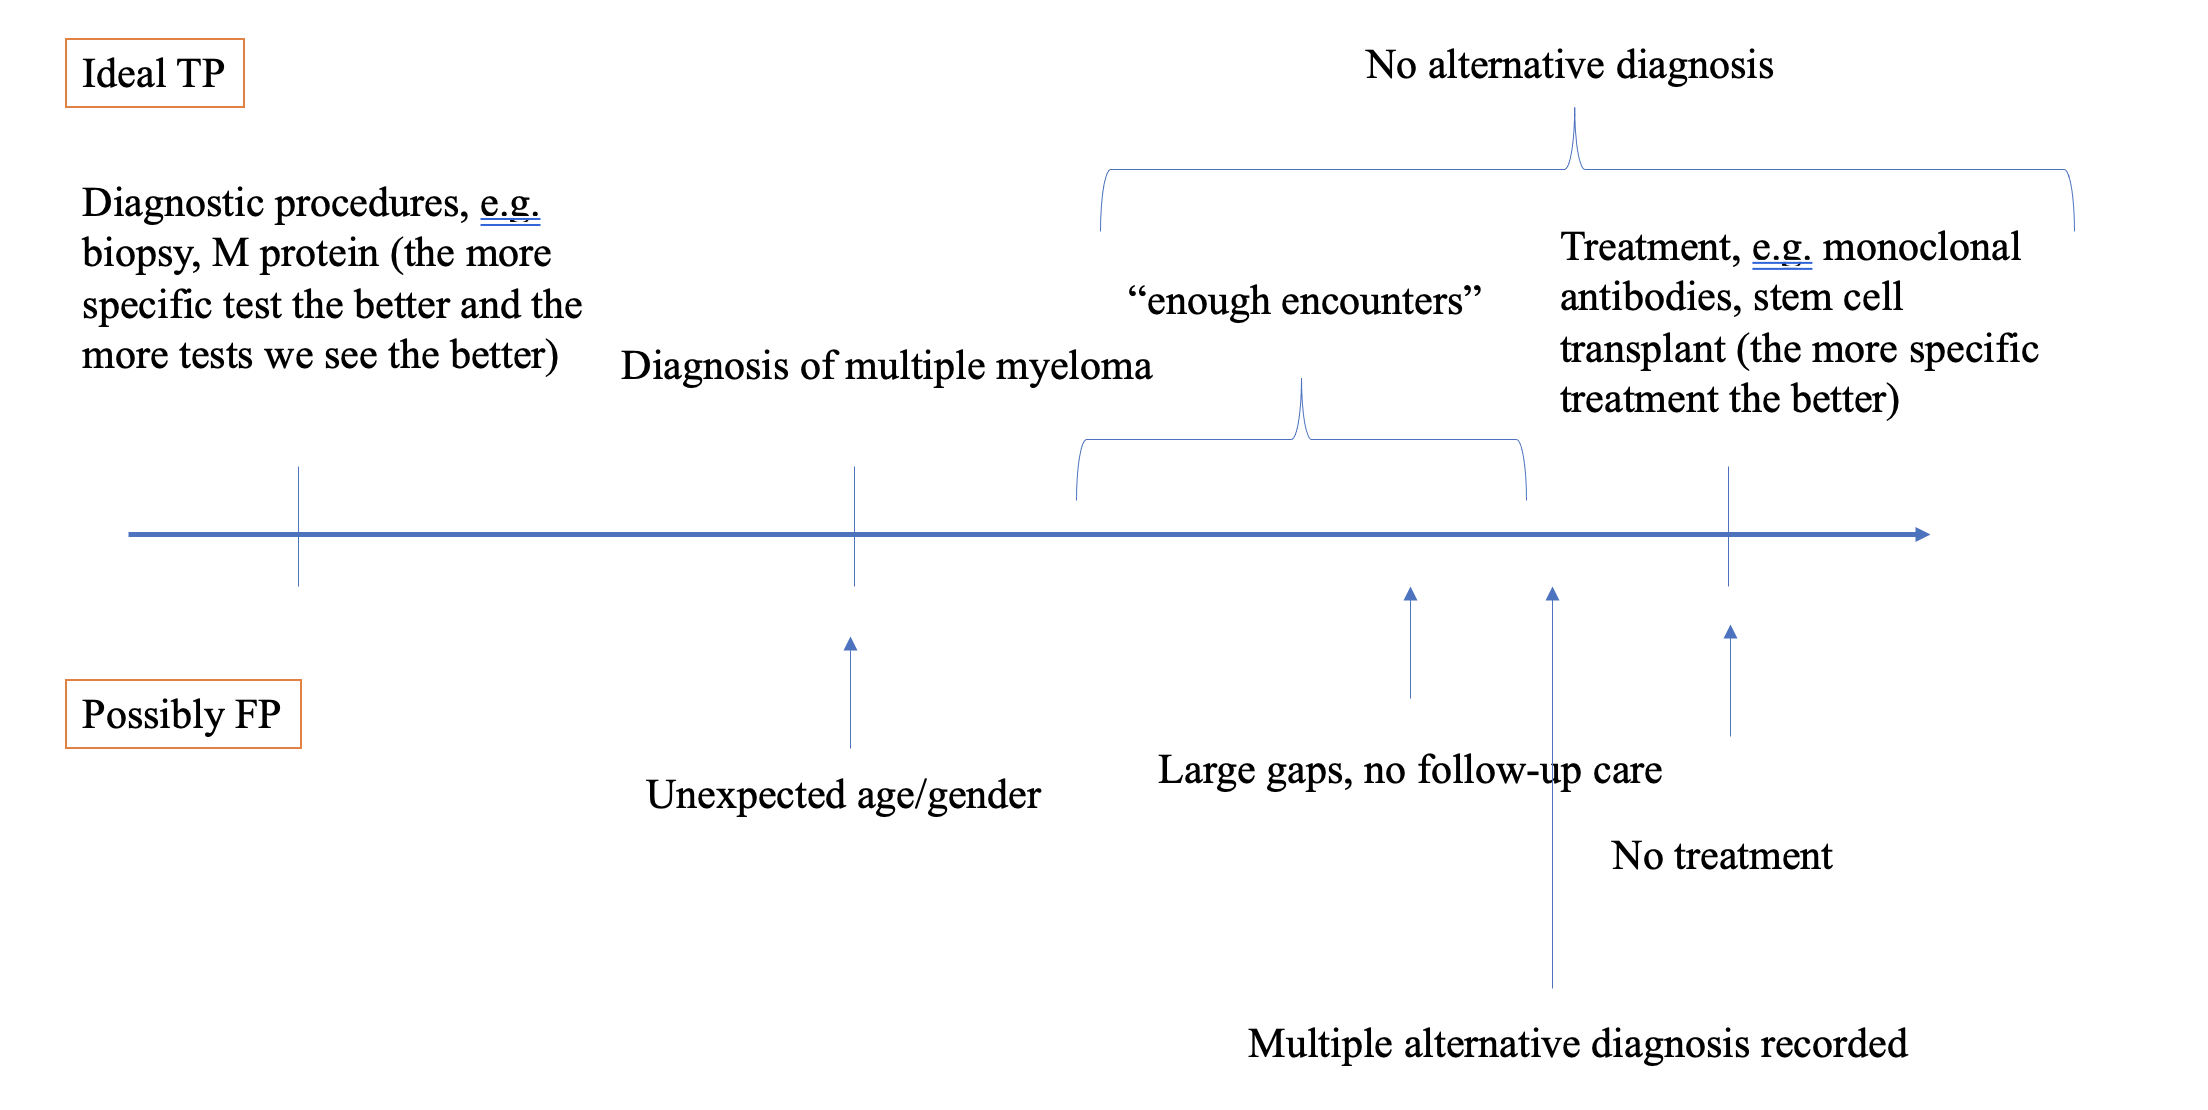
Clicking on any of those links brings you to the Profiles tab. You will see a graphical and tabular representation of all events in the persons’ record. The graph plots the events temporally, with day 0 on the x-axis representing the date that the person qualified for the cohort. You can zoom in and out of the timescale by clicking on the graph, and toggle on/off any of the data domains. And you can color specific events of interest. Here, I’m showing you a given person (id removed), zoomed into the year below and two years after cohort entry, restricted to conditions, drugs, measurements, and procedures, with multiple myeloma diagnoses colored in green, diagnostic tests colored in orange, and bone biopsies colored in blue.

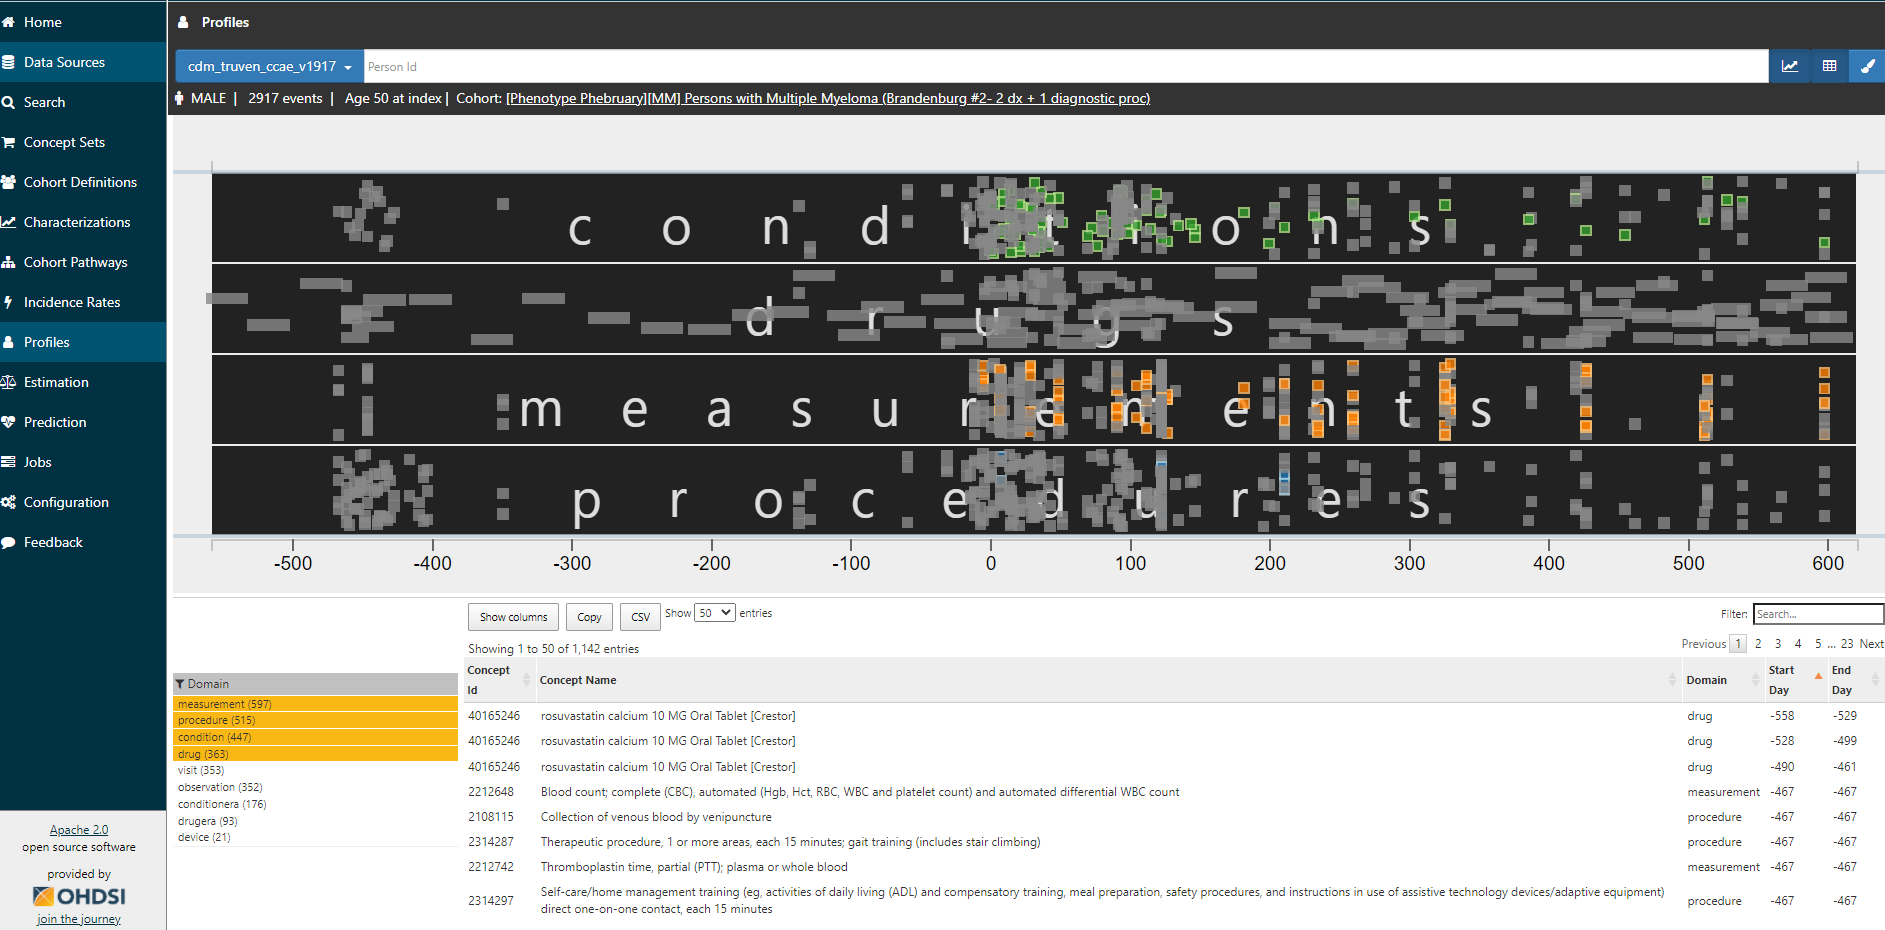
I don’t need to be an oncologist flipping through a paper chart to recognize that this person clearly has multiple myeloma. They have 83 distinct diagnosis codes recorded over two years, more than 100 diagnostic tests, 11 bone biopsy procedure codes. The patient has exposure to various multiple myeloma treatments. including bortezomib (27 drug exposures), ixazomib, dexamethasone, lenalidomide. They take denosumab for bone loss. They are a true positive.

So, tonight, for the fun of it, I reviewed the first 20 of the 104 cases I sampled. ATLAS made it quick and easy, total time was <1 hr. And yet, despite that I’m “only” looking at structured data from an administrative claims database (which often gets disparaged by oncology researchers as being insufficient to study cancers and treatment/regimens), I felt I could make fairly confident conclusions about the case status for almost all of the cases. My strawman tally: 16 ‘confirmed positive’, 3 ‘confirmed negative’, 1 inconclusive. That’d give us a PPV of 84% if we exclude the inconclusive (basically spot on to what Brandenburg observed in Optum). I’ll also note that I found 2 patients with concern about index data misspecification who may have been prevalent cases.

@jon_duke 's team previously presented at OHDSI Symposium about some proposed enhancements to ATLAS to enable formal adjudication of profiles, allowing for reviewers to answer pre-specified questions as they explored the individual cases. When that feature gets released into ATLAS production, I’m sure people will really enjoy using it. But even without it, just the ability to sample cases and review them to draw your own conclusions is extremely helpful. And for those who think chart review is the only way to do validation, this provides a very reasonable approximate that can be directly facilitated by the available data and can be efficiently conducted.

I won’t provide my entire rant here, but validation is quite problematic if all you do is estimate positive predictive value. Without sensitivity and specificity, you can’t truly understand or correct for measurement error. But, given that is very common practice to do chart review and report out a PPV, I hope some will take solace that if you think that’s a valuable aspect of your studies, that you can do it yourself using the OHDSI tools. Knock yourself out.

What do you think can or should be the role of individual case review for phenotype validation? Can electronic patient profiles complement or even possible substitute for source review verification?

1 Like

Would you be able to share one of the profiles that you determined was a confirmed negative? Would be interesting to see that!

Great point @Chris_Knoll, indeed the adjudication process can be subjective and sometimes opaque, and it would be 100% reasonable to question my judgment on this, given that I’m neither a clinician nor an expert in the area. Let me share the patient profile for one of the cases that I deemed a ‘confirmed negative’ and provide my own personal rationale.

So, contrast the patient profile that I shared previously with this profile (zoomed in to show 1 year prior and 2 years after cohort start date (day 0), green dots are ‘multiple myeloma’ diagnoses, orange are measurements for ‘diagnostic tests for multiple myeloma’, purple dots are procedures for ‘bone marrow biopsy, aspiration, or interpretation’, with domains restricted to conditions/drugs/procedures/measurements for a bit more clarity:

This person has 1 day with multiple myeloma codes on day 0, and another day with multiple myeloma codes on day 176, but no mention of multiple myeloma between those days or after the second date. We see that there were bone marrow biopsy on day -79 and again on day +123, but nothing immediately proximate to either day with the multiple myeloma diagnosis. The diagnostic tests we may want to see occur well after the second day of diagnoses: Immunoglubilin on day 440, 500, 538, 566, 622. This person has no drug treatments for multiple myeloma that I could find, definitely not within 90d of either diagnosis.

What this person does have however is a compelling alternative medical history narrative. The person has thrombocytopenic disorder that has been observed essentially continuously for the prior 8 years, straight through the cohort index date. The patient had regular history of use of steroids (prednisone, methylprednisolone) the years leading up to cohort entry. For the three months leading up to cohort entry, the patient had diagnoses for ‘Myelodysplastic syndrome’ and is treated with azacitidine, a chemotherapic agent for MDS for many months thereafter. Then from day 188 to day 213, the patient underwent a series of procedures for allogenic bone marrow transplantation. The patient subsequently gets multiple diagnoses for chronic lymphoid leukemia, myeloid leukemia and malignant lymphoma.

So, my interpretation: this person clearly had a long history of platelet issues, then was diagnosed and treated for MDS. And during that time, while they were trying to settle on the MDS diagnosis and then again just prior to the bone marrow transplant, they were evaluating for other conditions, such as multiple myeloma. But there’s nothing to suggest follow-up behaviors to believe the MM is real. And yet, it should be clear why this person did meet the objective criteria of the cohort definition: the person DID have 2 diagnoses and DID have a prior bone marrow biopsy. One could imagine, if you wanted to refine the MM definition to remove cases like this, you could impose an additional inclusion criteria to allow for 0 occurrences of MDS diagnosis or 0 exposures to MDS treatments…but of course, each rule added to increase specificity will come at a potential cost of decreasing sensitivity.

As I hope this case study demonstrates, I think the claims information was more than sufficient to get a pretty accurate picture of the patient story, at least for purposes of doing this adjudication to conclude this person is a ‘confirmed negative’ for multiple myeloma. Now, it would be really cool is I didn’t have to sift through the data points to connect all the dots and manually figure out this narrative, but instead that we had the ability to apply existing knowledge graphs within a novel informatics framework to automatically tell this story for me. Sounds like a great PhD/postdoc research opportunity (wink wink @aostropolets @callahantiff ).

1 Like

I love the narrative in this new phenotype, @Patrick_Ryan! Straight to the point that I was mentioning yesterday during the office hours with @Gowtham_Rao!: clinical validity is of essence in cohort definitions. It is extremely useful and reassuring to run internal validation such as stability across data sources, and sub populations (calendar years, gender, etc) and it is just great and super useful to have packages like Phevaluator, cohort diagnostics, phoebe, etc to assess that. Next, we need to bring focus to the clinical side of our cohort definition systematically: is it capturing the clinical features that we are aiming to? It is awesome how you were able to estimate PPV in your MM phenotype without quitting Atlas by reviewing patient profiles, but I honestly miss the complete picture: how many true MM cases were actually not captured with your phenotype? I.e., how can we estimate the sensitivity of our cohort definitions? @Marcela shared with me some interesting comments on this line of thought that @Andrew and @schuemie posted some time ago in a forum thread. In fact, it was suggested oncology as a promising starting point for this to evolve in OHDSI. I Can’t wait for the next phenotype! :grinning:

Thank you very much for your in-depth explanation, @Patrick_Ryan ! I certainly did not want to come across as questioning your judgment, but was genuinely interested in seeing what a negative case looks like compared to the positive. That was a very thoughtful and deep analysis of what was shown in the negative profile, and I’m left scratching my chin about what sort of logic can be incorporated to rule out these sorts of false positives. Maybe if we see enough cases, there could be something like a ‘at least 2 of N of the following criteria:’ expressions that can be used to help give more certainty about the classification, but to your point, it’s a balance between specificity and sensitivity.

Thanks again for such a detailed explanation of the alternative profile.

Thanks @Patrick_Ryan! So happy to see we are doing oncology and looking forward to continuing this and working on more phenotypes in the Oncology WG and contribute to the phenotype library.

Something I have been struggling with for a long time is the performance of these complex definitions across different types of data. The fundamental issue with these phenotypes is that they want to be universal, but in fact they are a mixture of clinical logic, tacit postulations about the availability of the data and the certainty of a record.

In the case of MM, for example, there is lack fo certainty in the MM codes, so the algorithm incorporated diagnostics testings (BMB/A and other diagnostic tests) to ensure a definitive diagnosis. However, the combination of MM codes and diagnostic codes can be observed during a MM rule-out work up. So two additional diagnosis for MM 5-180 days after the last procedure are also added to the definition. Essentially, lack of certainty in each data point and the assumption that such data is available in the databases has resulted in such a complex algorithm based on a clinical logic. Problem here is that the uncertainty in the captured data and the data availability are variable across datasources. This has huge implication on the performance of these definitions across databases. We need to think about a solution.

1 Like

what you have illustrated here for all of us to learn from - is learning from patient profile to find people who may not have the condition, and develop rules to remove them (thereby increasing specificity)

I think we can definitely learn from the false positive. If we can identify patterns, and create rules to remove people who fit that pattern - we can improve specificity and sensitivity of the cohort definition.

Here are the results from PheValuator for MM:


I added in a 1X code algorithm for comparison. We see that adding a second diagnosis code or more increases the PPV at the expense of sensitivity. An interesting thing here is that adding more parameters above a second diagnosis codes does increase the PPV modestly at the expense of sensitivity. These results show higher PPV than in the Brandenburg paper and from @Patrick_Ryan examination of patient profiles. Using chart or profile validation gives a binary result, case or non-case. PheValuator uses all the data to assess performance so instead of 0% or 100%, it uses the predicted probability between 0-100%. Looking at @Patrick_Ryan example above, the subject likely does not have a zero probability of MM so that subject’s probability, let’s say 20%, is included as a partial case in the analysis (0.2 as case, 0.8 as non-case). I’d be interested in an oncologist’s view of how well diagnostic testing works for MM, how easy is it to differentiate MM from other diagnoses, how many patient’s can live for years with untreated MM, etc. I think these type of questions are essential to ask as a starting point when analyzing phenotypes for algorithm performance accuracy.

I very much like what @jswerdel showed us here. The evaluation clearly illustrates that PPV alone is not enough to evaluate the phenotype. And as @agolozar points out, there is a need to better understand the performance of the phenotypes across all participating data partners. Now, we can’t really expect all of them to do an extensive chart review nor it is feasible to do it on claims data sources. We can use Phevaluator to estimate the performance but it would be really nice to also get an idea of what type of patients we include, their disease history, etc. - what @david_vizcaya calls a narrative/clinical validity.

Since patient profiles (or other patient descriptions) enable us to examine such clinical validity and incorporate our observations into a better version of the phenotype. For example, as @Gowtham_Rao said, we can learn from false-positives and refine the definitions. I’m thinking we can operationalize some of the criteria that make us think that the case is false positive, like:

  • Presence of alternative diagnosis after the index date. It is quite possible that we may observe alternative diagnoses before the index date (especially for complex conditions) but by that time we expect them to be ruled out. Hard problem here if to distinguish between possibly co-occurring disorders and mutually exclusive disorders;
  • Implausible data density/visit context. For example, if multiple myeloma requires impatient stays, having 0 events for a year after the index date is suspicious;
  • Absence of treatment and/or diagnostic procedures. Tricky, because patients can legitimately be diagnosed outside of the system. Also, sometimes they don’t get specific treatment - CKD is a good example.
  • Implausible age+gender. For example, in one of OHDSI studies we even incorporated age in our asthma drug-based definition.

In a very simplified form, we would expect true positives and true negatives to look something like this:

And in a real cohort, we can observe a whole spectrum of patients from “very likely true positive” to “very unlikely true positive”. What I struggle with here is how to come up with rules/examples for false negatives - those patients who do not have the necessary elements of the phenotype in their data yet have the disease (and how to figure out they have the disease).

Let me just say, and not specific to this phenotype, that this is an incredible amount of knowledge about phenotyping being produced and illustrated. I wonder how to distill all this down into the Book of OHDSI or some other phenotyping publication.

1 Like

Thanks @hripcsa , On March 1, maybe we find a book publisher to package up our community discussion and get it out to the world :slight_smile: But first, let’s have 28 engaging community discussions to learn from each other. The more that everyone participates and contributes to the conversation, the more that this will become a rich resource that we can all benefit from. Lots of phun Phenotype Phebruary phacts and phigures coming out to showcase important methodological and clinical aspects that are phundamental to all of our OHDSI evidence-generation activities.

1 Like

Friends:

I am watching this curiously mostly from the distance (shame on me), and this is not to diminish the value of a systematic effort driven by an enormous will power, as it is hard and arduous. But I have an issue. Here it is:

Why do we need phenotypes to identify patients with a condition? Drug is not a problem, we don’t have to double guess, and neither is procedure, visit, measurement or device. Any of these facts are either captured or not, and if they are we are pretty sure we got them. Why do we need to do all these gymnastics to chase conditions so badly?

@agolozar alluded to it. There is a conspiracy against us. Diagnoses are:

  • Captured at a rate anywhere between 0 and 100%. Itch on the head is an example of the former, anything with severe impact on life like a myocardial infarction is typical for the latter. The problem is that effect is not only intrinsic to the type of diagnosis, it also has a huge variability between data sources.
  • Changing and sometimes never final. An myeloma patient will have a diagnosis of a syncope in the emergency call report, an anemia in the ambulance, a monoclonal gammopathy in the ER and a multiple myeloma in the hematology/oncology department. It’s still one and the same disease.
  • Hard to make, meaning, even the physician does not know. Myeloma can mimic other diseases and linger around for a while, till the telltale signs become apparent. Some diagnoses are never made, a problem typical for rare diseases.
  • Imprecise and jargony. For example, “multiple myeloma” could mean an acute onset or the long term disease. “Allergy” can mean the actual allergic response or the sensitivity to some allergen.

So, what do we do? We create these complicated heuristics using a bunch of tricks:

  • Repetition of diagnoses over time,
  • Addition of circumstantial evidence (procedure of bone marrow aspiration before diagnosis)
  • Elimination of alternatives and implausibilities as per @aostropolets,
  • Re-diagnosis from symptoms, lab tests, path lab or imaging results,
  • Combination of these different methods using Boolean logic.

Nothing wrong with that, except their purpose is not transparent and each of them can have side effects, which makes it very hard to debug them. We, and of course everybody else, create these “best practice” definitions, but without asserting which problem with the diagnoses we think we are addressing using what mechanism. In addition, the definitions become heavily interdependent with the data source they are applied to, and in those cases where we admit that relationship we use imprecise categories (“this definition works in claims data”). Finally we have the use case problem, where definitions seemingly differ if they are employed in exposure or outcome cohorts.

And on top of all that we mix the heuristics with the the true inclusion criteria belonging to the study design (“age>=18”).

This is a black box situation we ought to avoid at OHDSI. Not sure what that would look like, but the ideas that come to mind are:

  • The definition of the use case
  • A heuristics synopsis explaining the problems and solutions applied
  • An annotation of each criterion explaining its purpose

We could also start using @aostropolets’ concept prevalences to make criteria dependent on the capture rate in a specific database compared to the overall availability. But that would be a bigger undertaking.

Thoughts?

2 Likes

Just realized this debate is better had here. Let’s continue there.

The Brandenburg definitions do not work on Flatiron. In that data using a single condition occurrence might be sufficient.

t