Welcome everyone to Day 2 of Phenotype Phebruary! I hope you enjoyed reading the kick-off to the discussion of phenotyping Type 2 Diabetes Mellitus on Day 1, and encourage you to join that conservation. Meanwhile, here, I hope to stimulate another discussion, this one on Type 1 Diabetes Mellitus (T1DM).
Now admittedly, I wasn’t planning to consider T1DM as a phenotype to work through during the month, because I thought it might be too close in spirit to T2DM. However, the community spoke loudly in their voting, with 20 individuals asking to explore T1DM, putting it in the top 5 of desired targets, so here we are.
And since we did T2DM yesterday, I figured today’s a good opportunity stay in this related space, but highlight some different insights and observations that arise from going through the OHDSI phentoype development and evaluation process.
Clinical description:
As with T2DM, we can look to the American Diabetes Association (ADA) “Standards of Medical Care in Diabetes” to provide a helpful frame of reference for the disease. ADA classifies diabetes into "the following general categories:
- Type 1 diabetes (due to autoimmuneb-cell destruction, usually leading to absolute insulin deficiency, including latent autoimmune diabetes of adulthood)
- Type 2 diabetes (due to a progressive loss of adequate b-cell insulin secretion frequently on the background of insulin resistance)
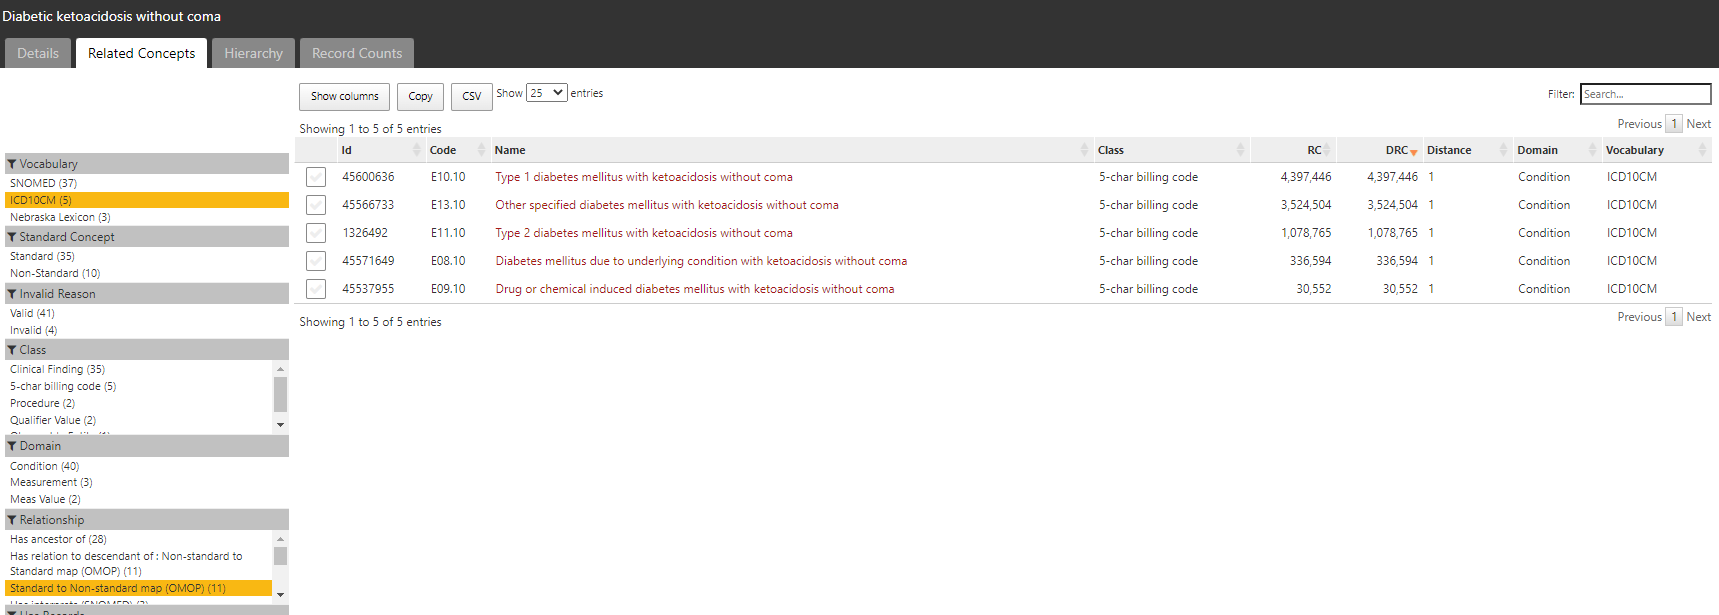
- Specific types of diabetes due to other causes, e.g.,monogenic diabetes syndromes (such as neonatal diabetes and maturity-onset diabetes of the young), diseases of the exocrine pancreas (such as cystic fibrosis and pancreatitis), and drug- or chemical-induced diabetes (such as with glucocorticoid use, in the treatment of HIV/AIDS, or after organ transplantation)
- Gestational diabetes mellitus (diabetes diagnosed in the second or third trimester of pregnancy that was not clearly overt diabetes prior to gestation)"
Here, I find the ADA’s discussion about the evolving landscape of T1DM and T2DM quite informative:
“Type 1 diabetes and type 2 diabetes are heterogeneous diseases in which clinical presentation and disease progression may vary considerably. Classification is important for determining therapy, but some individuals cannot be clearly classified as having type 1 or type 2 diabetes at the time of diagnosis. The traditional paradigms of type 2 diabetes occurring only in adults and type 1 diabetes only in children are no longer accurate, as both diseases occur in both age-groups. Children with type 1 diabetes typically present with the hallmark symptoms of polyuria/polydipsia, and approximately one-third present with diabetic ketoacidosis (DKA). The onset of type 1 diabetes may be more variable in adults; they may not present with the classic symptoms seen in children and may experience temporary remission from the need for insulin…It is important for the provider to realize that classification of diabetes type is not always straightforward at presentation and that misdiagnosis is common (e.g., adults with type 1 diabetes misdiagnosed as having type 2 diabetes; individuals with maturity-onset diabetes of the young [MODY] misdiagnosed as having type 1 diabetes, etc.). Although difficulties in distinguishing diabetes type may occur in all age-groups at onset, the diagnosis becomes more obvious over time in people with β-cell deficiency.”
The epidemiology and disease natural history of T1DM is well characterized. Initial diagnosis is commonly in children and young adults, and more prevalent in males than females. Most patients with Type 1 diabetes require insulin therapy. Complications associated with insufficient management can include acute hypoglycemia, diabetic ketoacidosis and hyperosmolar coma. Incidence of T2DM varies globally, with highest rates in Scandinavia and lowest rates in Asia.
Cohort definitions:
Here, I’ll present two cohorts. The main point to highlight here is that these cohorts were created in ATLAS by copying the T2DM cohorts from yesterday, and simply swapping out the conceptsets in the entry event with the conceptset in the inclusion criteria. So, total time to build these cohorts = <2 minutes. Behold the beauty of re-usable components! No wheel reinvention necessary!
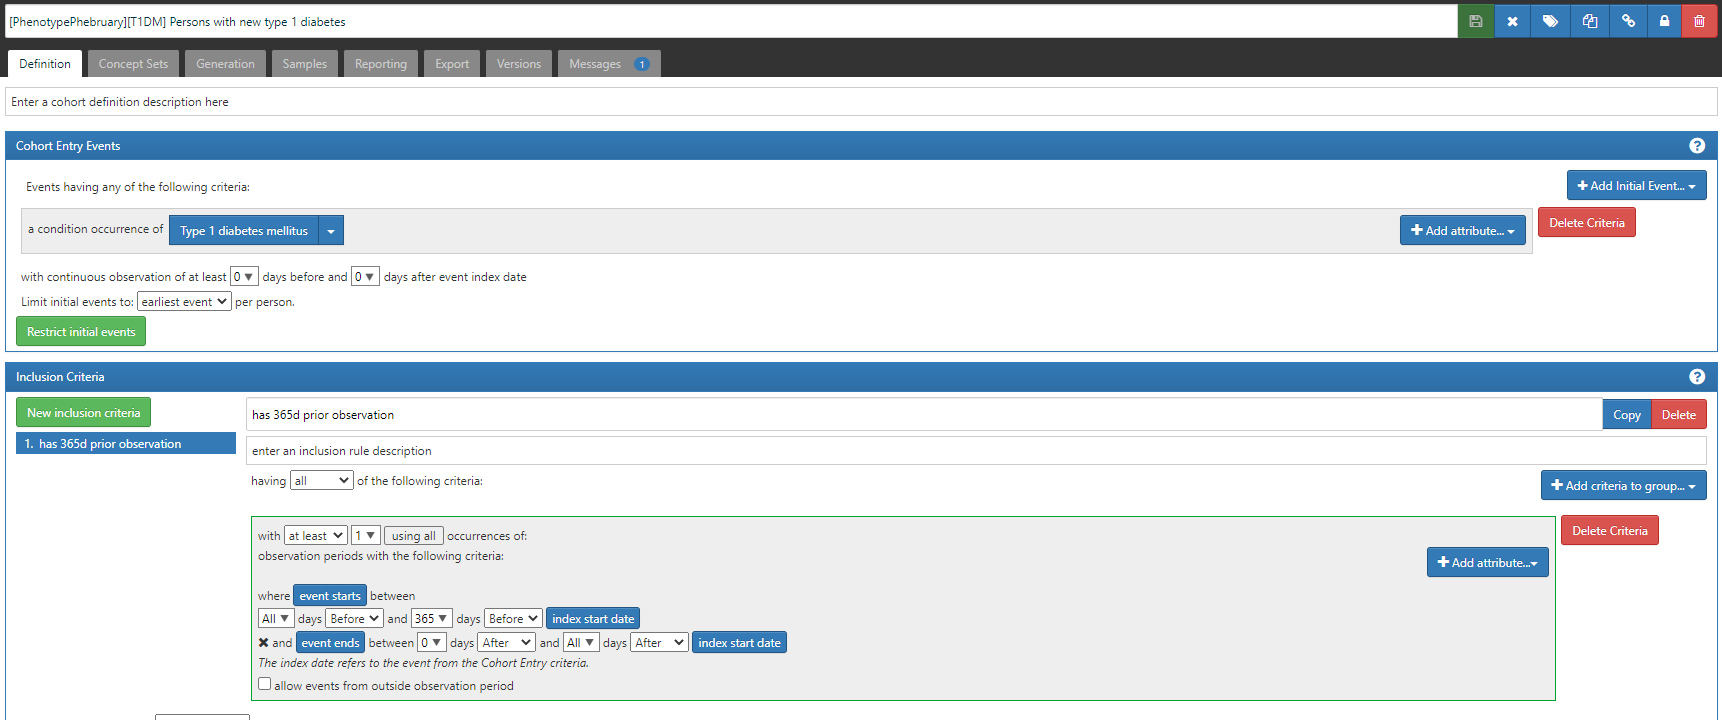
#1 (which will be listed in CohortDiagnostics as C5): ‘Persons with new type 1 diabetes’, based on earliest event of a condition occurrence of a ‘Type 1 diabetes mellitus’ concept (ATLAS-phenotype link here; with a reminder that if you do not yet have access to this ATLAS instance, simply fill in this form)
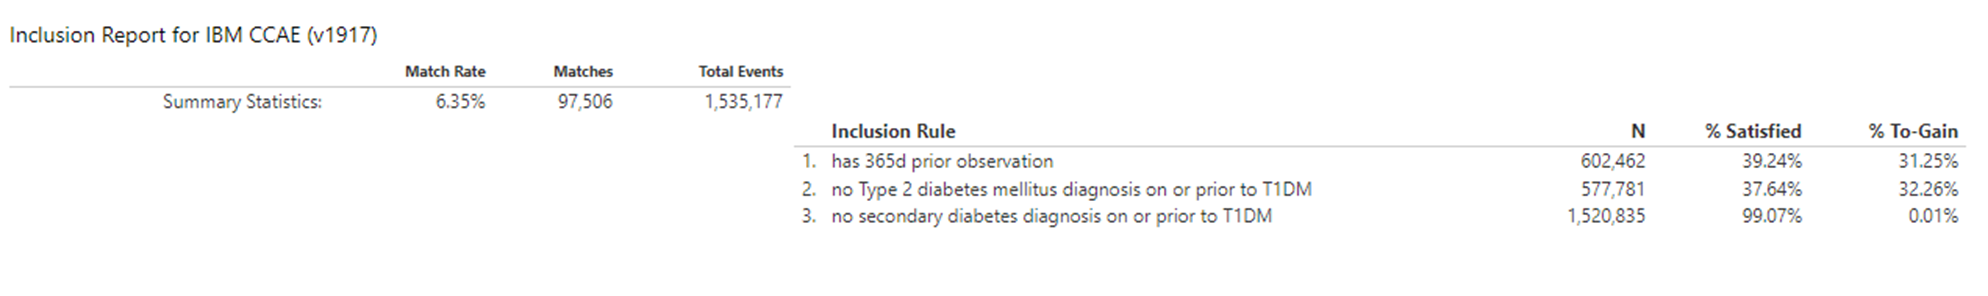
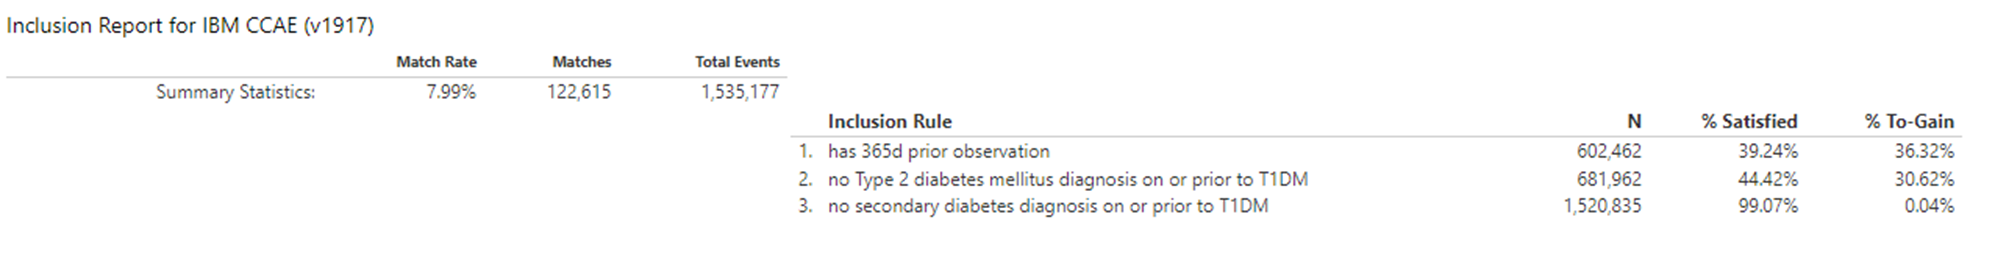
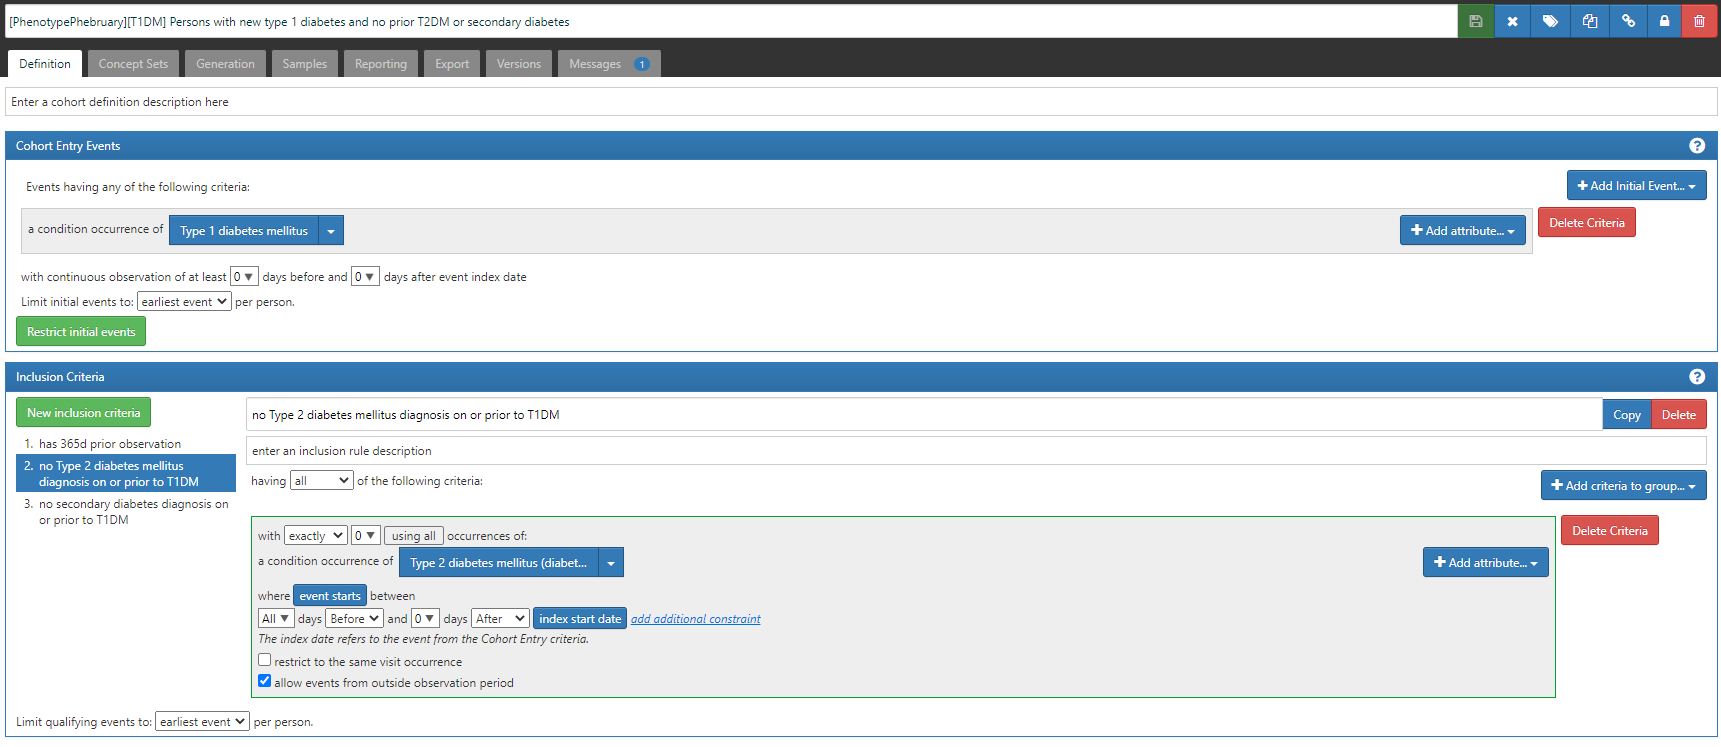
#2 (which will be listed in CohortDignostics as C4): ‘Persons with new type 1 diabetes and no prior T2DM or secondary diabetes’, based on the earliest event of a condition occurrence of ‘Type 1 diabetes’ concept, but also imposing two inclusion criteria that there are 0 condition occurrences of either a ‘Type 2 diabetes’ concept or a ‘secondary diabetes’ concept (ATLAS-phenotype link here).
So, I’ll use this post to take a little detour to discuss the conceptset expression for ‘Type 1 diabetes mellitus’ and how we can use PHOEBE to develop and evaluate the conceptset.
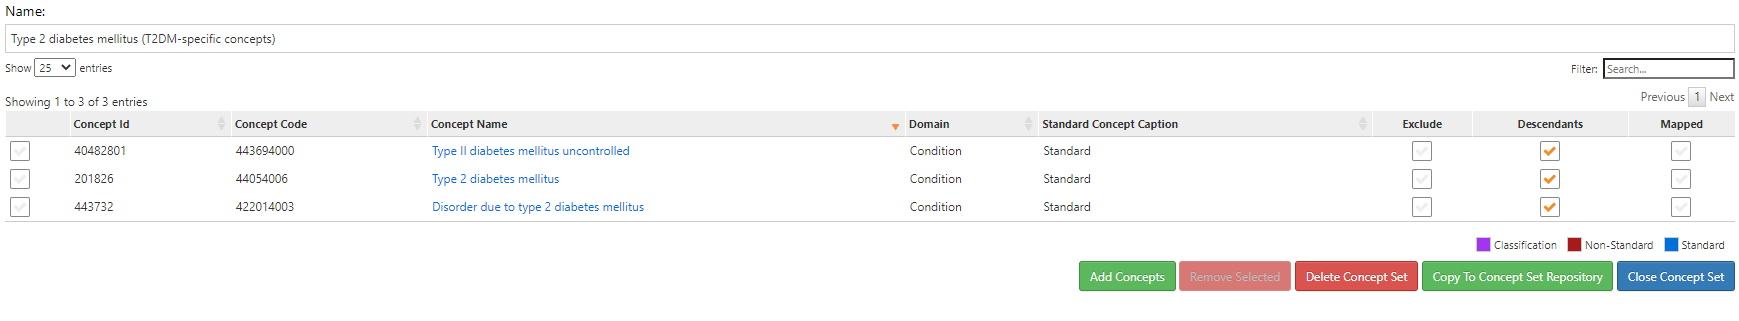
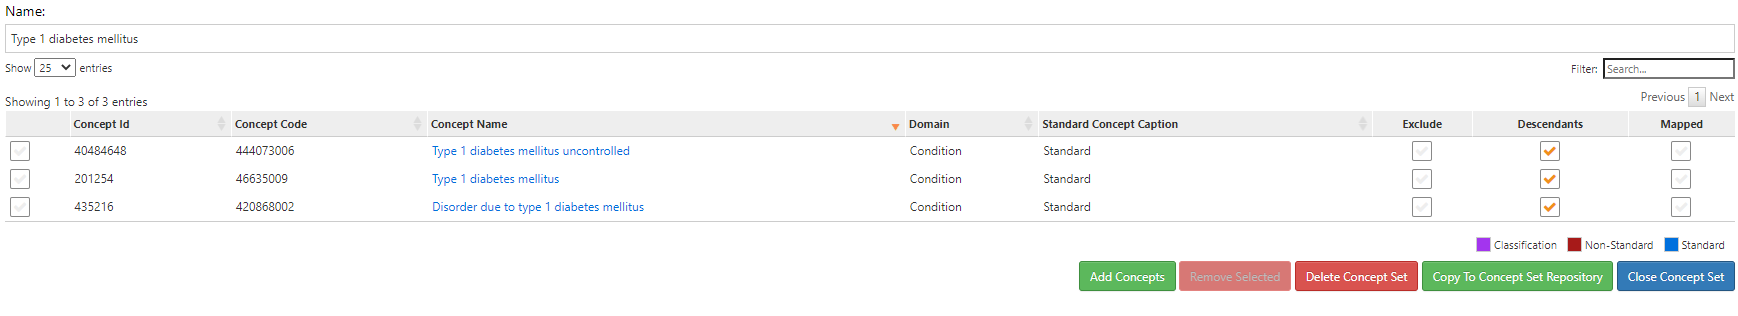
The conceptset expression is quite straightforward, using 3 concepts + their descendants: ‘Type 1 diabetes mellitus’, ‘Type 1 diabetes mellitus uncontrolled’, and ‘Disorder due to type 1 diabetes mellitus’.
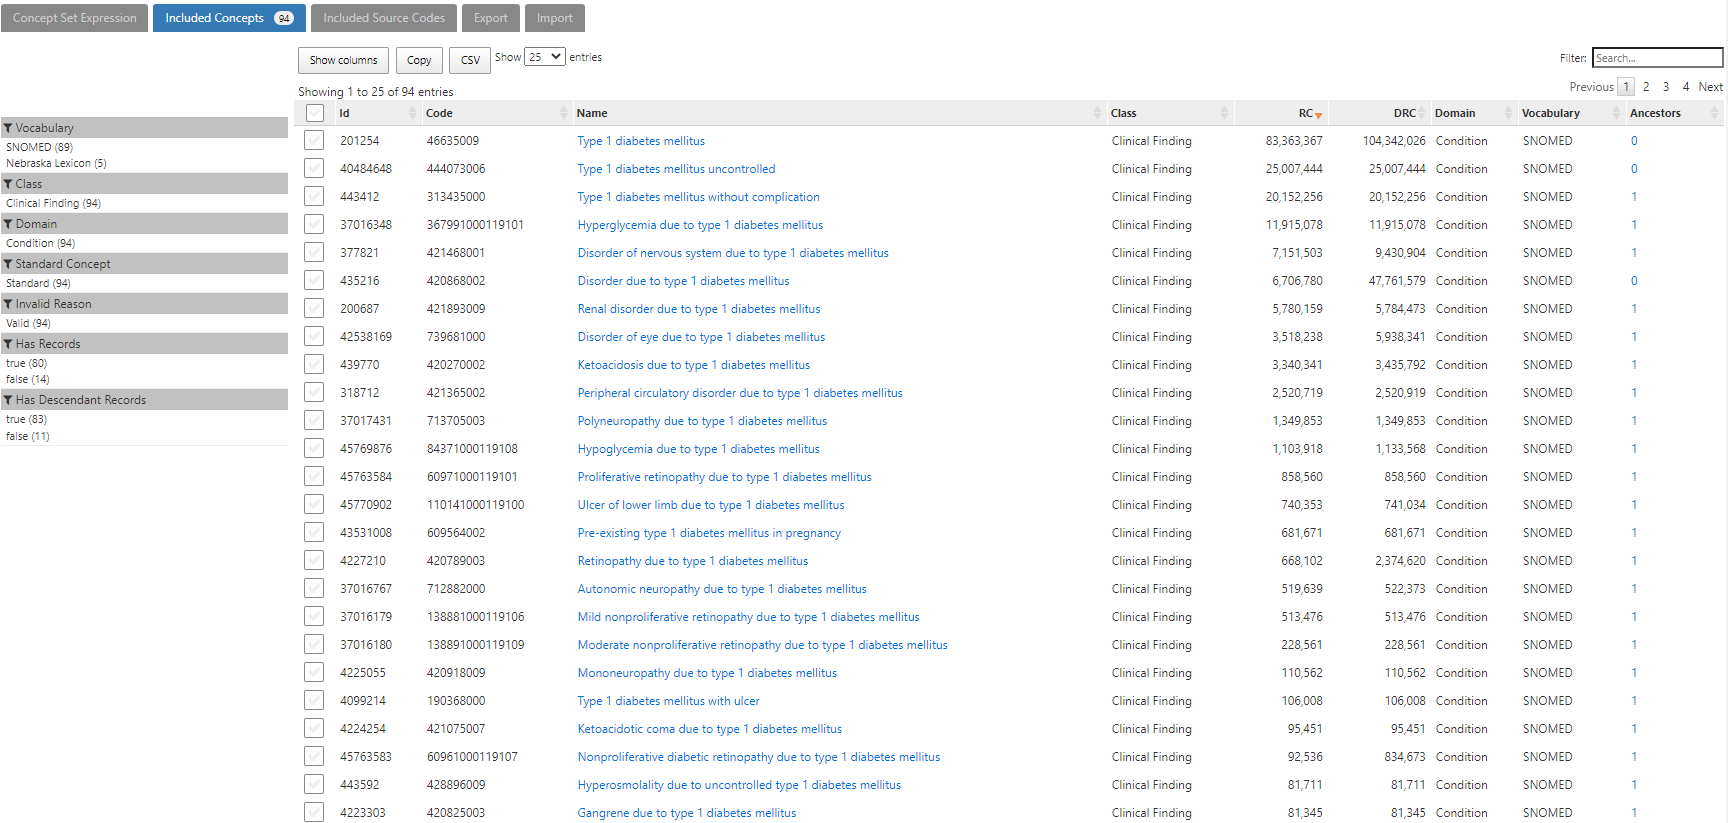
That conceptset expands out to 94 standard concepts, which I show in ATLAS sorted by the record count in descending order to give a sense of which concepts appear most commonly across the OHDSI data partners who contributed to the Concept Prevalence study that @aostropolets led. We can see that, while there are 94 standard concepts to consider, the top 10 comprise the overwhelming majority of the data.
PHOEBE is a recommender system, developed by @aostropolets . It has two primary functions: 1) recommend an initial concept to start your conceptset building activity, and 2) recommend additional concepts to consider based on your current list of concepts. You can access PHOEBE at : https://data.ohdsi.org/PHOEBE/
Let’s see what PHOEBE does when we try to find an initial starting concept:
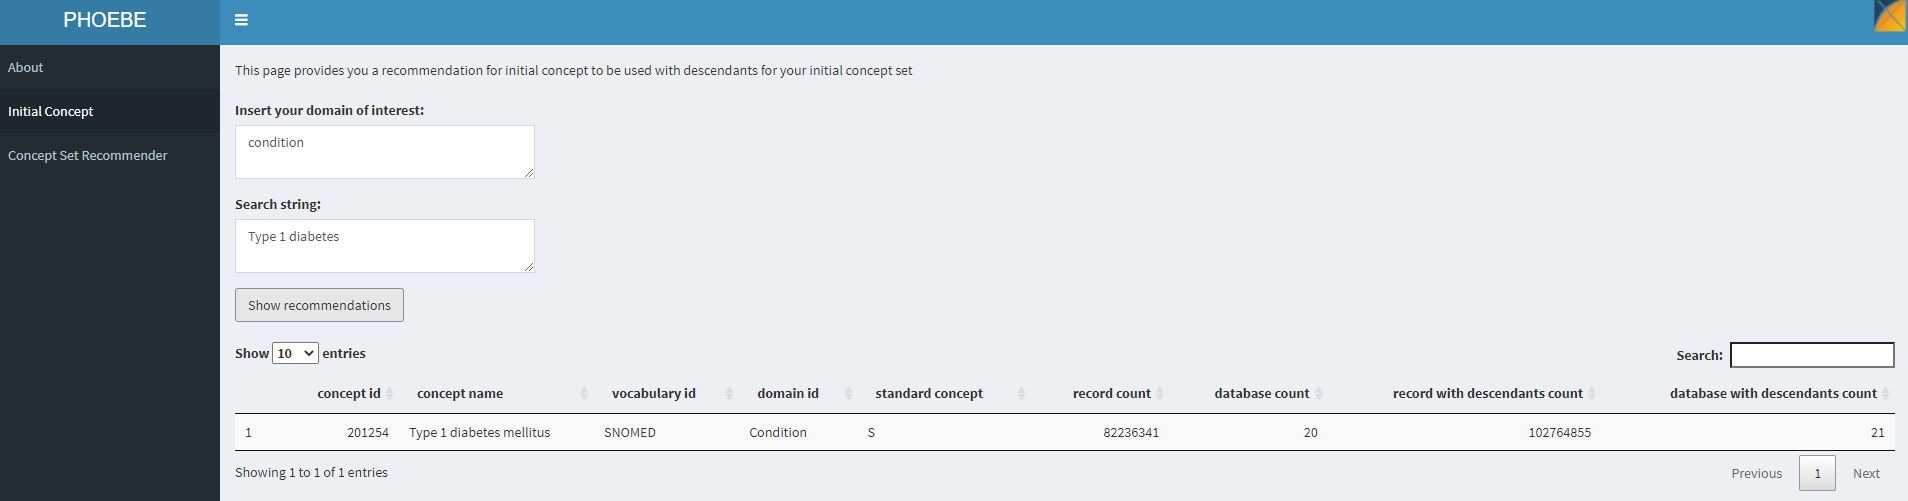
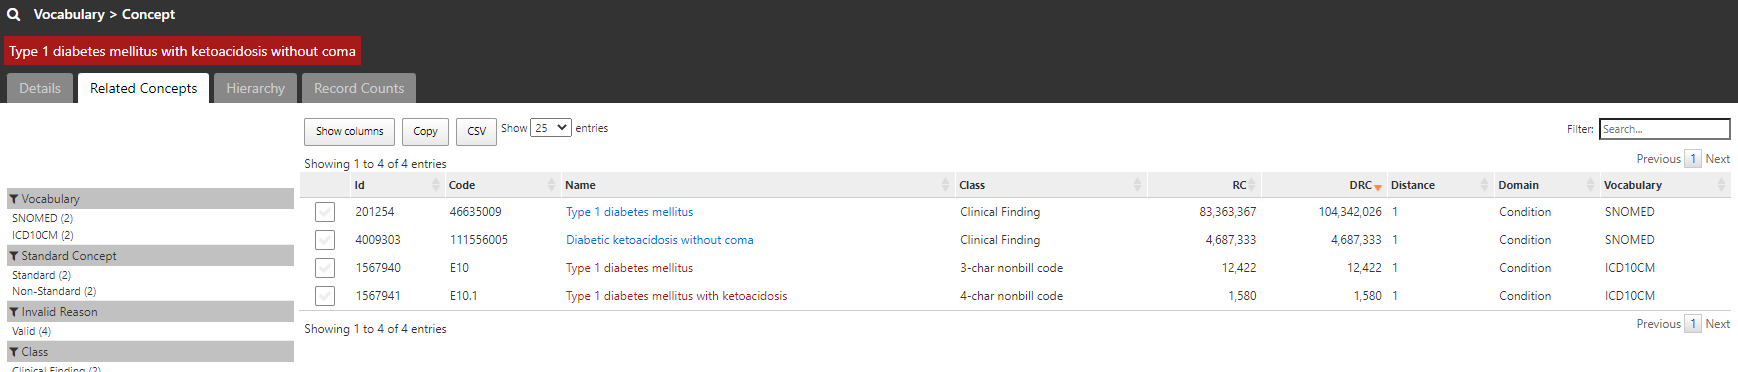
As a starting point, providing the string ‘type 1 diabetes’ found us a starter concept of ‘Type 1 diabetes mellitus’, and we can see that this concept has 82m records, was directly observed in 20 different databases, and using this concept plus its descendants would yield >102m records across 21 databases. Sounds like a great place to start
If we move to the second function in PHOEBE, we can see what is recommended to us if we use only that starter concept:
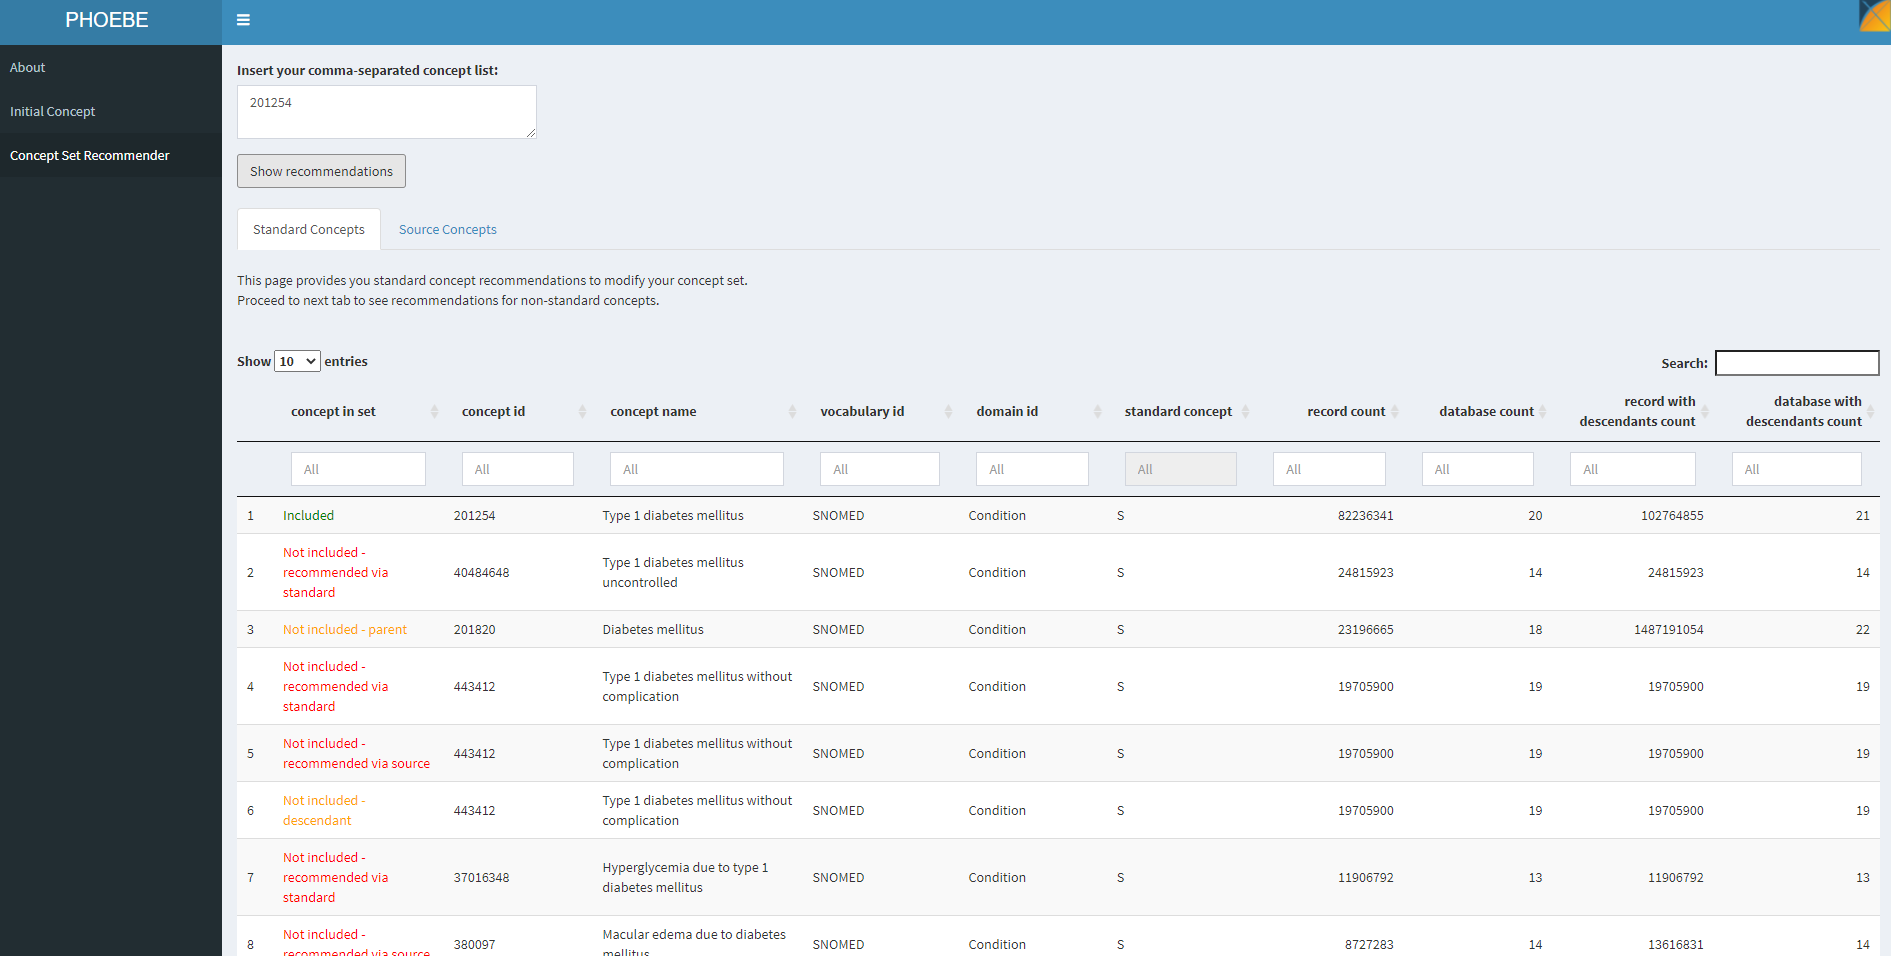
PHOEBE suggests that this concept alone isn’t sufficient. It identified concepts that are not included but recommended because of lexical similarity to the standard concept name or source code name (ex: ‘Type 1 diabetes mellitus uncontrolled’), not included but recommended because they are descendants of a concept in your list (ex: ‘Type 1 diabetes mellitus without complication’), not included but recommended because they are parents of a concept in your list (ex: ‘Diabetes mellitus’). I review this list of recommendations to see what I missed, and iteratively add those concepts to my conceptset until I do not find any additional recommendations useful for my clinical idea of interest.
Cohort evaluations:
I’ll again use CohortDiagnostics to evaluate these two definitions. The results are publicly available at: https://data.ohdsi.org/phenotypePhebruary/
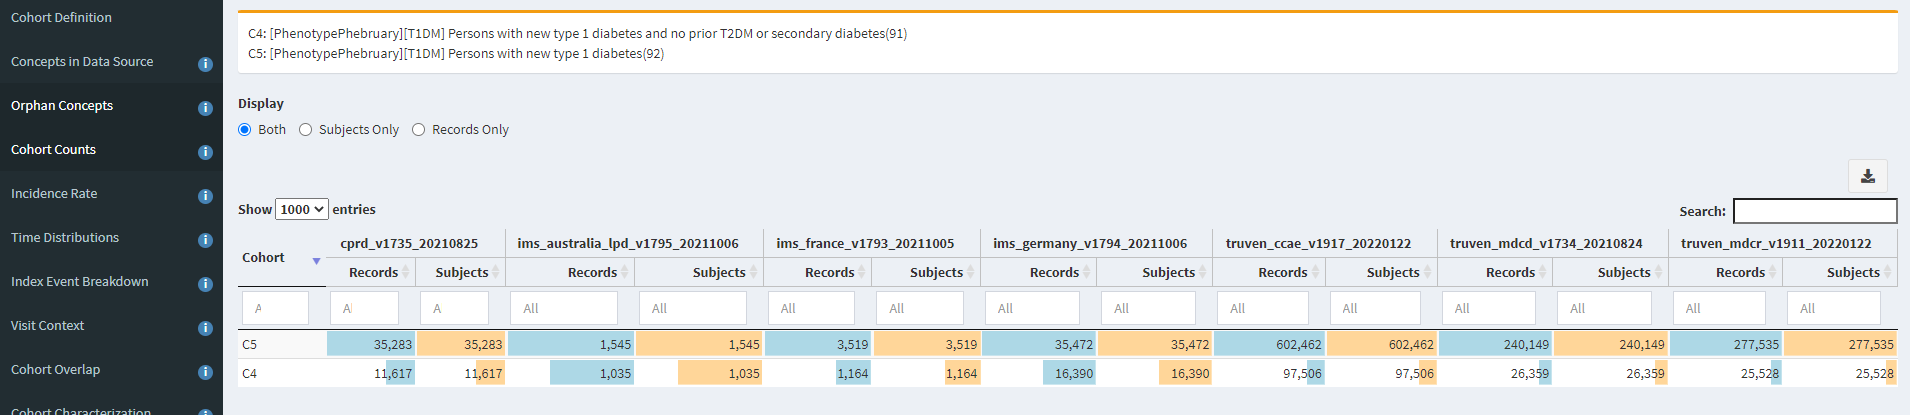
When we look at the Concept Counts, we can see that the additional inclusion criteria, restricting prior T2DM or secondary diabetes codes has a substantial impact on the number of qualifying persons in each cohort. In CCAE/MDCD/MDCR, we see >80% of patients were lost, while in CPRD and Iqvia France attrition was ~66%, in Iqvia Germany it was >50%, and in Iqvia Australia, it was >30%.
Now, let’s look at the Incidence Rate analysis:
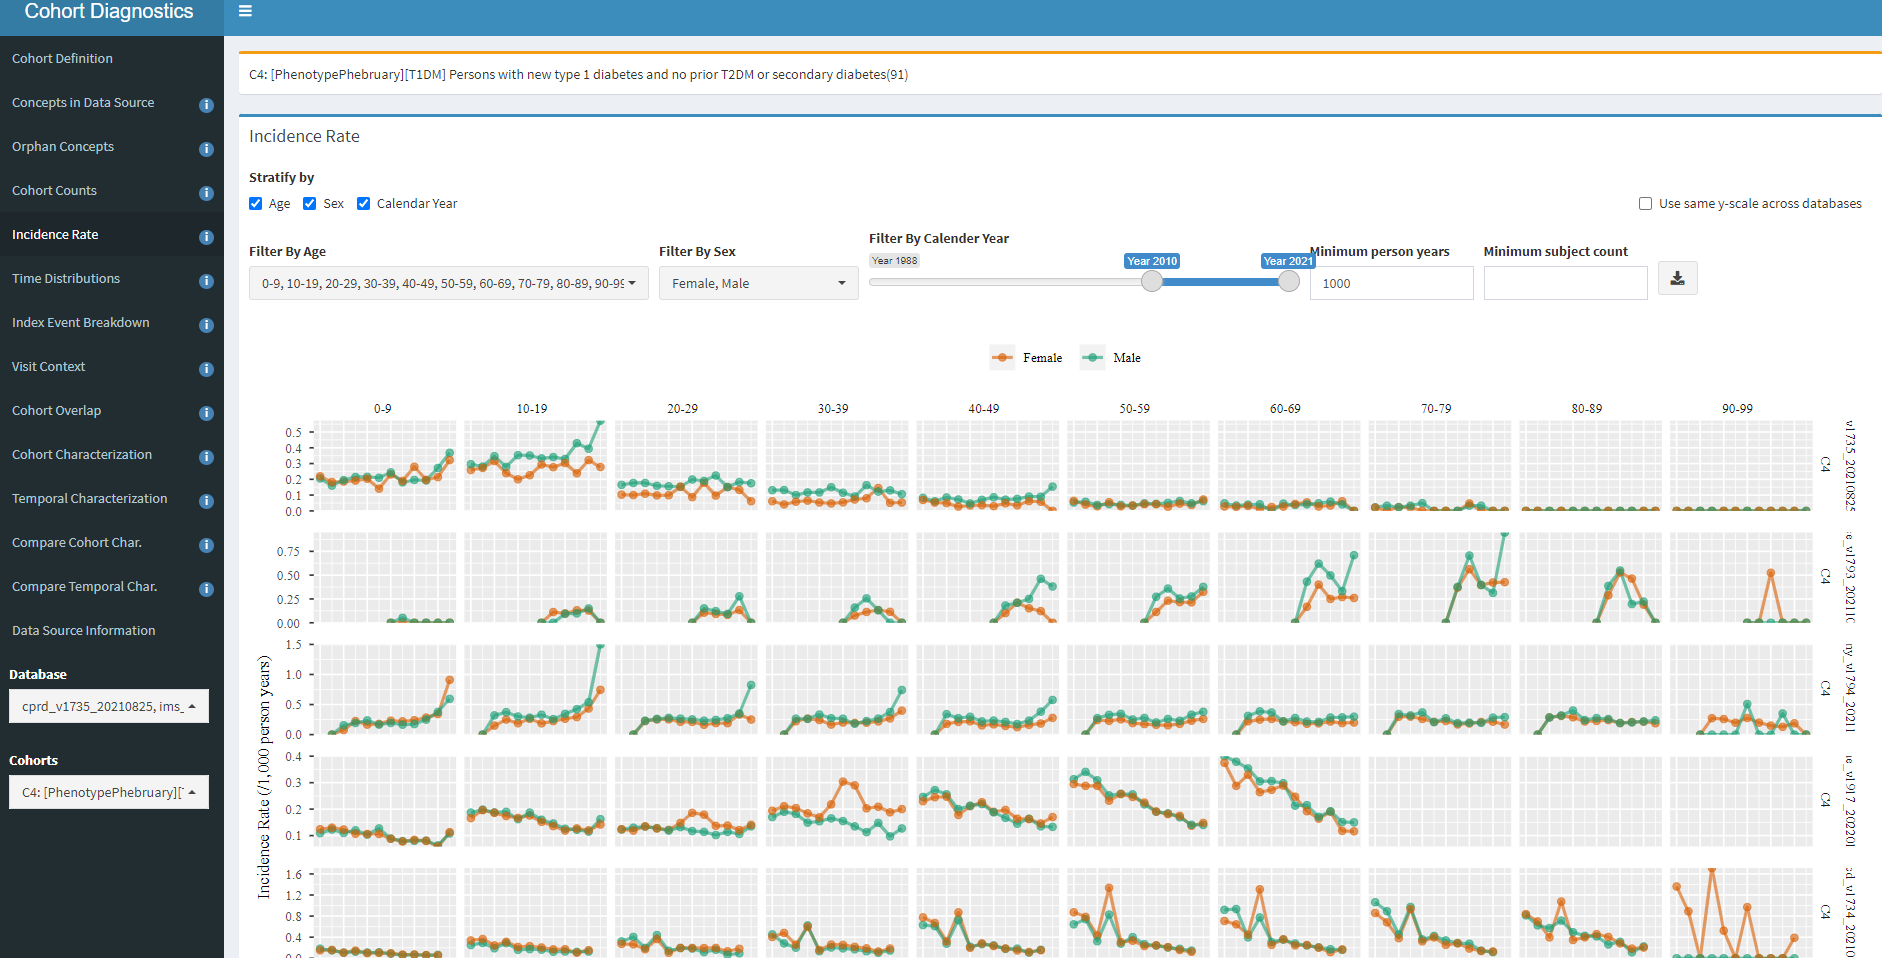
Here is where we should start getting worried, at least for some databases. In the first row, we see CPRD, and we see that the incidence is highest in the 0-9 and 10-19 age groups, with a higher incidence in males vs females, so that seems plausible with what we read from ADA. But the second row is Iqvia France, the third row is Iqvia Germany, the fourth is CCAE, and in these cases, you see the ‘incidence’ is relatively constant across age groups, that defies what we expect.
Let’s think about what could cause this? A couple possibilities: 1) perhaps these are persons with an initial misdiagnosis of T1DM followed by T2DM diagnosis and management. 2) Maybe we have misspecification of ‘incidence’ because a 365d prior observation period requirement is too short (since T1DM onset could have been much earlier in a person’s life and may not be re-coded recently), so we are really looking at prevalence cases with index date misspecification.
One of the features of CohortDiagnostics that I didn’t showcase yesterday, but comes in handy in this circumstance is Cohort Overlap. When you have two cohorts and wonder if persons belong to one group or the other or both, this analysis provides useful insight. Recalling back to the ADA description, it is common for misdiagnosis between T1DM and T2DM. So, overlap can help us understand the extent to which qualifying patients in each of the broad cohorts intersect:
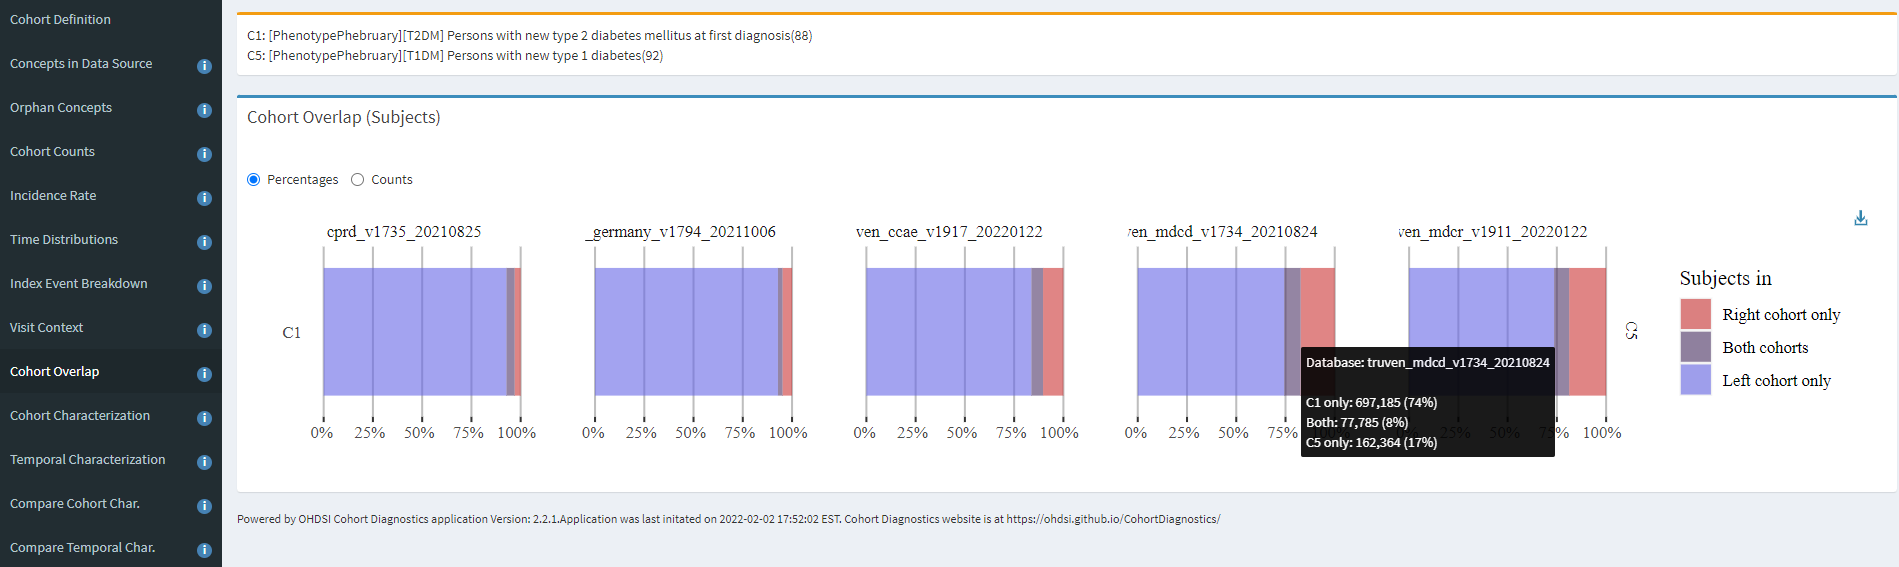
Here, we see that across the 5 databases shown, from UK, Germany, and three US databases, that the majority of persons are T2DM only (blue), and some persons are T1DM only (red), but all databases have a reasonable fraction of persons belonging to both (purple). The hoverover on MDCD specifically shows that 74% were T2DM only, 17% were T1DM only, and 8% were in both T2DM and T1DM cohorts. This is useful information, because if you recall, our alternative definitions impose inclusion criteria to remove patients with prior T1DM amongst the T2DM definition, and prior T2DM amongst the T1DM definition, and that means these patients with both diagnoses are not represented in either definition. So some diagnosis mixture definitely exists, but not enough to explain the incidence patterns above.
So, let’s turn to Temporal Characterizations to see if we can find any insights of specificity errors or index date misspecification. I’ll start by looking at diabetes-related conditions occurring in our C4 cohort:
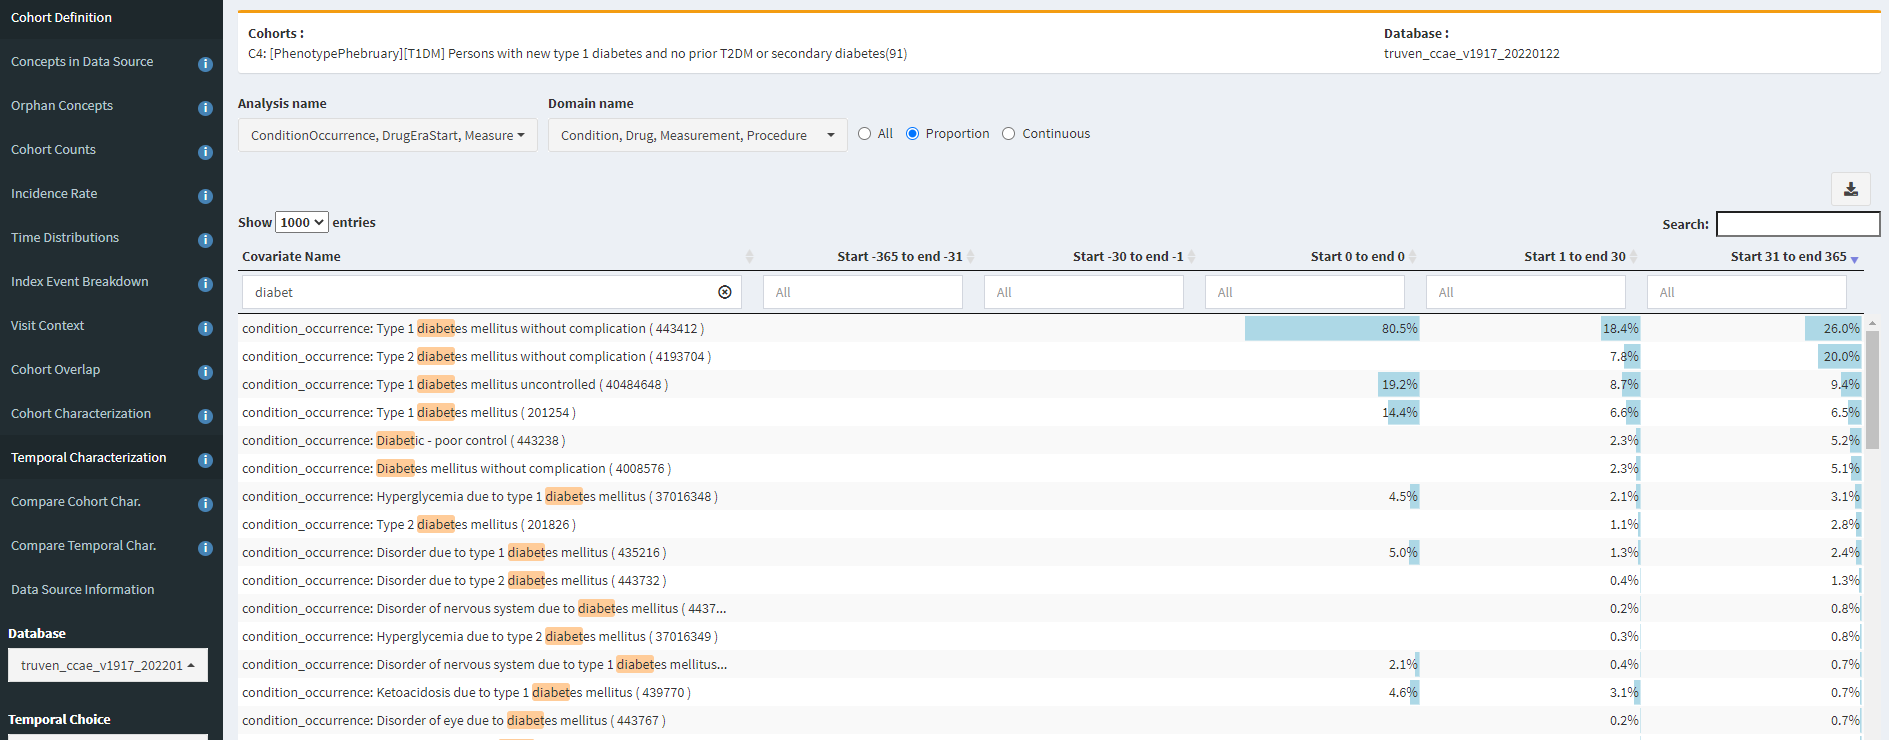
Yikes! In CCAE, 7.8% of our T1DM cohort gets a ‘Type 2 diabetes mellitus without complication’ diagnosis within a month of the T1DM diagnosis, and 20% have this code within the year. Another 5% have a ‘Diabetic-poor control’ or ‘Diabetes mellitus without complication’ concept (which are not T1DM specificity). So, this is some evidence that maybe all our T1DM patients aren’t actually T1DM.
Let’s look at insulin use; after all, if they are real T1DM patients, many should all have insulin therapy after diagnosis.
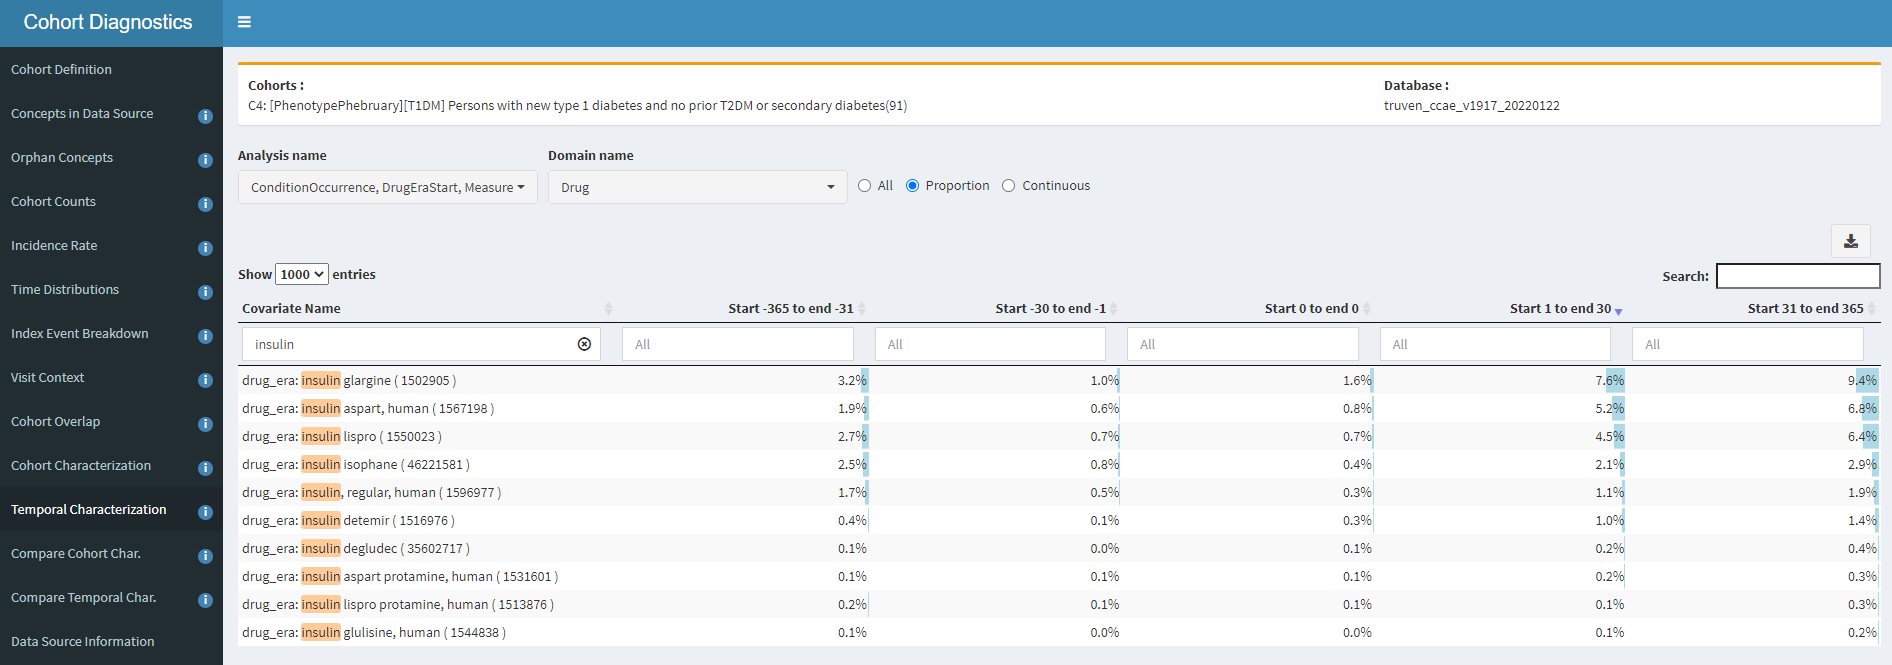
Yikes #2! If most T1DM patients should have insulin, then why do we see in CCAE that <10% of any insulin product is observed in a year? Even if I ignore double-counting and added up these percentages, its <50%. In fact, the prevalence of metformin (recommended first-line treatment for T2DM) is in-line with insulin glargine. So, either our dataset is missing insulin exposure (in CCAE, probably unlikely, since it’ll be handled well from retail pharmacy as prescription dispensing covered by private insurance) or these persons aren’t on insulin because they don’t have T1DM. Either way, I wouldn’t be comfortable using this definition in the US claims data without further evaluation.
To contrast this, CPRD has a incidence trend that made more sense, so what does the insulin exposure pattern look like there?
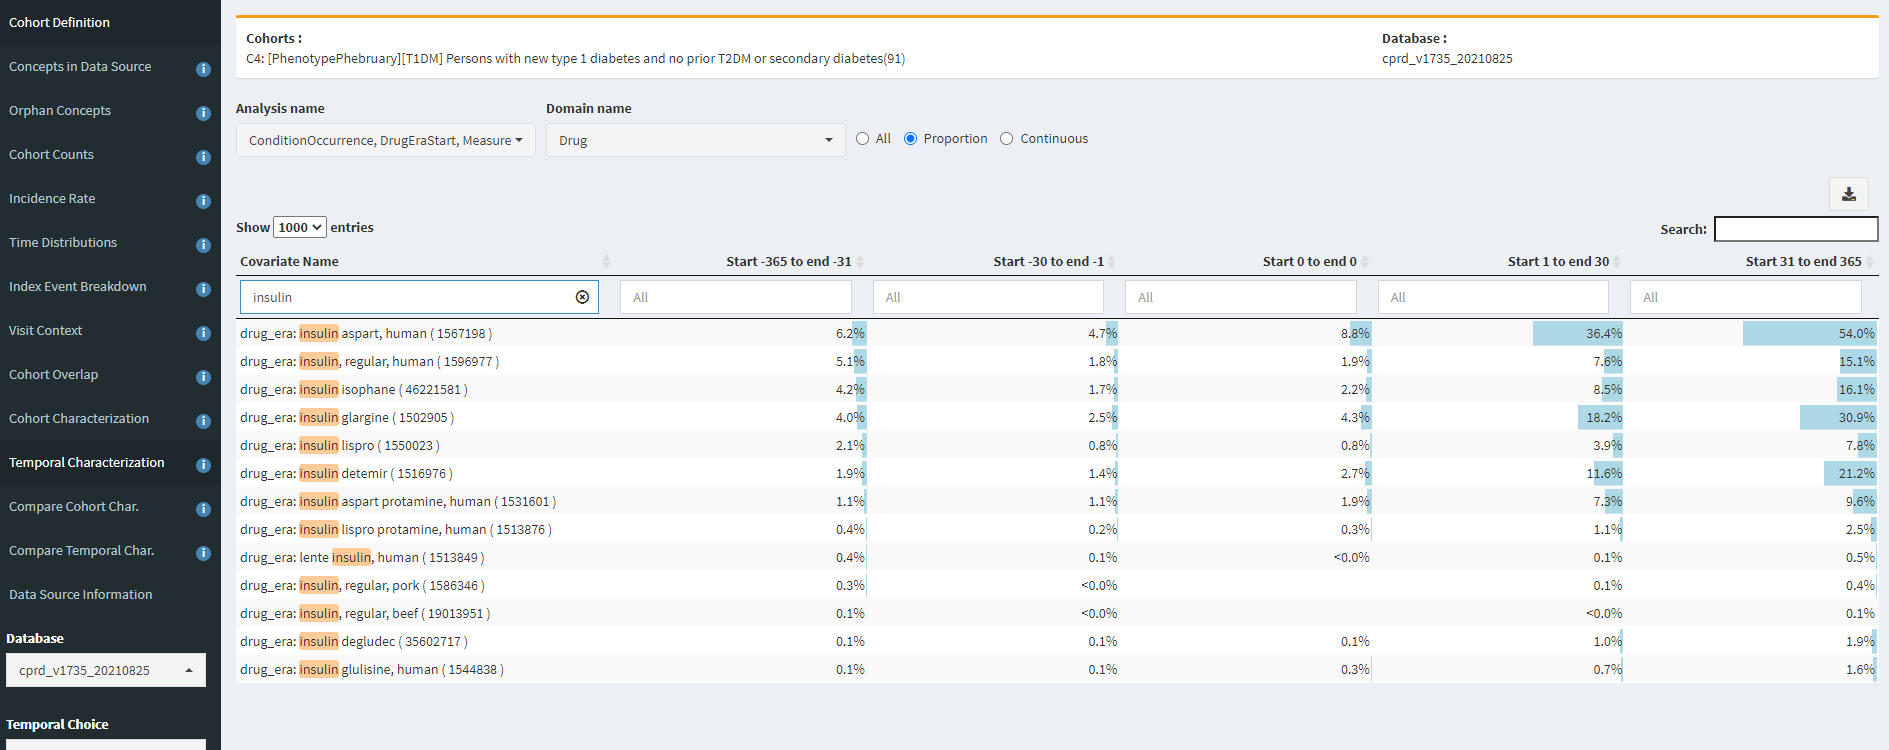
Well, that looks much better! We’re seeing >50% with an exposure to ‘insulin aspart, human’, with considerable exposure to other insulin products. This gives me much greater confidence that our T1DM diagnosis codes can find T1DM patients in our UK EHR. However, before I get too excited, this same table also shows me that our phenotype may not be done yet. Notice that there’s ~5% of persons with insulin exposure of a few products in the year PRIOR to the T1DM index date. That’s screaming of index date misspecification. We might want our cohort to look for the earliest of a T1DM diagnosis OR insulin treatment, with an inclusion criteria requiring T1DM diagnosis on or within some interval after the entry event (similar to the extra variant we built for T2DM that looked at drug use and measurement values).
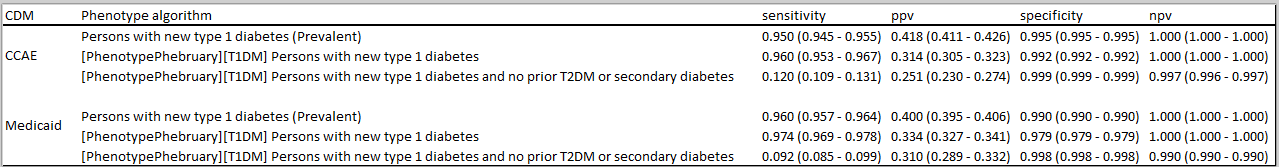
What have other people found when trying to phenotype T1DM? There was a nice paper in BMC last year that attempted to develop and evaluate alternative algorithms in Japan claims data. The authors cite emulating PheValuator (an OHDSI tool developed by @jswerdel that will likely be a subject of a future Phenotype Phebruary post) in addition to doing chart abstraction, and they found in their data that a diagnosis code alone had low sensitivity and poor positive predictive value. They were able to increase PPV by imposing additional requirements, but that comes with further risk of decreased sensitivity. Their bottom line conclusion, "As a result of the performance evaluation of the case definitions for T1D, it was suggested that the ICD10 code of T1D should not be used for assessing the true patients with T1D. "
So, this is a nice problem for our community to chew on some more. What would be your next step to develop alternative definitions that may overcome the issues we’ve identified?