OHDSI Home | Forums | Wiki | Github

Phenotype Phebruary Day 1 – Type 2 diabetes mellitus

Today, we’ll be using OHDSI tools to develop and evaluate cohort definitions for the phenotype target of Type 2 diabetes mellitus (T2DM).

Clinical description:

The American Diabetes Association (ADA) “Standards of Medical Care in Diabetes” is a tremendous resource to learn more about diabetes for those interested. It classifies diabetes into "the following general categories:

  1. Type 1 diabetes (due to autoimmuneb-cell destruction, usually leading to absolute insulin deficiency, including latent autoimmune diabetes of adulthood)
  2. Type 2 diabetes (due to a progressive loss of adequate b-cell insulin secretion frequently on the background of insulin resistance)
  3. Specific types of diabetes due to other causes, e.g.,monogenic diabetes syndromes (such as neonatal diabetes and maturity-onset diabetes of the young), diseases of the exocrine pancreas (such as cystic fibrosis and pancreatitis), and drug- or chemical-induced diabetes (such as with glucocorticoid use, in the treatment of HIV/AIDS, or after organ transplantation)
  4. Gestational diabetes mellitus (diabetes diagnosed in the second or third trimester of pregnancy that was not clearly overt diabetes prior to gestation)"

It provides objective diagnostic criteria based on readily-accessible laboratory measures used in routine practice. “Diabetes can be diagnosed based on plasma glucose criteria, either the fasting plasma glucose (FPG) value or the 2-h plasma glucose (2-h PG) value during a 75-g oral glucose tolerance test (OGTT), or A1C criteria”

The epidemiology and disease natural history of T2DM has been extensively characterized in the literature. Common symptoms of T2DM onset include thirst, frequent urination, weight loss. Common ‘risk factors’ include age, obesity, hypertension and hyperlipidemia. Management of T2DM can include lifestyle modifications, including diet and exercise, as well as pharmacologic treatment (with notable drugs including metformin, Sulfonylureas, Sodium Glucose Co-Transporter 2 (SGLT2) inhibitors, Glucagon-like Peptide-1 Receptor Agonists (GLP1RA), Dipeptidyl peptidase-4 inhibitor (DPP4i), Thiazolidinediones, and insulin). Long-term complications associated ofT2DM can include cardiovascular events (ischemic heart disease, stroke), diabetic retinopathy, kidney failure, and amputation. The incidence of T2DM has been increasing over time. Current prevalence estimates of ~6% in the general population, but vary considerably across countries around the world.

Cohort definitions to evaluate

In this exercise, I created 3 definitions to review:

  1. “Persons with new type 2 diabetes mellitus at first diagnosis” (ATLAS-phenotype link here).

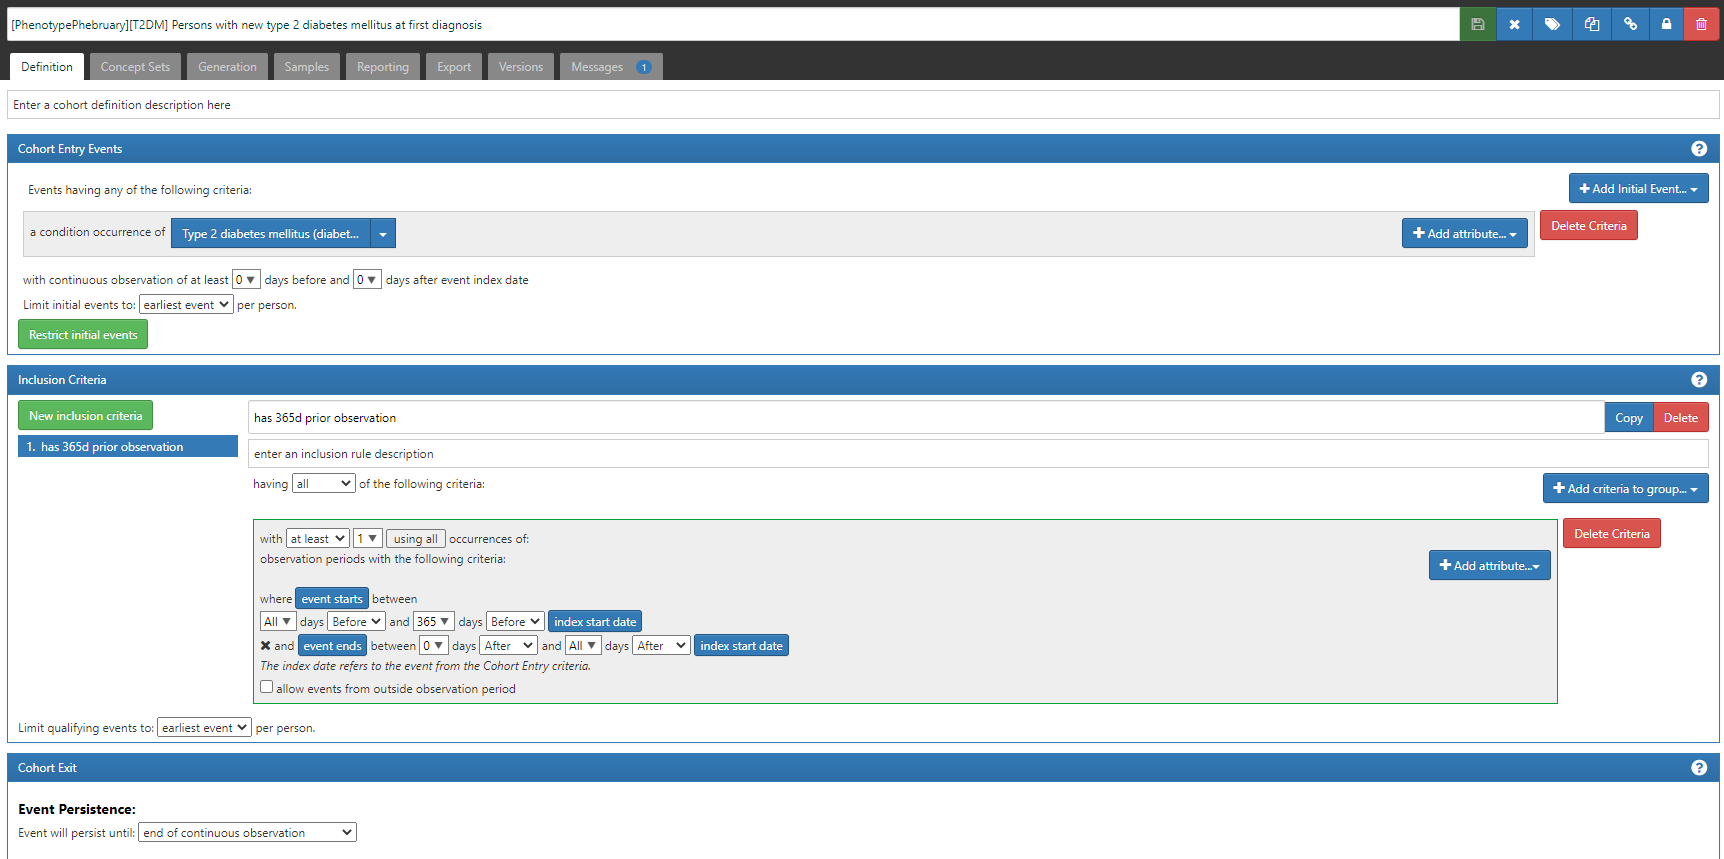
This is a ‘simple’ approach to a phenotype definition, as we commonly see in many observational database studies of T2DM. Namely, we define a person’s status based only on a diagnosis code, as found in the CONDITION_OCCURRENCE table. To find ‘new’ cases of T2DM, we apply two logical devices: 1) we limit the cohort entry events to ‘earliest event’ per person, and 2) we add an inclusion criteria requiring at least 365 days of prior observation (by requiring that the entry event occurs within an observation period whose observation period start is more than 365d before the entry event start and end is sometime afterwards). {Side note, we could have applied the observation period restriction within the entry event criteria, but we would have needed to also specify that the condition occurrence was ‘first time in history’. Implementing it as shown here has the added benefit that the attrition table shows you how many patients were ‘lost’ by imposing the 365d prior observation requirement, which effectively tells you how many ‘prevalent’ T2DM patients the database had who wouldn’t qualify as ‘incident’ cases}

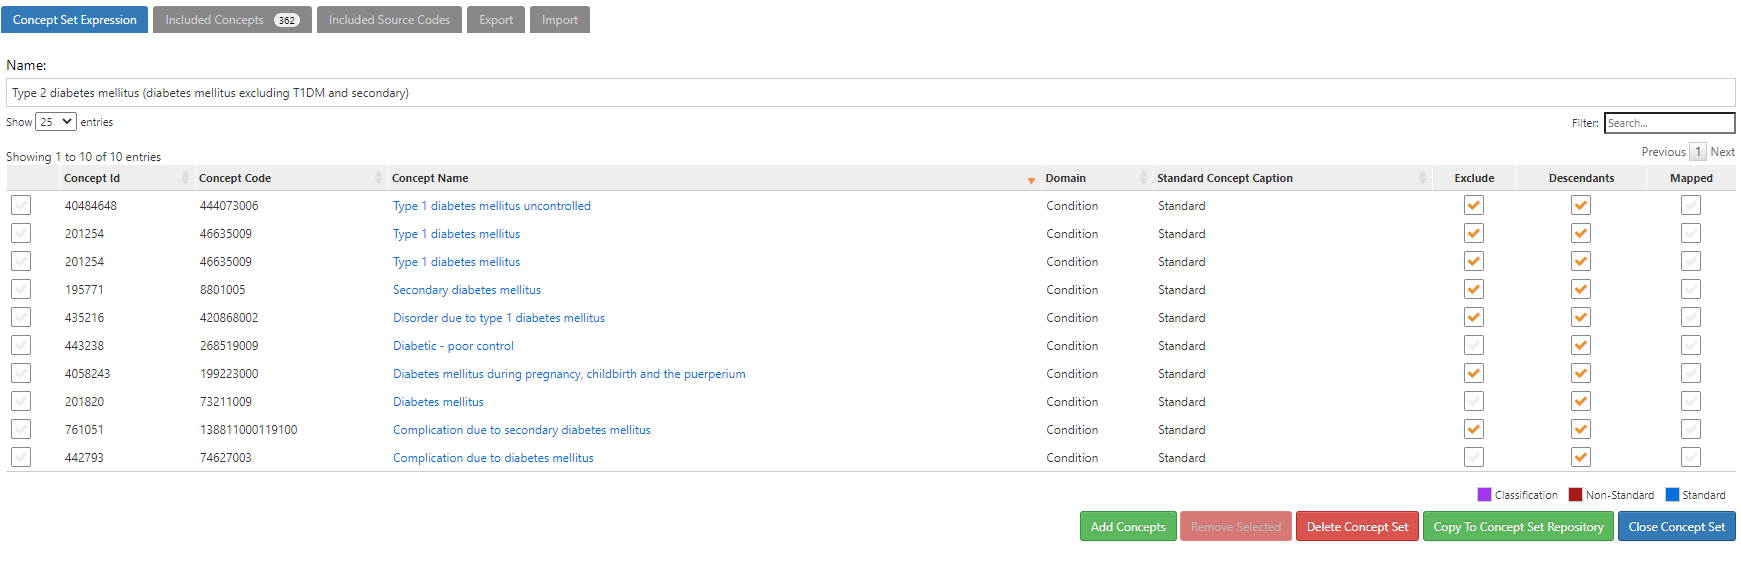
Here, we have to define a conceptset expression to represent the clinical idea of ‘Type 2 diabetes mellitus’. And specifically, as it shows in the name, we’ve done this by identifying ‘diabetes mellitus excluding T1DM and secondary’. An insight here is that there are many standard concepts and source codes that do not distinguish the specific classification of ‘diabetes mellitus’, so we need to decide whether to include or exclude them in our T2DM definition. Notable examples of non-specific standard concepts that are highly prevalent in our OHDSI network include ‘Diabetes mellitus’, ‘Complication due to diabetes mellitus’ and ‘Diabetic-poor control’. Note also that you can’t solely rely on the SNOMED hierarchy to drag in all diabetes-related concepts. Indeed, ‘Diabetes mellitus’, ‘Complications due to diabetes mellitus’ and ‘Diabetic-poor control’ are not part of the same ancestry, in that none are descendants of each other. This conceptset uses these three concepts, plus their descendants, and then excludes concepts underneath of them which we don’t want, like ‘Type 1 diabetes mellitus’, ‘Disorder due to Type 1 diabetes mellitus’ and ‘Secondary diabetes mellitus’ (note, this roughly conforms to the ADA classification above). Finally, I’ll highlight that this succinct conceptset expression, with its 10 concepts, 3 with descendants, and 7 with excluded descendants, that conceptset resolves into an included concept list of 362 standard concepts, that vast majority of which have been observable in at least one database within the OHDSI network. And that 362 standard concepts have 2,177 mapped source codes, including 70 ICD9CM codes, 42 ICD10 codes, 481 ICD10CM codes, 271 Read codes. Imagine having to find all 362 concepts and 2,177 source codes yourself through some primitive string search…good luck! Thank you OHDSI vocabulary team and the ATLAS development team for making our lives so much easier!

  1. “Persons with new type 2 diabetes and no prior T1DM or secondary diagnosis” (ATLAS-phenotype link here)

Note, the difference between #1 and #2 is the addition of two new inclusion criteria: ‘no Type 1 diabetes mellitus on or prior to T2DM’ and ‘no secondary diabetes diagnosis on or prior to T2DM’. Each of these inclusion criteria required their own conceptsets to represent T1DM and secondary diabetes, respectively. The logic for using those concepts is to require that exactly 0 condition occurrence records are observed all time prior through the index date, including for events that fall outside the observation period. Even though it has more criteria, this definition relies only on the CONDITION_OCCURRENCE table to identify patients and determine cohort start dates.

This definition is most akin to logic we have currently proposed to use with the LEGEND-T2DM study (protocol is here). The difference there is that we have modeled new user drug cohorts, and the requirement of the indication is represented as inclusion criteria.

  1. “Persons with new type 2 diabetes mellitus at first dx rx or lab” (ATLAS-phenotype link here)

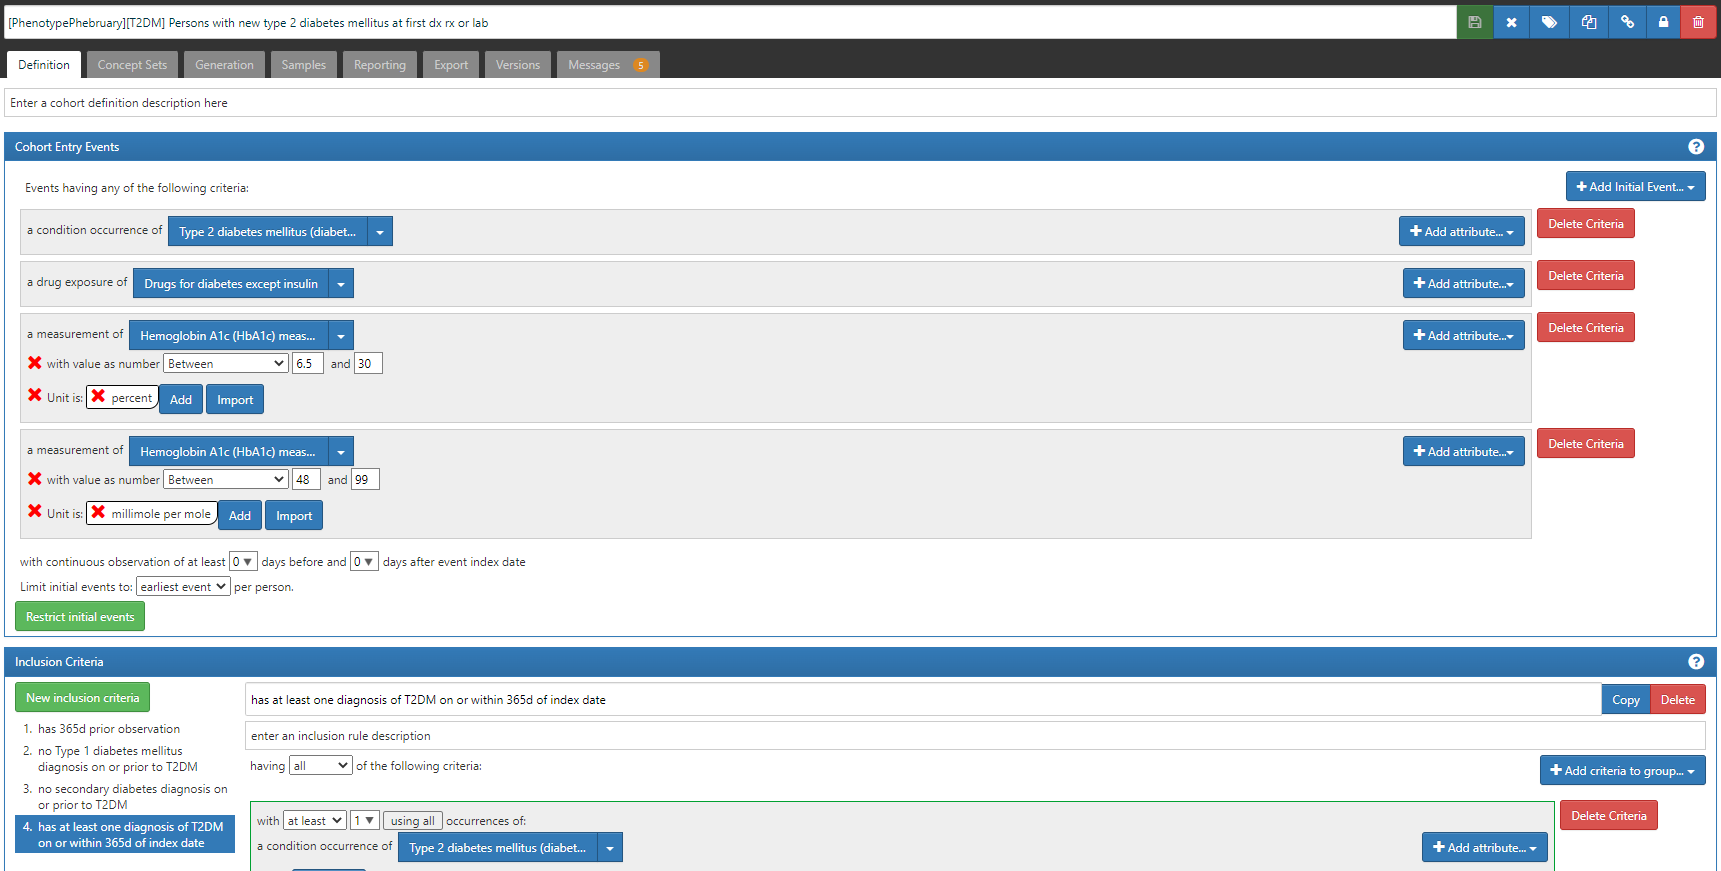
This definition uses conditions, drugs, and measurement values to identify the ‘earliest’ entry event, and then adds an inclusion criteria that all persons must have a diagnosis of T2DM on or within the 365d after the index date.

First, note the cohort entry events had 4 components: 1) condition occurrence of ‘Type 2 diabetes mellitus’ (same as in other two definitions), 2) drug exposure of ‘drugs for diabetes except insulin’, 3) measurement of ‘Hemoglobin A1C’ with a value > 6.5 and unit of ‘percent’,or 4) measurement of ‘Hemoglobin A1C’ with a value > 48 and unit of ‘millimole per mole’.

A couple ‘lessons learned the hard way’ to point out here. 1) I specified the value as a range (e.g. for %, it’s ‘between 6.5 and 30’, and this is because we had seen some database have data quality issues with measurement values that could get swept in if not bounded (ex: if a database had values with omitted decimal points, then 60 instead of 6.0 would be greater than 6.5, but not what we want). 2) you have to specify units for measurements, unless you know that all databases are uniform or the measurement can’t have alternative units or is truly unitless. This will have the consequence that some databases that have values but no units will not be able to apply this criteria, but the alternative is far worse: assuming the values follow some distribution when you could be on the completely wrong scale (in this case, confusing % with mmol/mol). 3) if you want to still require the diagnosis code, you can include it in the entry event AND in an inclusion criteria. This way, a person can qualify if EITHER their first entry event is a diagnosis OR their first entry event is a drug or measurement but then later they have a diagnosis. This trick comes in handy when we are trying to correct for index date misspecification that can arise when we only use diagnosis codes (more on that later).

So, without looking at data, we can think about the logic of these three definitions to understand how they should play out. #1 is the superset, with #2 being a subset of #1 that meets 2 additional criteria, and #3 being the same people as #2, except that some persons may be excluded because the index date correction may eliminate some prevalent cases that were captured as ‘incident’ in #2. Note, definition #3, while it is using drugs and measurements also, because it requires a diagnosis, it shouldn’t be a broader definition. (A reasonable alternative one could consider to evaluate is what if one didn’t impose a requirement of a diagnosis, relying ONLY on drug exposures OR measurement values).

Phenotype evaluation using CohortDiagnostics

We used CohortDiagnostics to evaluate these cohorts. The results are available for your review at: https://data.ohdsi.org/phenotypePhebruary/

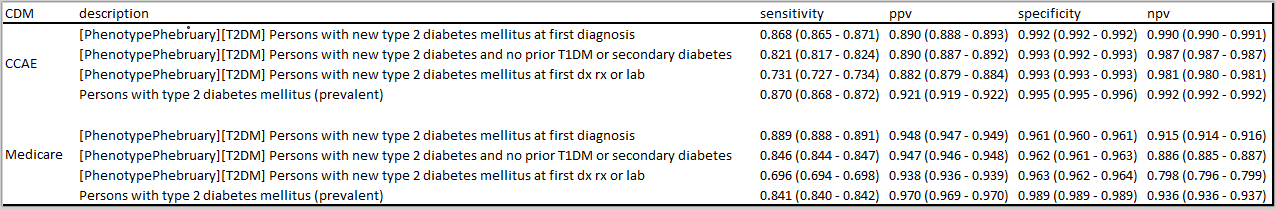
The three cohort definitions described above were applied to six databases in this initial evaluation: 3 US administrative claims datasets : IBM MarketScan Commercial Claims and Encounters (CCAE), IBM MarketScan Multi-state Medicaid (MDCD), and IBM MarketScan Medicare Supplemental Beneficiaries (MDCR); the Iqvia Disease Analyzer - Germany; Iqvia Disease Analyzer - France; and Iqvia LPD - Australia. The cohort counts for all definitions against all databases is shown below.

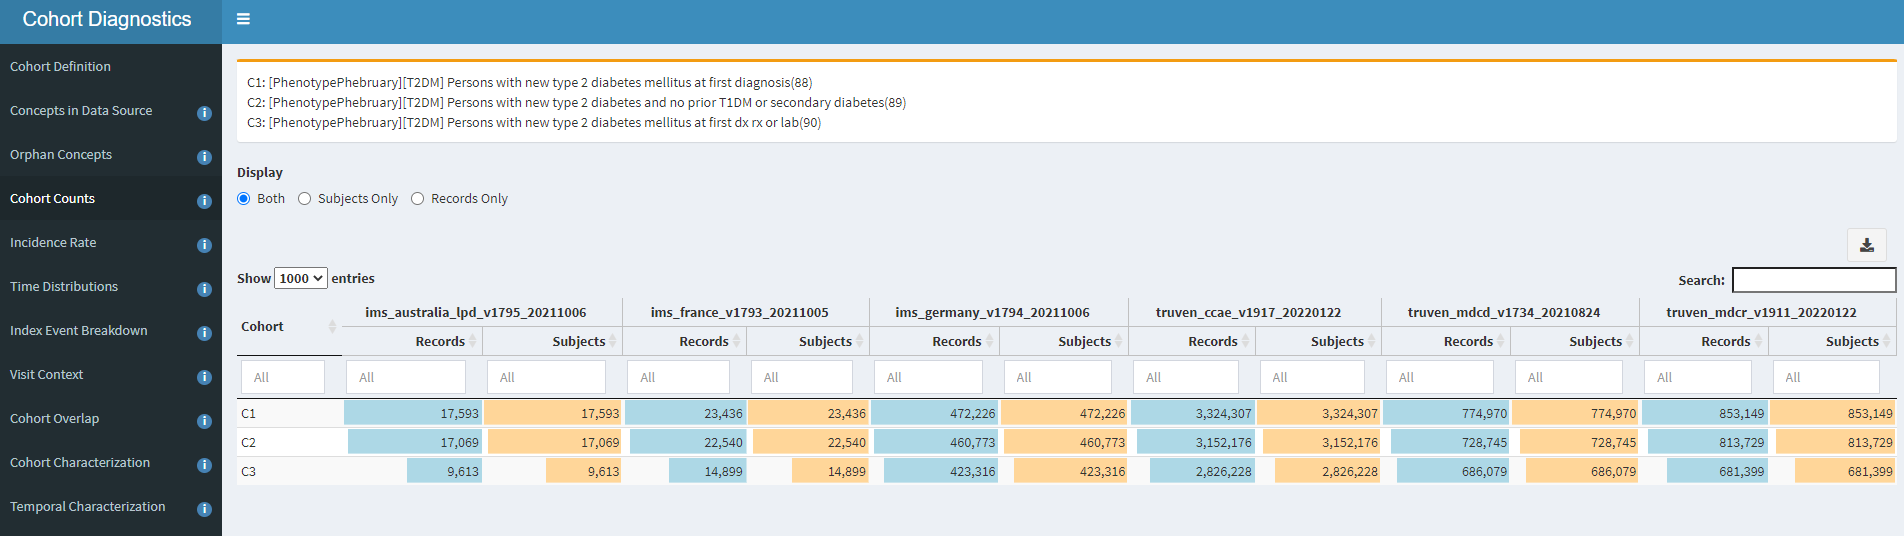
One of the first observations that you can note from this: Imposing the additional inclusion criteria of ‘no T1DM or secondary diabetes’ in definition C2 had a very small impact on the cohort count, as compared to the original C1 definition. For example, in CCAE, we dropped from 3.32m patients to 3.15m patients (~5% loss). This is directionally aligned with the ADA statement that ~90% of all diabetes cases are T2DM. What was a bit more surprising to me was that we see an additional ~10% drop from C2 to C3 (the definition where we allow entry events based on diagnoses, drugs or measurements). This suggests that many ‘qualifying incident’ patients in C2 may have actually been prevalent T2DM patients, insofaras they had prior diabetes drug use OR elevated HbA1c before their diagnosis (and within the 365d observation period). This is our first clue that there may be some index date misspecification when using T2DM diagnoses to find new cases.

Using the Incidence Rate tab, we can see interesting patterns by age, sex, and index year.


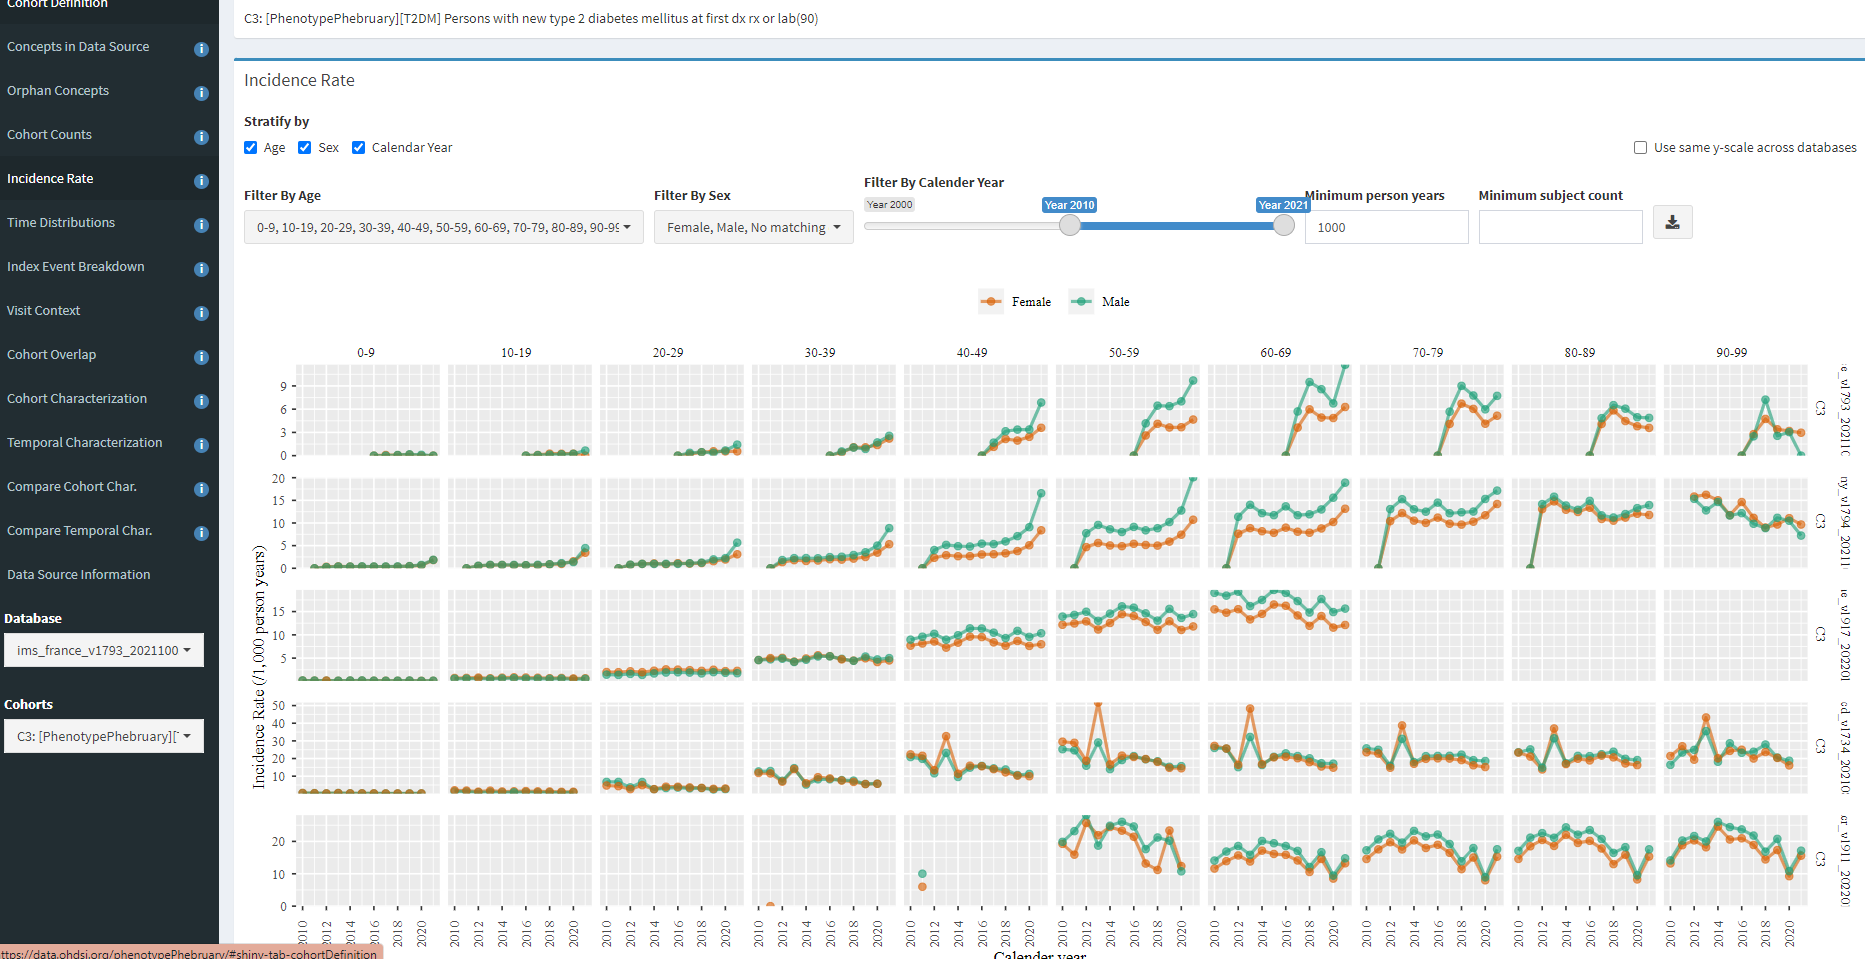
In line with the ADA description, we can see that T2DM incidence increases with age with particular growth from 30 to 40 to 50. We also see, across all 5 databases shown here, the incidence is higher in men (as it expected, both on its own, and due to association with other risk factors, like obesity and hypertension). When we look over index year, we see some interesting patterns. The most notable one for me is MDCD, where there is a clear pronounced spike in incidence in 2013, across all age/sex strata, and this spike is not observed in any other database. While I do not know for sure, I suspect this has to do with states rolling out the Medicaid Incentives for Prevention of Chronic Diseases (MIPCD) in 2013.

The Index Event Breakdown tab allows you to understand which concept was observed on the index date (that is, what concept was truly the ‘entry event’). I find it useful to look at the C1 definition (based on diagnosis only):


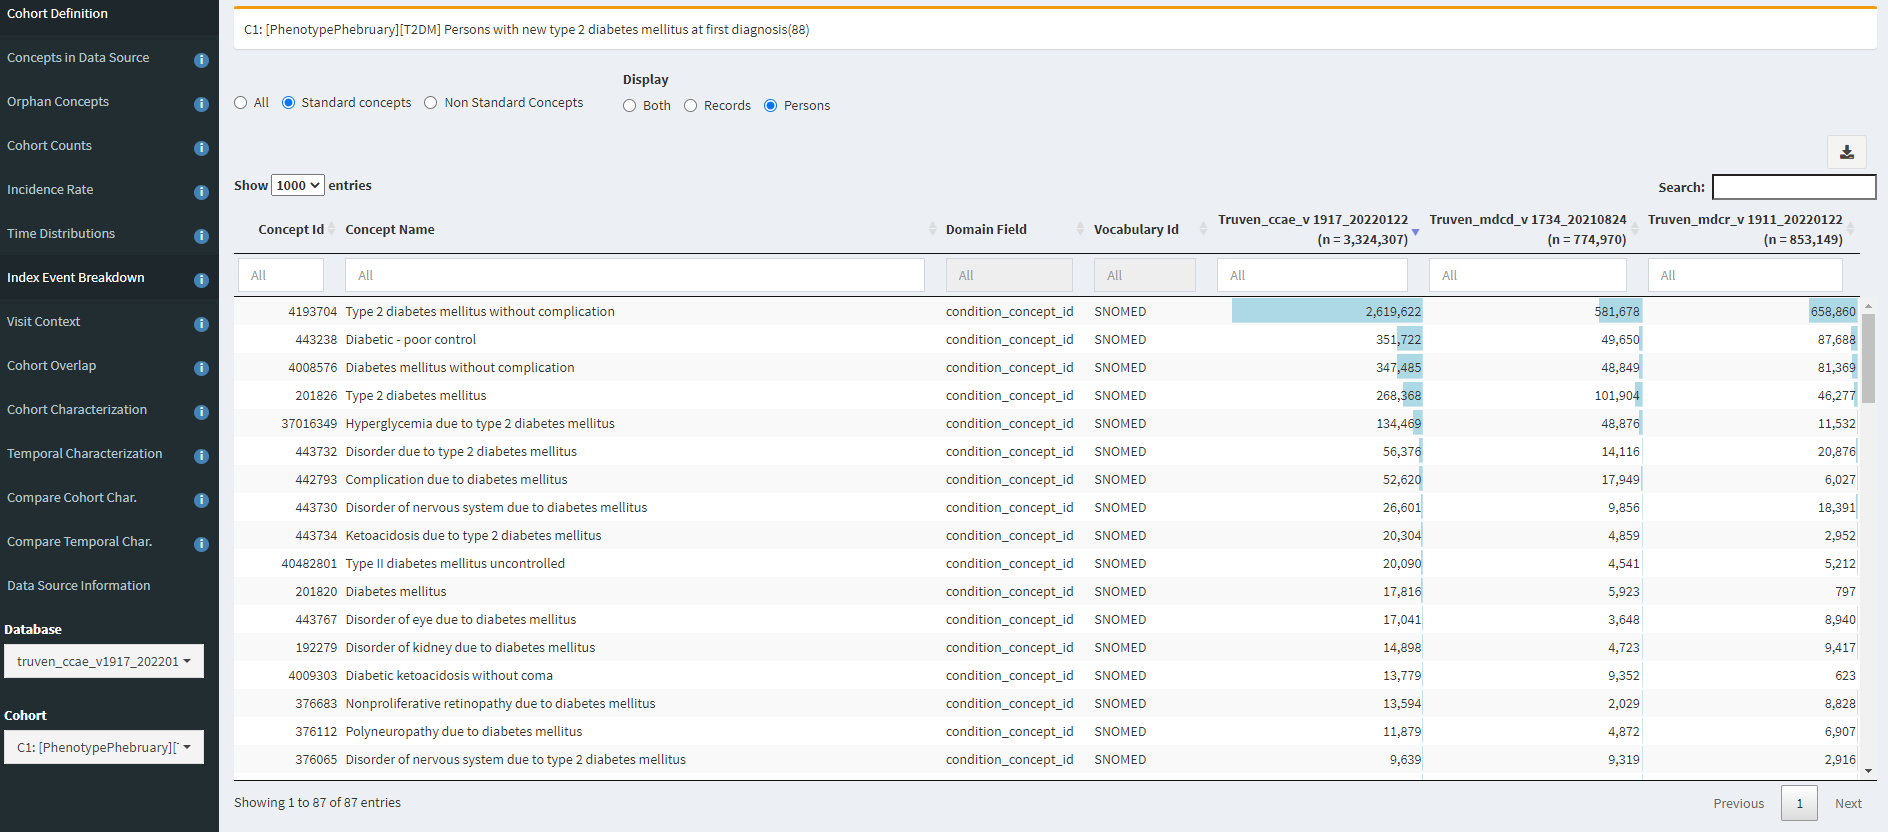
Here, we can see that the main qualifying concept in CCAE and MDCD is ‘Type 2 diabetes mellitus without complication’. However, its interesting to see that other concepts in the top 10 include ‘diabetic-poor control’ (that concept that we might miss if only using the SNOMED hierarchy or a string search for diabetes), ‘Complication due to diabetes mellitus’ (non-specific to T2DM) and various specfic complications that one might have imagined would follow the initial onset of T2DM (such as ‘disorder of eye’, ‘disorder of kidney’, ‘polyneuropathy’).

Now, juxtapose that against C3, where we index on earliest of diagnosis, drug or measurement:

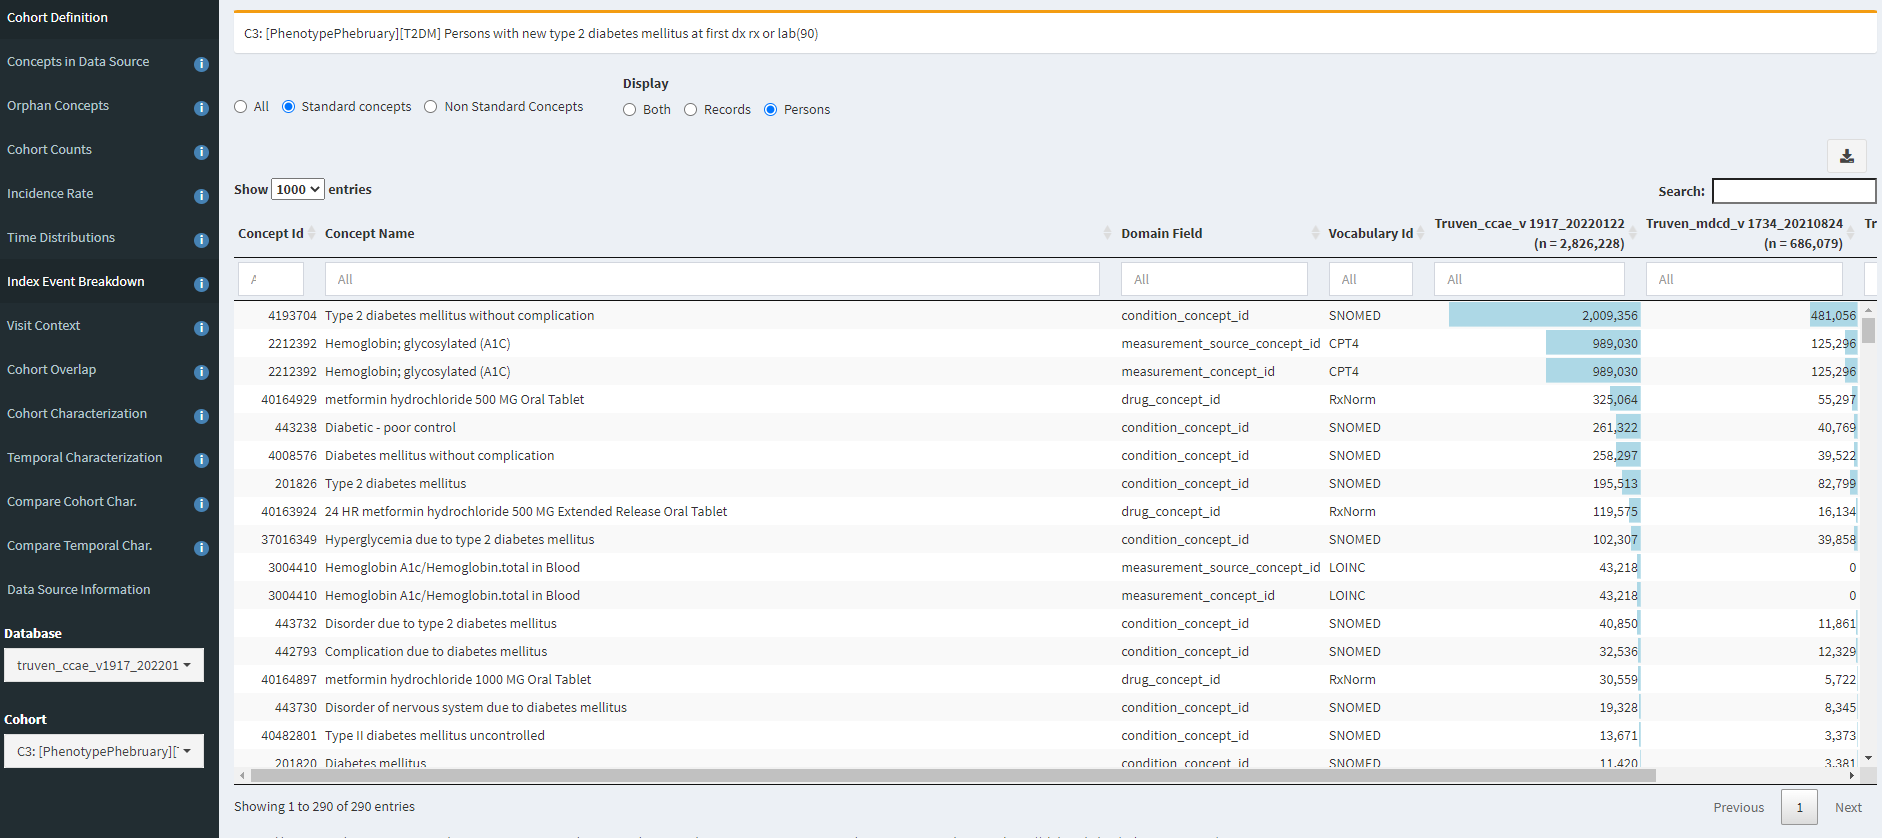
Here, we see that HbA1c and metformin exposure are near the top of the list of entry events. And specific complications are now further down the list and less prevalent (but still do occur as the first observed event).

The Temporal Characterization tab is quite useful for identifying specificity errors and index date misspecification errors. First, I show here looking at CCAE for definition C1 (diagnosis only), with the table sorted by feature prevalence on day 0.

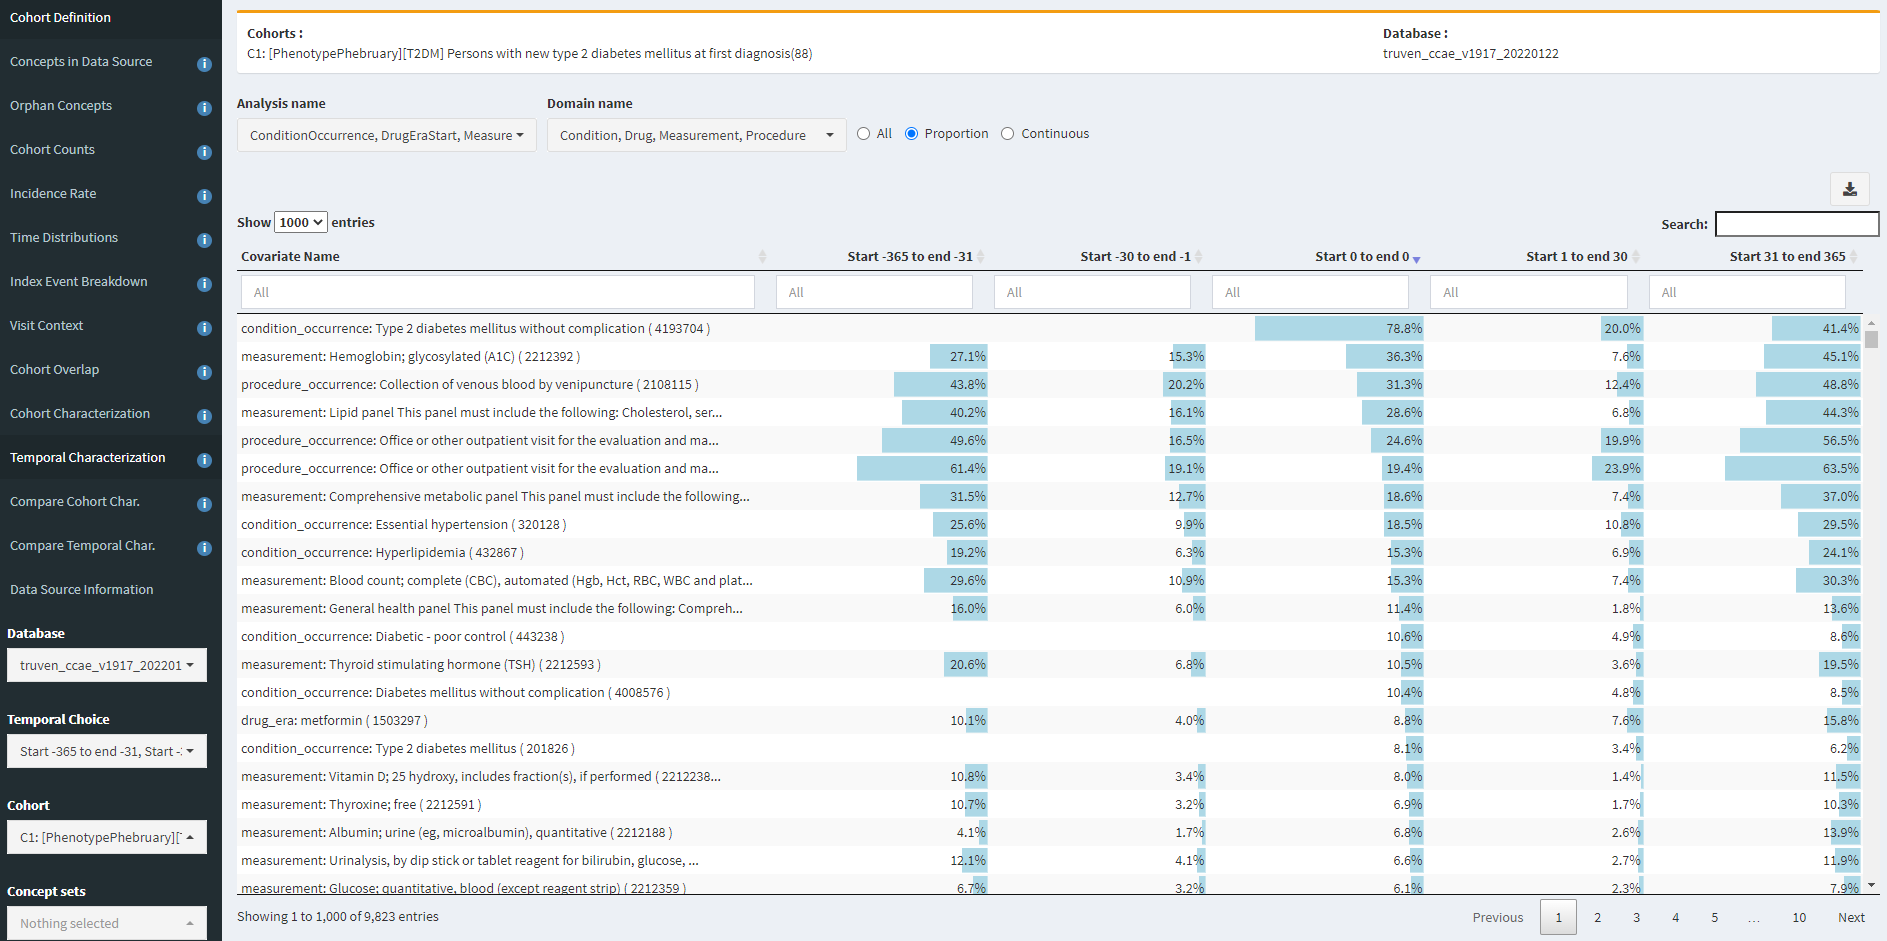
We see that a T2DM diagnosis is the most common element (as to be expected), and that 36.3% of people have a HbA1c measurement on day 0, which is likely in line with general expectations. However, we see that this cohort also had 15% having HbA1c measurement in prior 30d and 27% having HbA1c in the 11 months prior to that. So this is a clue of index date misspecification, in that some of those measurement may be abnormal values suggesting prior disease. Another good clue for this is look at metformin. 8.8% of persons start metformin on day 0, but >10% had already started metformin in the year prior, so that suggests for those people, the first diagnosis date probably isnt the first date the patient was clinically recognized as having the disease (unless the person was taking metformin for some other reason).

If I search for ‘diabetes’, I can also see examples of specificity errors:

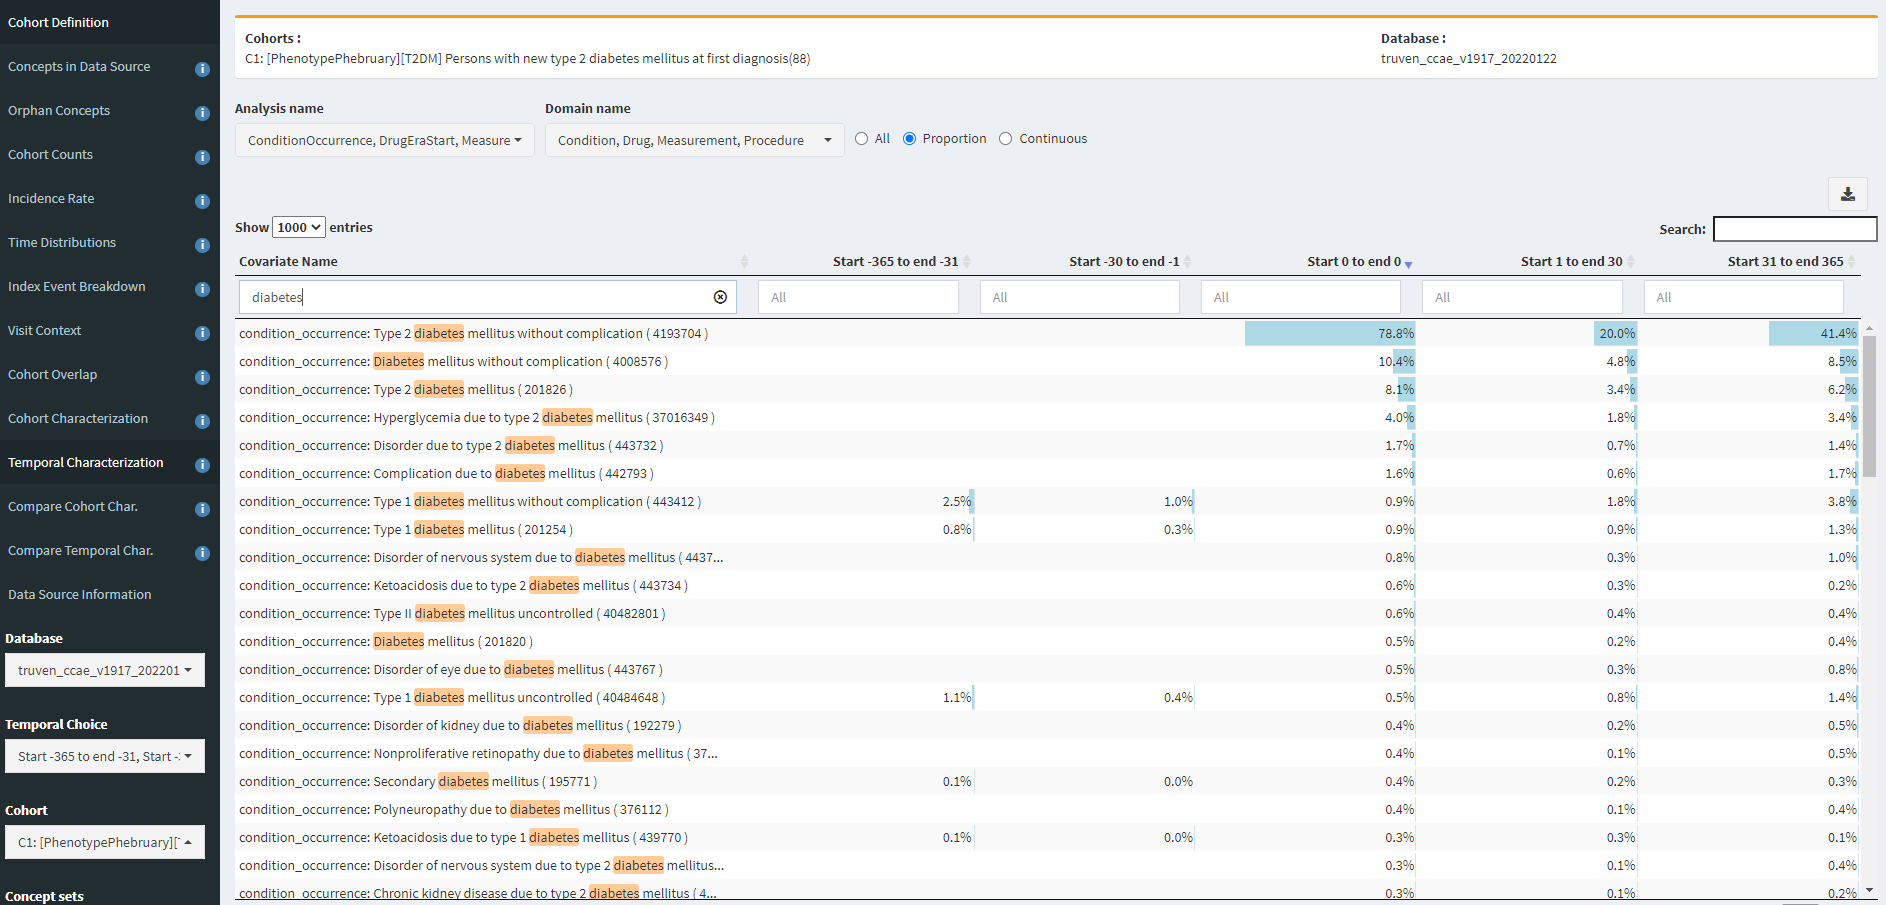
Note, that ‘Type 1 diabetes mellitus without complication’ is observed in 2.5% of the persons in the year prior, 1% in the month prior, and 0.9% on the same day as the initial T2DM diagnosis. While the T1DM and secondary diabetes codes aren’t terribly prevalent, these explain the difference between definitions #1 and #2.

Now, in contrast, if we look at Temporal Characterization for definition #3 (indexed on diagnosis, drugs, or measurements):

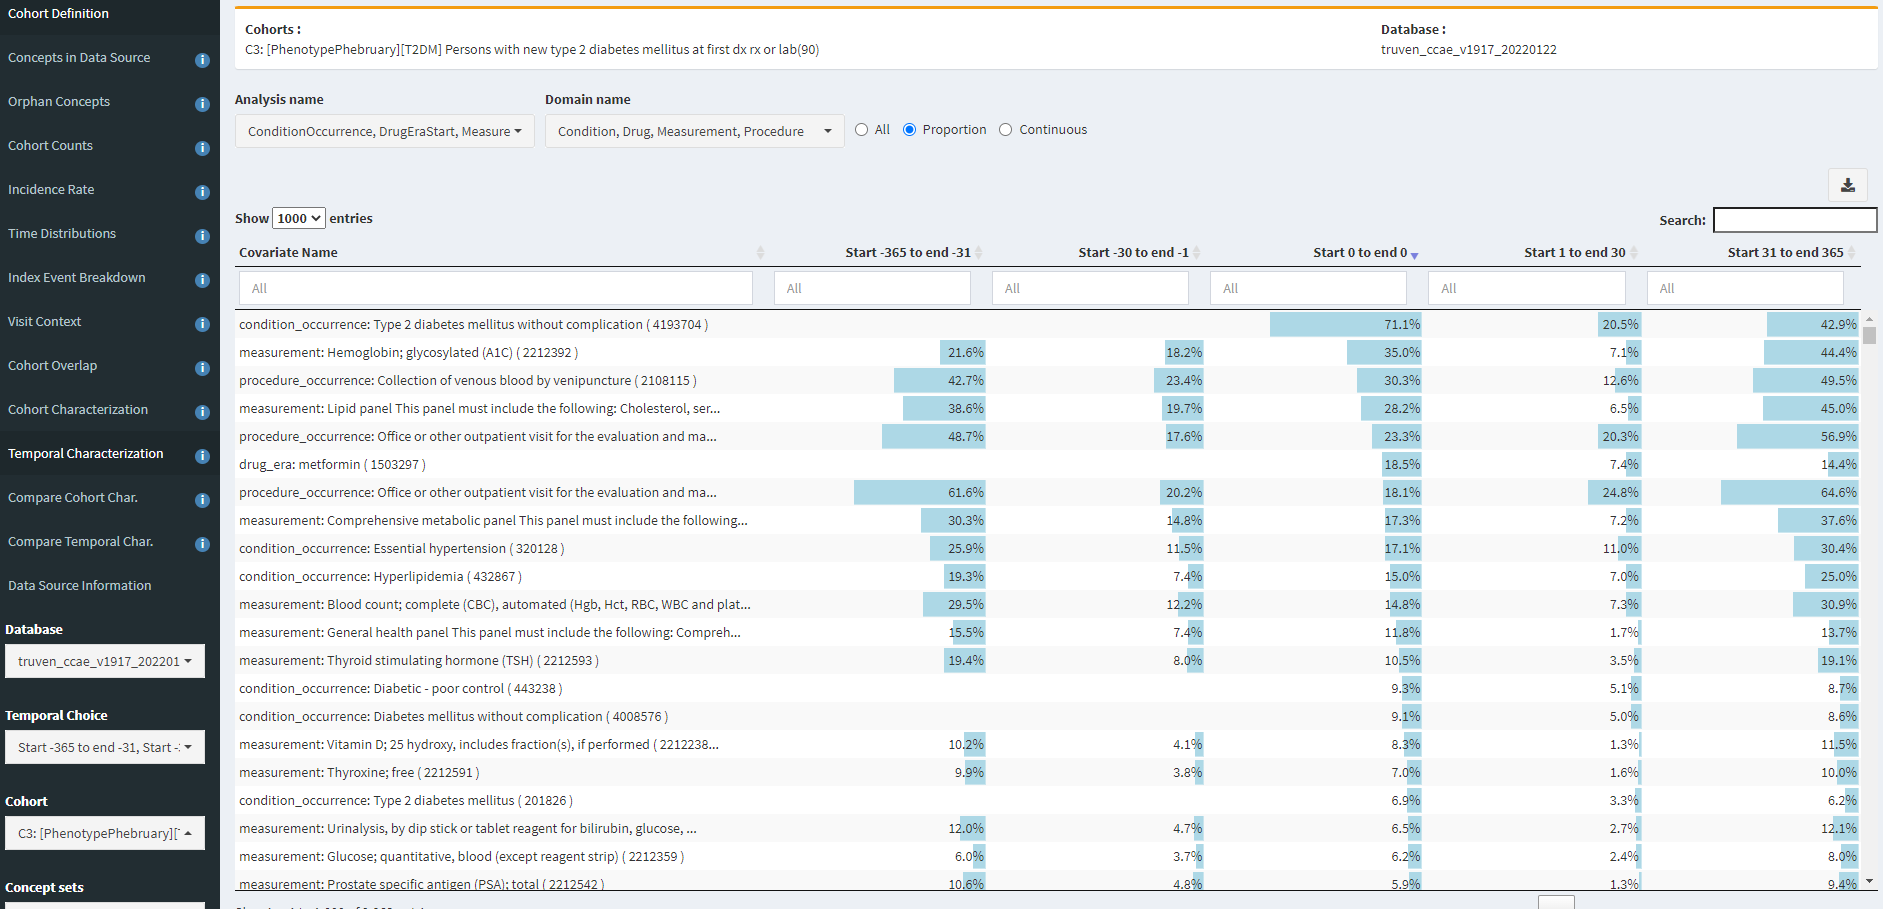
We see that 18.5% of persons now have metfomin on day 0. We also see though that there remains a sizeable proportion of prior HbA1c measures. The CCAE database does not provide measurement values, only the record that a measurement was conducted, but this could be an indicator that still some residual index date misspecification persists.

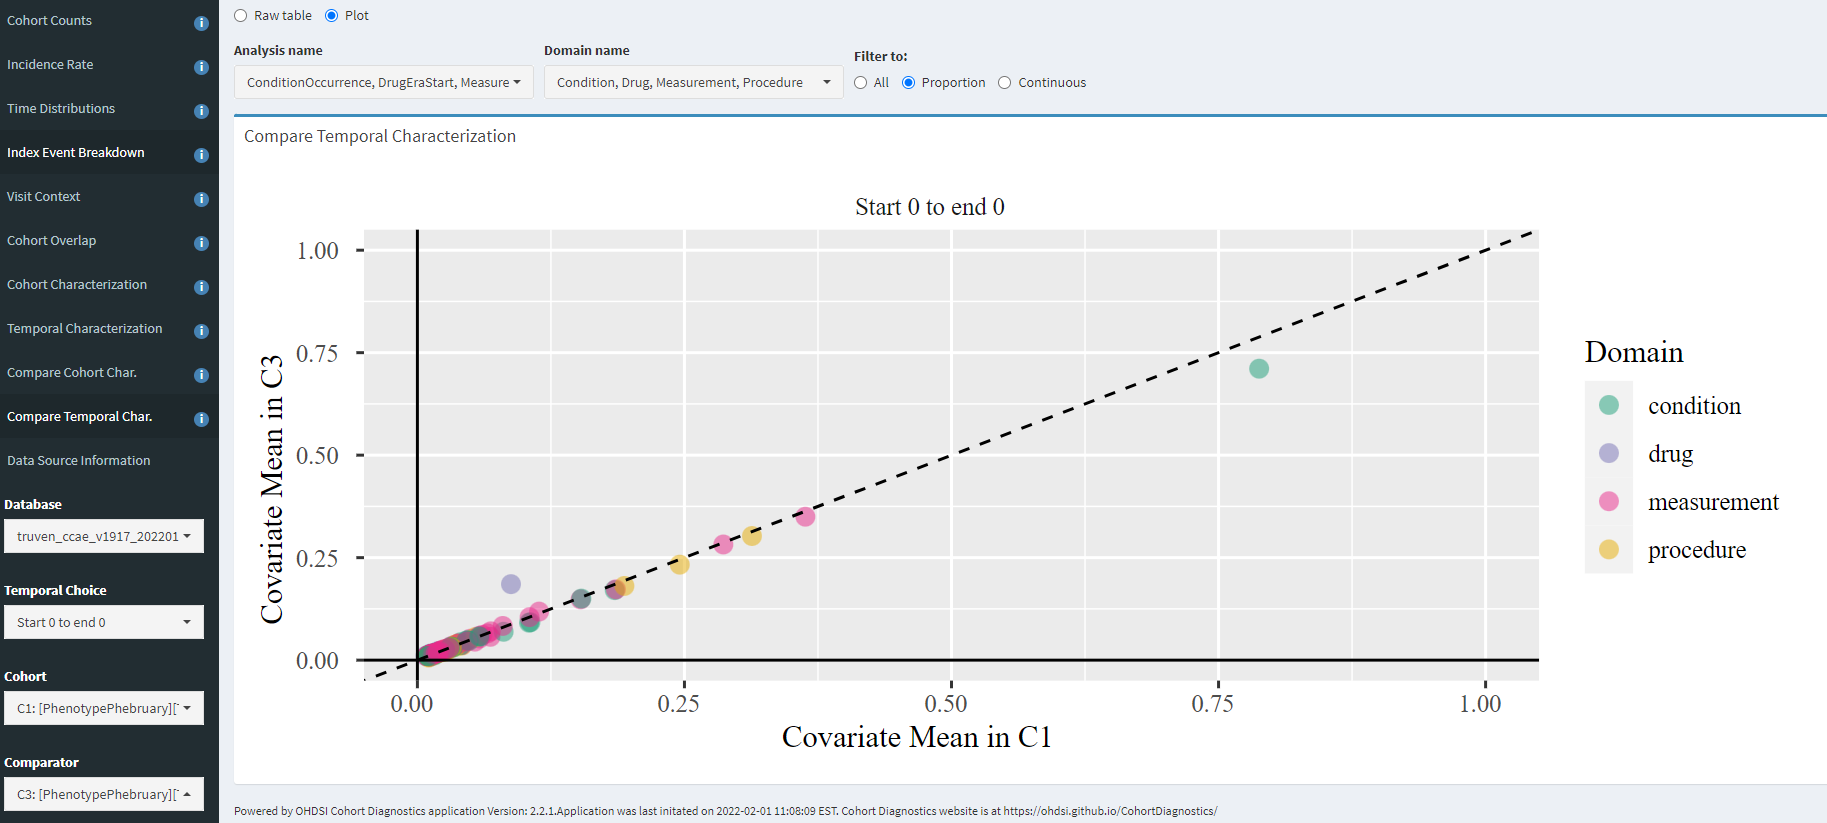
The ‘Compare Temporal Char’ tab allows you to evaluate two definitions head-to-head within a given database, for whatever features you may be interested in. Here, I’m zooming in only to the day 0 events to compare C1 (diagnosis only) vs. C3 (entry on diagnosis/drug/measurement), and we can see that - for this database- the only impact was an increase of day 0 metformin and corresponding day 0 decrease on ‘Type 2 diabetes mellitus without complication’. Otherwise, the patients looks very similar in characteristics (which should make sense, since the C3 cohort represents 80% of the C1 cohort).

Overall assessment

Based on this review, it seems there is clear index date misspecification associated with only using diagnosis codes, so I would recommend that a ‘new Type 2 diabetes’ cohort use additional information, such as drug exposure and measurement values to clean up prevalent cases. It also seems that there is some specificity errors associated with other forms of diabetes, so they can be successfully cleaned up using an approach similar to what is being used in LEGEND-T2DM, but they absolute impact of this appears low.

The six databases used here do not have complete measurement values, so the impact of measures is not fully understood at this point. We did not assess definitions based only on measurement values, which could potentially increase sensitivity (albeit with a likely negative consequence to specificity). I did not run PheValuator or adjudicate cases to try to estimate operating characteristics on any of these definitions, but that would seem like a reasonable thing to consider as a next step (and maybe something that someone would like to take on as part of this exercise).

So, hopefully this is enough information to get the conversation started. What do you all think? What have you learned about phenotyping Type 2 diabetes, from the prior literature or your own analyses? What insights did you gain by reviewing these definitions and the CohortDiagnostics results? Anyone interested in digging further into this evaluation? Share your thoughts, questions, comments, concerns, reflections, here on this thread, so we can all learn from each other.

Happy Phenotype Phebruary everyone!

2 Likes

Wonderful job, and it was great practice for me going through the Cohort Diagnostics. My one question is, if this is incident diabetes, do codes for late complications of diabetes imply that this must be a prevalent case, not incident. It is incident in being recognized by that health system, but likely prevalent to the patient.

Great question @hripcsa ! It’s interesting to think about a code of ‘complication’ and the notion of incident vs. prevalent disease status. Here, we’ve applied a 365d prior observation window requirement. We could consider the question, ‘what if we required more prior observation time?’ and that may potentially clean out these prevalent cases who just hadnt had health service utilization over the original interval. So, for example, look only at incident as those cases with 730d or 1095d of prior observation, recognizing that will likely impact our sensitivity due to incomplete follow-up of our population. But even if we had complete follow-up, I still suspect we’d see many ‘incident recognized’ patients who present for the first time ever with a diabetic complication (because the diabetes was asymptomatic and undetected previously). This probably goes to the semantics of what we mean by ‘new’. ‘newly recognized’ may be a better monikor than ‘newly diseased’.

What do others think?

First - this was a phenotype masterclass. Thanks.

Second - agree that index date mis-specification is a major problem in phenotyping work, and detectable at different timescales. Here, we see it on an ‘outpatient’ time scale, it becomes even harder to handle on an inpatient time scale. When does pneumonia get diagnosed? At the timestamp of the diagnosis code, the time stamp of the chest xray, should it be at the timestamp when they hit the door for the encounter, or are any of these even resolvable in the data? It has an impact on, among other things, the predictive models we create for these outcomes. In the diabetes case, any predictive algorithm developed using the C1 definition will almost certainly converge on having high A1c and metformin use as predictive features, and probably good at predicting that a diagnosis code has been ‘left behind’ in prevalent cases, but perhaps at the cost of it doing a good job of predicting incident cases (which may be why it’s being developed in the first place).

Third - really like the structured walk through CohortDiagnostics. Population level validation is an enormous advance. In a field accustomed to chart review for validation exercises, it may benefit us to think about what a complete structured tour of CohortDiagnostics looks like. i.e. if you were to run a Delphi round using this tool for phenotype x, what are the steps? Are there different classes of x in which those steps should be different?

Thanks @Evan_Minty . You raise a good point about index date(time) misspecification for inpatient events. Very often a dataset doesn’t offer much fidelity to this; for example, administrative claims often only provide discharge diagnoses, so you may know what something happened before or during the admission, but couldn’t pinpoint exactly when. Adding date + time to the CDM was a specific ask from folks who anticipated doing lots of research at the more granular level inside of a hospital, but I havent myself seen any data partners with the timestamped data conducting analyses and examining index date misspecification at that level (though as you highlight, it is almost assuredly there).

To your point on predictive modeling, this is a topic that @jennareps and I have often discussed (including as recently earlier this week): if you run a prediction model and it gets you a really good AUC, then instead of being excited, you might ought to be worried instead, because it could mean that you’ve got some index date misspecification that’s causing your ‘predictors’ to simply be the early indicators of the outcome. Cleaning out the target cohort from all of these items is important to get an honest performance estimate of predicting future outcomes that are truly new. I think this is a critical aspect of phenotyping that is often overlooked or maybe just not thought about in the context of ‘a phenotype problem’.

I 100% agree that developing shared best practices for how to use CohortDiagnostics would be a nice effort to build out across the OHDSI community. Does anyone have any thoughts about what those best practices may be?

This is great! Such an impressive body of work from lab data cleaning to drug coding to complications.

We should talk this month about the gold standard validation efforts to really dig deep into these phenotypes. For sure significant database heterogeneity may be explained due to the collection of the data and we should keep those close to the data provenance close to our research teams. For example a single diagnosis in an EHR (looking at you CPRD) vs routinely billed during follow-up care. We will also need to be mindful that one T1DM code that was a miscode or an early rule out and it’s implications on identifying populations of interest.

Of course as gold standards go I have a probe in my pancreas monitoring beta cell function daily updating my administrative claims data provider with HOMA-IR values of insulin resistance (something I signed up for to get cash in my health savings account). So I think there will always be the patient who truly shows up with prevalent undiagnosed T2DM and on presentation has complications. Surely the T2DM is prevalent but might not even have been known to the patient let alone that health system. Think, people who show up to the ER and deliver a baby without knowing they are pregnant. Agree this nuance should be rare. Always worth thinking through the perfect (probe in pancreas) to the enemy of the good (restrictive definitions to eliminate edge cases).

This should be a fun month as we think through chronic vs acute events, chronic events that relapse and remit, etc. As a pharmacist, the only information we often have at the point of care is tell me what drugs you are on and I will tell you what’s wrong with you. So this phenotype work has far reaching implications even beyond our research needs as we work to identify populations for quality improvement initiatives and early interventions.

Thanks @Kevin_Haynes . To your point about one T1DM code possibly being a miscode and its implications on population of interest, check out this: Phenotype Phebruary Day 2 - Type 1 diabetes mellitus

Lots more fun work ahead of us!

I missed the intro to Phenotype February, so sorry if this is explained elsewhere, but is there a way to get an atlas login to the atlas-phenotype.ohdsi.org instance so I can view the phenotype definition and concept sets?

Is this phenotype definition affected by https://github.com/OHDSI/Vocabulary-v5.0/issues/463?

Hi @Jake, this is the form @Gowtham_Rao shared to get an ATLAS login: OHDSI Atlas Phenotype Library Registration

1 Like

Another diagnostic we can use for determining the performance characteristics of our algorithms is PheValuator. Here are the results I found when running PheValuator on two datasets:

From this analysis, we see that changes in the algorithms had little change in the positive predictive value (PPV) at the expense of lowering the sensitivity. The PPV for each of the algorithms was very good, at or above 85%. The low sensitivities were likely due to these incident algorithms missing a significant portion of cases. This is particularly evident in the Medicare data where most cases of diabetes are likely prevalent from the start of the time in the health plan.

1 Like

This is great, thank you @jswerdel ! For those who haven’t yet played with PheValuator, here’s Joel’s initial paper on it in JBI, and here’s the codebase. He’s also presented several enhancements and benchmark studies at the last couple OHDSI Symposium, and that work is worth checking out.

It is tremendously valuable to get estimates of sensitivity, specificity and positive predictive value. for a given phenotype algorithm. Often with traditional chart review, we only get an estimate of positive predictive value, and if that’s all you’ve got, you can’t actually do any correction for measurement error.

For T2DM, it’s really interesting to see that the PPV is high (>84% for all three algorithms in both databases), but the sensitivity is more modest. This suggests that our algorithms, all of which require a diagnosis code, are missing over half the cases of T2DM. These databases don’t provide complete lab measurements, but you could imagine increasing sensitivity by creating a definition which allows persons with a diabetes drug (even without diagnosis) or persons meeting the ADA diabetes diagnostic criteria based on glucose or HbA1c values. Of course, any approach to increasing sensitivity needs to come with a proper assessment of the impact on specificity (and PPV).

@jswerdel , could you discuss briefly how you parameterized PheValuator to obtain these results?

@Patrick_Ryan this rule of requiring 365 days prior observation makes intuitive sense. From my clinical experience, adults who feel apparently healthy don’t find a reason to seek care. Type 2 Diabetes Mellitus is something that is indolent - i.e. the person feels “apparently” healthy - and probably has the disease without knowing it for a long time. But on the contrary, once a person receives the “label” of Type 2 Diabetes Mellitus - they are more likely to seek follow-up care.

This 365 days prior observation time - trys to tease out the people who are being observed in the database for the first for initial diagnostic care for Type 2 Diabetes Mellitus vs those who are receiving (follow-up management care for Type 2 Diabetes Mellitus.

But why 365 days - why not 1000days or 100 days? Is this an OHDSI best practice or is this a research opportunity?

I think it would be wonderful if Cohort Diagnostics could tell us the characteristics of the people that are in C3 but not in C2/C1. What are the attributes of people we are loosing? Are the population level characteristics of the people we are loosing similar or different from C3?

i.e. are the people we are removing less likely to represent the type of clinical profile described by the clinical description from the American Diabetic Association. If yes, thats perfect!

1 Like

@Patrick_Ryan @hripcsa I think the clinical description should be clarified to make progress on this topic. One definition of incident is the first time the Doctor or the patient learnt that the person has the phenotype. Another definition is the first time the person biologically had the phenotype.

If we are refering to the first time it was learnt that the person has the phenotype: then the 365 days rule would be appropriate.

If we are refering to the first time the person biologically had the phenotype - then the clinical description could clarify that if the person also has indicators of disease chronicity such as diabetic foot, paresthesia, ulcers etc - that is not new onset diabetes. In this case, we will need to add additional inclusion rules to the cohort definition – so as exclude people with such indicator of chronic disease between day 0 and upto some future days as allowed by clinical description (e.g. if it not expected to have diabetic foot within 1 year of biological disease onset)

The clinical description is not asking for biological incidence - as written

@Gowtham_Rao , important point. I probably should have stated it more generically as:

“we add an inclusion criteria that requires some period of prior observation, with the intent to give confidence that the event is new because it hadn’t been previously observed for that prior observation duration”

365 days is purely a convenient heuristic commonly used, but it has no real empirical basis and likely is highly inappropriate in many circumstances: it is probably too short if it would be reasonable to expect a person wouldn’t go back to seek follow-up care every year because it can be managed effectively by the patient (mild arthritis and osteoporosis come to mind), and it is probably too long if it would be reasonable to expect very regular care (like end-stage renal disease, where you’d expect to see monthly dialysis). I’ll also note that the COVID pandemic totally screwed with lots of regular preventative service/well visits, so the gaps between normal care could be longer in 2021-2022, that what we may have seen previously. (Anyone in the community have a database of dental visits to plot this out? :slight_smile: )

The decision here effectively amounts to a bias / variance tradeoff. A shorter ‘prior observation’ value will increase the chance that you are pulling in ‘prevalent’ cases into your ‘incident’ case definition, which means you’ll have greater index date misspecification. But, you’ll also have a larger sample size which will increase your statistical power for whatever question you are trying to answer (which is the argument I most often here, when people like to diddle around with this number from 365d to 180d). A longer prior observation window will increase your confidence that cases are truly incident, but then you may actually be excluding some ‘true incident’ cases simply because they don’t enough historical data.

I do think some empirical investigation could be do into looking at the impact of this design choice. Off the top of my head, I think you’d probably start by creating some evaluation set of persons who did have some extended observation period time (like, for argument sake, 10 years). Then you’d apply phenotypes with different prior observation period lengths within that subset, and you’d be able to compare the resulting patient sets. I don’t have any intuition for how big an issue this actually is, but my initial gut is that 365d could be a bit low for what we may want when services involve annual check-ups and patients may miss or delay a follow-up visit.

I agree - this is an opportunity to test the impact. I will try to visit this after phenotype phebruary thru another OHDSI Workgroup

An old Jim Lewis paper worthy of review regarding identification incident events worthy of review/replication in today’s data. The relationship between time since registration and measured incidence rates in the General Practice Research Database - PubMed

Another consideration is that the requirement of having X many days of observation before the diagnosis forces us to drop persons with shorter observation period before their diagnosis. This can be a problem in US data, where follow-up is truncated when persons change jobs or health plans. Palmsten et al showed this clearly in the context of drug safety in pregnancy using Medicaid (the observed effect is possibly more extreme than in other data sources); see figure 4 in Harnessing the Medicaid Analytic eXtract (MAX) to Evaluate Medications in Pregnancy: Design Considerations

As I was preparing to discuss the parameters for running PheValuator for this analysis, I was concerned about the low sensitivities and wondered if this could be explained. I experimented with different parameters for the evaluation cohort (to be explained below) and got higher sensitivities:


while the PPV’s remained about the same. With that in mind, let me briefly review some of the parameters (for the full explanation, please see the vignette). The process has been changed significantly since V1. In the latest version. we use visit level analyses for estimating the performance characteristics as compared to using all the data in the subject’s record in V1. Details of the xSpec and xSens cohorts are in the vignette and are a bit too lengthy to discuss here. The changes I made were in the evaluation cohort, the cohort with a large random set of subjects either with the condition of interest or without it. In the original analysis I created an evaluation cohort where a random visit in the subject’s record was selected for analysis, including for those with T2DM. However, the algorithms we wanted to test were for the earliest recorded diagnosis for T2DM. I changed the evaluation cohort to only include the earliest visit for those with T2DM. Using this approach increased the sensitivity as shown. Subjects were now being matched better on a visit by visit basis. We had observed lower sensitivities in our PheValuator Benchmark comparisons and this may help to explain that finding.
One other interesting finding, when I changed the first algorithm to not include the requirement for a 365 day lookback (the fourth algorithm in the list), I found a higher PPV compared the the original. Subjects in the prevalent algorithm, on average, may have a higher probability of being a case compared to newly diagnosed subjects. These subjects are more likely to be well into their treatment so the diagnostic predictive model used to evaluate the subjects has more evidence to support the diagnosis and estimates a higher probability of the condition.

@Gowtham_Rao Hi, sorry for joining the discussion late. Not sure whether it has already passed the registration deadline. I filled the form 2 days ago but didn’t receive any email to guide me on how to create an account to access the altas-phenotype.ohdsi.org. Please let me know if something I am missing here.

t