And now for something completely different. I just reviewed a paper on unsupervised clustering of patients, and realized there’s not much done on this topic in OHDSI. Perhaps this is because it doesn’t fall neatly in our buckets of characterization, population-level estimation, or patient-level prediction. Perhaps it is because it is a bit of a soft topic: when is a clustering good?
So the topic is: given a cohort of patients, each patient having a set of features, can we cluster the patients so that patients with similar feature vectors end up in the same cluster? (Not to be mistaken with clustering of features)
I think it would be valuable to do methods research on this, and eventually create standardized tools (a HADES package) that supports this. These are the use cases I envision:
To better understand a cohort. For example, given some not-so-well understood disease, a perfectly valid question is “is everyone that has this disease the same?” If we identify clear subgroups, we may conclude there are different disease subtypes, maybe with different etiologies, which would be important for further investigations.
As outcomes in estimation studies. Arguably, the outcome definitions we currently use are a bit arbitrary. Often outcomes are collections of symptoms that medicine has deemed to constitute a disease, but the causal relationship with the exposure might be with something different, something we could derive from the data.
As effect modifiers. Possibly the effect of the exposure on the outcome is different in different subgroups of patients. One way to identify groups is through clustering.
There may be other uses cases.
Clustering of patients is non-trivial. Here are some of the challenges:
Our data tend to be highly sparse, meaning many standard clustering techniques will fail.
Our data tend to be big (many features and many patients), causing many algorithm implementations to fail.
Evaluating a clustering is hard. We can eyeball the clusters to see if they make sense, but are there more objective measures?
Visualizing and (automatically) annotating clusters is hard. How do we convey the essence of a grouping that was derived automatically through some complicated algorithm?
Can we cluster across sites in the OHDSI network? And can we apply a clustering from one site to patients in another?
What do people think? Is this something people would like to explore? Are people already working on this?
We have done a bit of work on this in my group but using source data. I am cc’ing @Sara_Khalid1@Sara_Khalid as she was the person leading this in my group
This is indeed a very interesting topic. I did some work in my Ph.D. to develop a semantic similarity metric that could be used across sets. This could be used in conjunction with k-means to cluster patients, since it is a somewhat well define distance. Since every dataset has access to an ontology we may be able to compute this across sites without the big computational overhead.
Using alternative approaches with Deep Learning techniques, we could use a transformer-based model like the ones below to obtain a vector representation per patient. From there, any clustering technique should work.
Regarding evaluation, there are some nice objective metrics for clustering such as cluster purity ( this could require chart review) or mutual information-based metrics (2.3. Clustering — scikit-learn 1.6.0 documentation)
This is a topic of interest to me. I’ve built a secondary OMOP application for the use case of identifying list of potential enrollment candidates for a given cohort of patients using a weighted similarity score across blocks of OMOP features - observations, conditions, procedures, drug and device exposures. Measurements are a bit harder to deal with as they are mostly continuous values.
As patients are enrolled into a cohort - its OMOP features form a cluster characterization from which individual candidates are evaluated against and ranked from highly ranked similarity score to low. The cluster characteristics are then updated each time a new candidate is accepted into the study cohort.
As you know @schuemie, I developed database-wise autoencoder for CDM earlier, which is a popular deep learning method for clustering. But I’m not sure it can be a universal method across the OHDSI network because of heterogeneity in vocabulary between institutions and countries. Even though
aspirin 81 MG Oral Tablet [Anacin Aspirin Regimen] is almost identical with aspirin 81 MG Chewable Tablet [Bayer Aspirin], it’s totally different for computer because their concept IDs are different. I couldn’t find a satisfactory method to represent hierarchical vocabulary of OMOP-CDM yet.
Altenatively, I think we can leverage the pre-trained large language models (eg. BERT, bioBERT, medBERT) against OMOP-CDM’s vocabulary system to make universal representation system across the CDM network. All records (or concept IDs) in OMOP-CDM can be fed to computer as English words. If we encode them by using BERT, then we can make a much more condensed representation for each event for a patient in CDM. And I think that this can be a universal representation system for CDM across the OHDSI network,
which can be used for clustering too.
This is similar to what @jposada introduced. But I think we can use English terms instead of codes for better generalizability.
What if we would string together the parents in the hierarchy and use those as tokens for entity embedding? Seems a pity to not use the concept hierarchy when we have it, and just go for the name itself.
Using the full names might be susceptible to some strange results: changing the dose is but a slight change semantically but can have pretty profound implications clinically, whereas another brand name is a large semantical change but (probably) with little clinical impact. So, perhaps leveraging the hierarchy and go up some to predefined level (depending on domain, I suppose) to get to more generic names?
Would also be cool to use temporal information in the entity embedding; we have done that in a paper (unfortunately not using OMOP) in which the entity embedding is a feature engineering step in a prediction model and it works quite well.
Thanks all for the great responses! However, I do want to keep the focus on patient clustering, not feature clustering. I fully recognize the importance of feature clustering (as @SCYou’s example demonstrates), which has its own set of use cases. I just fear that mixing the two is overcomplicating things.
Before we start a document, I would prefer to keep the discussion a bit high level first.
Distance metric
To @jposada 's point, a central question is: what is the distance metric? Given a distance metric, there are many clustering algorithms we could apply, as well as many cool 2D visualizations of the high-dimensional space. When playing with patient clustering some time ago, I did find these challenges:
Our data is sparse and high-dimensional. So a simple vector similarity metric such as cosine fails because most feature vectors have no overlap (=infinite distance?)
Minor semantic differences can be mistaken as no overlap. (i.e. two highly related concepts are considered different simply because they have different concept IDs) This does bring me back to @SCYou 's point, although if we use feature extraction, with its default setting of grouping by the concept hierarchy we should already have a reasonable solution.
Some features carry more information than others. Everyone belongs to an age group, almost everyone has hypertension. Overlap on these covariates is much less informative than, say, overlap on some rare disease.
@jposada : could you share your work on semantic similarity?
Gold standard
The OHDSI way of methods research is to do empirical evaluations, using real data and real examples. Does anyone know of diseases with well-established subtypes? We could then see whether our clustering algorithms identify these subtypes. (E.g. if we cluster diabetes patients, a clustering algorithm should put type 1 and 2 diabetes into their own clusters)
If we know what we are trying to cluster on, then we can go to a relevant lower dimension and match on that. E.g., for PS, we know we want to “cluster” by propensity to treatment. The use cases sound like illness mostly (using diagnosis, medication, test, etc.). There are low dimensional organ system representations. For a different purpose, Ahmed Elhussein, PhD student with us, is studying the low dimensionality of medicine; he is addressing unmeasured confounders. But there may be overlap in the work.
Below is a link to my dissertation. The metric can be found in page 38, equation 3.3.
I like the idea of George of subtypes. Regarding use cases, I believe head trauma and breast cancer may have well identified and defined subtypes. Of course, I am not a clinician, but I think it may be a good place to start.
Just to add on top of what George mentioned, here’s a nice review on patient similarity: end-types, clustering and many more.
On feature similarity, we don’t have to use one metric, right? We can try out different metrics (as we tried in a slightly relevant work or a mix of metrics (as done here and in many more works). In the former work we (DBMI group) tried to cluster patients based on the embeddings and got some clusters that made sense but encountered the issues Martijn mentioned above: common things like hypertension were everywhere, adding more dimensions (such as using multiple domains as opposed to conditions) skewed things up etc. Also, as a separate note, I’d imagine that the model that was trained on and worked well for a tertiary care US hospital data may not work for, say, CCAE.
I’ve read most of the work people recommended. I especially like this paper George mentioned, where they evaluated whether adding ontology information improves similarity (it didn’t). I like it because they do a very good job of evaluating the distance metric and resulting clustering, and we could definitely learn from that. I am very surprised though that they did not weigh features by how informative they are (think ‘hypertension’). I would have used something like inverse document frequency to downweigh common concepts.
I agree we don’t have to pick a single metric right now. I think there’s enough appetite for a methods experiment where we evaluate a wide range of options. But before we go and define what that looks like, I would like to frame the problem we’re trying to solve a bit better:
Target cohort. The group of patients we wish to cluster.
Feature time window. The window in which features are collected. Three main options come to mind: ‘all time before cohort start’, ‘all time after cohort end’, and ‘all patient time’. For example, if I want to identify different disease etiologies, I may want to restrict to all time prior to cohort start (disease onset). If I want to identify different treatment strategies, I may want to restrict to all time after cohort start (treatment initiation).
Feature domain(s). On what features do I want to cluster? This could be top-level domains, like ‘conditions’ or ‘drug_exposures’, or narrower domains like ‘neurological symptoms’.
These seem like the choices one needs to make to define the question we’d like to answer in a clustering study. Other choices, such as which metric to use, seem to determine how one answers the question, and ideally our methods research and software tools would help in those design choices.
What do people think? What did I get it wrong? Suggestions for other slots in the template?
I think these slots and first outline seem very prudent. I don’t know if it would be a slot per se but I’d include whether to consider the the timing of “entities” on which the clustering will be based. And whether the researcher wants to use continuous or binned time (and what bins).
Not to derail the high-level discussion but just wanted to add (if anything so it’s out there) that entity embedding might be a feasible way to map the sparse features to a dense embedding vectors in a lower-dimensional space where the metrics (whichever they be) can be applied.
Another thing that could be interesting (although just a thought that might prove nonsensical after more careful consideration)—again more low-level (sorry)—is doing some kind of transfer learning. So for example site A trains the embedding, then site B continues training on that, then C, etc. Site A might even train maybe in only half in the beginning and receive the “transfer-learnt” model from the last to fine tune on their remaining patients.
Hi all! Is the idea to explore general patient similarity, or similarity in a domain (eg, neurologic diagnoses, as in one of the referenced papers) or with regards to a specific scientific question?
I would like to explore both. so general and specific similarity. I was thinking that could be specified by question 3 in my study design template, where you specify the domain(s) from which features are to be constructed.
Just to make things a bit more tangible for myself I hacked together some code. Here’s what I did:
Created a cohort of people having a condition occurrence of diabetes or any of its descendants, with the index being the first diagnosis, and requiring 365 days of observation before and after index.
Took a 10,000 person sample.
Using FeatureExtraction, I created features for all demographics, conditions, drugs, procedures, observations, measurements, adding ancestor concepts using FeatureExtraction ‘Group’ analyses. All covariates are binary.
Removed people who had less than 100 non-zero covariates, and covariates that occurred in less than 10 persons.
Used the inverse document frequency as covariate value, and computed cosine similarity.
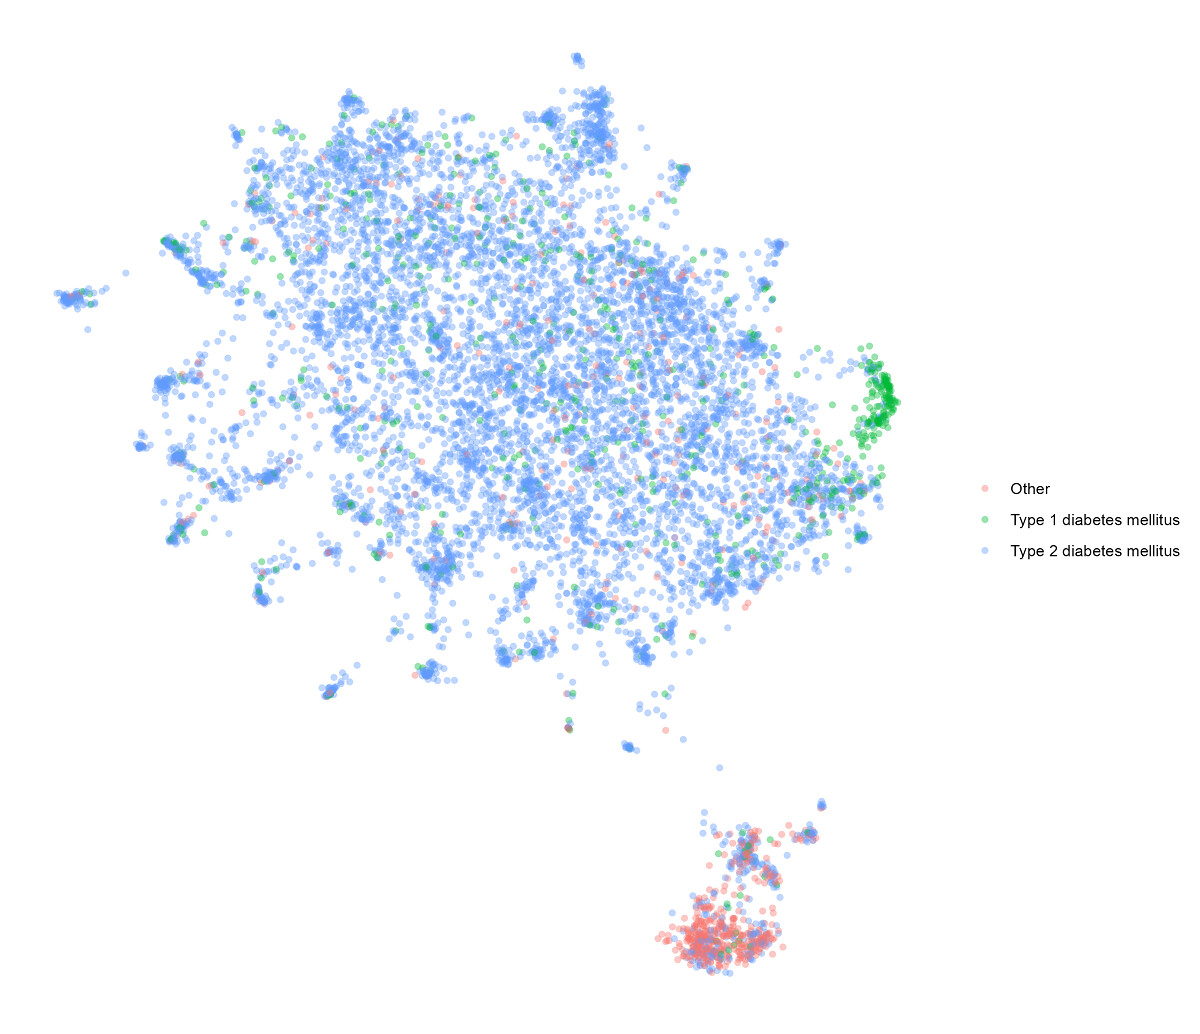
Plotted the data using Uniform Manifold Approximation and Projection (UMAP) based on 1 - cosine similarity.
Below is the result. Using the extracted covariates I color-coded those who had type 1 diabetes, those who had type 2 diabetes, and all others. (Patient’s with both type 1 and 2 concepts were classified as type 1).
I personally find this a very interesting plot. The people who have a diabetes code that isn’t a type 1 or 2 code are really very different from everone else. Type 1 diabetes also is clearly its own cluster, although there are some type 1 cases in the general type 2 area, which may very well be in the data (either people with type 2 who progressed to type 1, or type 2 accidentally also coded as type 1).
Next up I’m applying a clustering algorithm, which seems to take some time. I’m curious to see what that brings.
This is indeed fascinating. Reminiscent of the patient trajectory work some have done.
The coding of diabetes is vexed as we know. Many just termed diabetes, a number incorrectly diagnosed and/or coded.
T1DM are those congenitally or adolescent presenting with insulin-dependent disease.
T2DM are those later onset (though sadly now being seen in children) of so called diet-dependent disease, responding to dietary changes, oral drugs, and at worst insulin.
These are very different phenotypes (let’s not get into T3DM!).
It would be very interesting to see the association of comorbidities, for instance NAFLD/NASH in the T2DM patients. Indeed this may also be a way of training/refining the likely diagnosis, especially with regards to misdiagnosis our miscoding. The more correlating variables to add to the granularity and power of a model, the better in this case?
Btw, hence you wouldn’t see patients progressing from T2DM to T1DM, or generally vice versa.