OHDSI Home | Forums | Wiki | Github

Phenotype Phebruary 2023 - Week 2 - Debate - Chart review gold standard validation vs innovative methods like PheValuator

On week 1 of Phenotype phebruary we had a lively discussion on the idea of Phenotype Peer review (summarized here)

For week 2 - we are going have a debate with two sides:

Side 1: Conventional Gold standards such as chart review adjudication should be the only way to validate cohort definition and estimate their measurement errors.

vs.

Side 2: Conventional Gold Standard like chart reviews are not feasible and community innovative methods like Cohort Diagnostics and PheValuator provide reasonable alternative.

Why is this debate important?
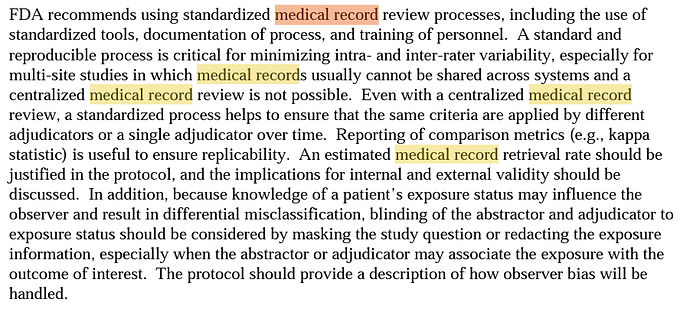
Draft Guidance for Industry titled released September 2021 (retrieved February 6th 2023) titled ā€˜Real-World Data: Assessing Electronic Health Records and Medical Claims Data To Support Regulatory Decision-Making for Drug and Biological Productsā€™ reads

We as a community have a need to quantify and minimize outcome misclassification

So how do we do it? Those in chart review camp may say that source record (that includes the unstructured notes and structured lab results) is the valid way to perform validation - because it reflects in most detail the intent of the person who provided care, while the extracted de-identified data that most researchers have access to (e.g. licensed data sources) are only a lossy abstraction and may not represent the truth. While those in the innovative methods may argue that validation performed on one data source in one time era is not transportable to another time era and another data source, and a case only review (chart review) does not provide the full picture of quantitively bias analysis.

What side would you take?

You MUST get a chart and have it reviewed by an expert.

Core concept of Pharmacoepi:

Recommended by regulators:

By this extreme logic some of our largest data resources available would never be utilized. MarketScan and IQIVA.

I tend to be in the PheValuator camp on this :smile:. The main issues with chart review studies are that they only apply to one database (and weā€™ve seen substantial differences between databases) and they only provide a portion of the data needed for quantitative bias analysis (QBA), namely PPV. While a tool like PheValuator may not be the ultimate solution, we, as a community, need to work to develop methods other than chart review to solve this problem. We must begin to perform QBA on our studies as the important work of @jweave17 has shown. We canā€™t continue to live with misclassification bias and we likely canā€™t simply assume the bias is non-differential and that it doesnā€™t affect our conclusions.

@jswerdel I was being provacative to kick us off. I think PheValuator gives us a lot of options for quickly running a series of diagnostics that give us more than just a PPV to refresh our characteristics on data over time as well as an ability to assess changes to phenotypes without having to go back and conduct expensive time consuming chart validations. Weā€™ve seen differences between databases. Have we assessed differences within databases over time? I know we are working on showcasing differences in exposure to assess the non-differential assumptions.

@Kevin_Haynes thank you so much for posting Weinstein et;. paper. While it can be painful to read the perspective they propose in the paper, Itā€™s very important for us to understand what others take as granted current practice. It reminds me of the feed back I usually get after presenting our approach for phenotype evaluation (which is based on none conventional tools like cohort diagnostics and PheValuator) - the audience all get excited and seem to follow then someone ask " are these phenotypes validated?, what was your gold standard". I 100% agree with @jswerdel that chart reviews are not feasible and at best provide PPV and while registries may be another nice source of truth , we yet to have a registry for every condition possible?! so what do we do? what do we need to do as a community to move the discussion forward. I will tag @Andrew here who actually have a real recent experience in attempts to validate phenotypeā€™s that we can learn from.

I was hoping to see a more lively discussion on this debate. But thereā€™s still time!

Let me be deliberately provocative to try to poke the flames a bit:

I donā€™t think chart review of candidate cases is very helpful for validation, and I could argue that itā€™s actually holding us back.

My argument: we need the ability to estimate and correct for measurement error. Measurement error metrics include sensitivity, specificity, positive predictive value, and negative predictive value. Case adjudication amounts to only examining the candidate cases and estimating positive predictive value. With PPV alone, one cannot perform any measurement error correction. Instead, it just provides some general semblance about proportion of identified cases that are true, without any regard to sensitivity or specificity. I can easily achieve a high PPV for a phenotype algorithm by creating an extremely narrow definition that requires prior symptoms, diagnostic procedures, treatment and follow-up care, but doing so may have extremely poor sensitivity (in the extreme, imagine I only identify 1 person with the disease and they are correctly classified: I have PPV=100% but with unknown sensitivityā€¦does that make the definition ā€˜goodā€™? You have no idea without more information. If the example was T2DM, and my algorithm required >10 HbA1C measurements > 8% AND >10 dispensings of diabetes drug AND >10 diagnoses of T2DM, then I bet I can get a good PPV but Iā€™m also pretty sure Iā€™d be missing most of the true T2DM cases as well).

So, PPV without extra context isnā€™t helpful, but PPV is the only thing you can get out of case adjudication (unless you do chart review on all the non-cases as well). And yet, we often hear folks argue that ā€˜unless you go back to the charts, you canā€™t validateā€™. So, weā€™re caught in a downward spiral that we insist on something that can never fulfill our needs.

Now, if we can develop approaches to estimate sensitivity AND specificity AND PPV, then we can use those estimates to correct for measurement error, and we can also continue to improve our measurement error estimation methods. Thatā€™s why Iā€™m excited by the direction @jswerdel is pushing us with PheValuator, because it at least provides some estimates - however imperfect - of the metrics we need. In absence of that, weā€™re left to make assumptions. And the current assumption that most papers implicitly make is that error is sufficient small that it neednā€™t be adjusted for (since very very few papers do any measurement error calibration). Given everything weā€™ve seen, Iā€™m much more comfortable assuming measurement error is NOT negligible than hoping that it is.

We have developed approaches to estimate sensitivity, specificity and PPV for ML-determined phenotypes ā€“ you donā€™t need to perform chart review on all samples, just a well-designed random sample.

We did some simulations on chart review and found that you can get a good handle on the calibration of a positive-unlabeled learning classifier by randomly selecting 1-2 charts at each 1% interval of predicted probability and evaluating whether it is positive or negative for the phenotype. We did this for our self-harm phenotype described in our OHDSI 2022 Symposium poster, and found we had good calibration. Therefore we can dial in a desired sensitivity and specificity having reviewed 100-200 charts. If the classifier was not calibrated, you could use those chart assignments to recalibrate, for example using a logistic, or isotonic transformation.

This work is currently under review for a publication, and I will link it once we can get a preprint up.

2 Likes

All right. Let me hold the rebuttal, even though in real life I usually say what @Patrick_Ryan said.

There are 2 counter arguments:

  1. NPV is by far not as important as PPV. Why? Because the prevalence of all diseases is low. So, even if all cases were missed and are sitting as false negatives in the negative bucket, that would reduce the NPV from 100% to what? 99.something %? NPV is useful for diagnostic screening, where positive and negative cases are in the same order of magnitude.

Sensitivity and specificity are different, they are both coefficients of the cases. They are not drowned in the ocean of unrelated patients. But calculating them from PPV and NPV, even if we had those, would suffer from the error that the almost 100% NPV would bring in. So, you cannot substitute them for what you really want anyway.

  1. We donā€™t have a way to measure sensitivity and specificity. Only the Lord in Heaven knows the actual numbers. PheValuator is a crapshoot, except there you know you got craps or not. The tool tries to guess the actual truth using some probabilistic model. It does that using the same data used for the deterministic cohort definition, there is no secret extra intelligence it can go to. And we have no idea how good the model works. If we knew it did a close to 100% job why not use that model instead of the phenotype definition. This really is a case of two drunkards helping each other across the street.

Well, there is

  1. The chart review actually has extra information we donā€™t have: The unstructured text. You can just read the discharge summary and it will tell you whether or not it was a case or not. No need to second guess.

I have heard the definition of chart review differently, but so that we all align and for me to learn

  • It is retrospective: i.e. the patient is not in front of you, and you donā€™t have access to the responsible physician. What is in the medical record is all you get. This is the difference from a ā€˜registryā€™ where the registry may interview the responsible physician or even request patients to have a specific tests.
  • It has unstructured text: i.e. it has something more than computer query able extracted data that has not been transformed to a structured data model like OMOP? Like paper charts that cannot be subjected to NLP, or written in a way that NLP cannot understand? If all relevant data is structured into OMOP CDM and query able is this still an issue?

What is this chart? Is chart validation an attempt to address ā€œmissing data problemā€? i.e. because we think the data in our research dataset is an extract it has missing data. And by looking at the chart we can solve that?

This is based on the assumptions that a) discharge summaries are unambiguous and contain the ground truth and b) chart review is reading discharge summaries.

None of these is entirely true. We know that charts contain an overwhelming amount of info which can be both contradictory and repetitive (cit here). We also know that clinicians follow different practices when reviewing charts (cit here and here). Unstructured text may or may not provide additional information and may or may lead to accurate conclusions regarding patient state. It very much depends on the condition, healthcare system and data capture and qualification of a reviewer (and if there is one reviewer or more).

What I think chart gives us is a narrative that makes us trust the information (also cit here). Sometimes it does give additional info but whether this info is crucial for classifying patients depends on a use case.

We in fact tested this assumption and concluded that for at least 4 chronic and acute conditions on a datasource with rather good capture (Columbia EHR) free text doesnā€™t provide benefits compared to structured data (here). On the other hand, I do share you love for something interpretable. You may consider contributing to transforming our POC of interpretable chart review alternative into a full-scale OHDSI tool (your experience would be much appreciated :)).

1 Like

Just a bit of a rebuttal to point 2. The tool develops a model based on all the data for a subject identified in the deterministic cohort definition. There are many covariates in the observational data that are not included in the deterministic model that PheValuator may use to better define the differences between those with the condition and those without.
We do have some idea of how well the model works based on our analysis of the results from PheValuator compared to the PPVā€™s from prior validation studies.
Why not use the model instead of the phenotype definition? Good question - our friend @Juan_Banda can attest to the validity of using a probabilistic method. I would fully support the use of probabilistic models in our work. I like the idea that the model tells you the probability of the subject having the condition just as a clinician is really telling you the probability of the patient having the outcome. As Christian says ā€œOnly the Lord in Heaven knowsā€.
To point 3: ā€œYou can just read the discharge summary and it will tell you whether or not it was a case or not. No need to second guess.ā€ Half the chart review validation studies are doing just that - looking over all the data in the chart and assessing the validity of the discharge summary. Are they wrong in doing that?
Old joke: Whatā€™s the difference between the ā€œLord in Heavenā€ and a clinician? The ā€œLord in Heavenā€ doesnā€™t think heā€™s a clinician (that was for the two drunkards comment :smile: )

Calling this groups attention to a recent post by @Christopher_Mecoli

This needs to be strongly pushed and marketed. Because in the eyes of the ordinary evidence seeking wretch chart review is straightforward: A physician opens it and everything is crystal clear.

Same. This all should go into the message ā€œchart reviews are not as easy as you think they are. It is a messy world.ā€

You should promote its name ā€œKEEPERā€. :slight_smile:

Ok, back to my pro-review avatar:

I understand, but that makes the assumption that the other data somehow ā€œknowā€ better and the rather simple covariate extraction keeps that knowledge. That may or may not be true. Also, we have no idea how well the tool deals with closely related differential diagnoses, for which you have to apply specific exclusion criteria in the deterministic one. In other words, we have no idea how many type 1 diabetes patients a probabilistic model of a type 2 erroneously swallows in because the ā€œotherā€ data look so similar between these patients.

Now, thatā€™s funny. In that paper, you are using chart reviews as the gold standard. I thought you wanted to be better. :slight_smile: Which means you should not proudly report that you are getting closer.

1 Like

Whatā€™s the difference between the ā€œLord in Heavenā€ and a clinician? The ā€œLord in Heavenā€ doesnā€™t think heā€™s a clinician

The lord just told me he agrees your joke isnā€™t that funny

sincerely,
a clinician
:slight_smile:

2 Likes

@aostropolets 's post includes some points which are consistent with my position on this debate, which is that it depends on the dataset / datasource as well as the specific phenotype. @jswerdel I am also curious if there are characteristics of a dataset that we know will make it more or less suitable for PheValuator?

Necessity of this narrative is highly dependent on the phenotype/research question. The suitability of structured data fields for accurately & completely capturing a diagnosis varies widely between conditions. Oncology is an obvious example where structured data can fall short.

Key bit here is that the Columbia EHR has good capture. Some institutions are not so fortunate (and even individual physicians using a ā€œgoodā€ system may be more or less diligent at keeping their structured data fields accurate and up-to-date). I think the necessity of chart review validation is highly dependent on this aspect of a data source. Would be cool to see Annaā€™s study repeated at other institutions!

Maybe there is a set of criteria to be developed for helping determine whether or not chart review validation is recommended for a given phenotype on a given dataset. Or perhaps this is better approached as a data quality question at the dataset level - what do we know to be missing from a given dataset due to omitted unstructured data, and as a result what can we do with this dataset.

I will chime in on this, as Iā€™ve been a big fan of the complimentary nature of

  • Profile review (thorugh CohortExplorer, or ATLAS - our equivalents to chart review, pending KEEPER, although narrative chart review can also have a role)
  • Population level diagnostics (i.e. cohort diagnostics)
  • Phevaluator / statistically learned models.

Event sequences tell the patient story.

Currently, itā€™s difficult to infer sequences from our population level results in cohort diagnostics (beyond typical ā€¦[-30,-1], index, [1-30]ā€¦ windows), and it can be difficult to reconstruct population level strata ā€˜storiesā€™ from feature extractor output in Cohort Diagnostics. Neither of these diminish the big advance ā€˜population level validationā€™ represents for our field!

We do have tools / adjuncts that could conceivably do this. Time windows can be adjusted (although things get messy at a population level, if you try to get too granular), cohorts-as-features in cohort diagnostics can sum across concepts, and treatment pathways can lay out population level sequences. Configuring them upfront however, would represent a large front loading of effort in phenotype development.

Contra @Patrick_Ryan 's provocation around the value of timeline review in ascertaining PPV. In reviewing timelines / cases, the sequences of most interest are the misses, not the successes or their frequency.

Discerning the ā€˜failure modesā€™ of the misses, often benefits from the information that we are otherwise losing regarding event sequences, or that we would have otherwise struggled to anticipate a priori. Once identified however, questions around the prevalence of possible ā€˜failure modesā€™, can often be answered in cohortDiagnostics output.

Synergy, Kumbaya, and all that!

But Iā€™ll also be provocative.

Is it possible that our current processes and tools have been conditioned by the fact that we donā€™t routinely adjudicate individual profiles as part of our process? In adjudicating profiles, for example, one thing Iā€™ve found is that often, the sum of features relating to a competing diagnosis can be the ā€˜featureā€™ that outweighs the diagnosis of interest in ultimately determining a ā€˜caseā€™. We donā€™t have tools to evaluate that easily (hat tip, Phea, & coming: KEEPER). But is that because we havenā€™t been exposed to those failure modes enough?

Given the interest in ā€˜failure modesā€™, Iā€™d agree ā€˜in-sampleā€™ validation is in some ways the least interesting. Iā€™ve still found it useful. It has revealed issues that I donā€™t think easily come to the foreground otherwise. Iā€™ve made mistakes in cohort design logic that are immediately obvious in looking at <5 trajectories.

In sum - I think Profile validation has a role in a few areas that tie together our tools.

  1. In sample validation. 15-20 cases. Main interest is whether thereā€™s a pattern when it fails; the prevalence of those failures can often be assessed with cohort diagnostics output.
  2. Xspec validation. 15 cases. Our prior for misses is very low, but worth examining simply given how much of our subsequent decision making is conditioned on xSpec output. Almost all cases, so should be fast! Might save you angst down the road! To @katy-sadowskiā€™s point, Iā€™d agree (having been involved in Aphrodite generation of the Charlson co-morbidities) that some things are simply hard to phenotype, statistical model or not, and some features arenā€™t what we wish they were.
  3. (Proposed, as I have limited experience in this set): Areas of disagreement between pheValuator, and the rule based cohort definition (false positives, false negatives). These can be selected from samples that are close to the decision boundaries. In the information theory sense, this is where we can probably learn the most. Maybe 15 of each. These may well inform future iterations of the cohort definition. (I also really like @Christophe_Lambert 's approach to calibration ā€“ look forward to reading it when itā€™s out in print).
  4. There are situations where we reach a boundary of what we can determine from the observational record. A good example is trying to determine differences between single encounters for a mild case of X, and an encounter for a ā€˜rule ā€“ outā€™ X . Those may even be reasonably prevalent . In sites amenable to it, a targeted narrative chart review (or event result report review) might yield some insights, to the extent that they relate to underlying biology, they may even generalize, more or less. Iā€™d be wholly excited by any forthcoming finding that showed that such insights arenā€™t important enough to change an effect estimate (@jweave17 ) How excited? One side of my chest is not yet spoken for!
1 Like

Iā€™m a couple weeks late to the party on this one, but I thought Iā€™d quickly chime in with a few thoughts from someone who spends a fair bit of his time on chart validation studies:

  1. The believe the main issue of concern here is to address outcome information bias/measurement error.
  2. I think PheEvaluator does a commendable job at trying to address measurement error through being more thoughtful about the health condition in developing models which can provide bias parameter estimates that can be used to adjust for outcome misclassification when using conventional/simple phenotypes. As others have said, it would be even more helpful to have another source of data like charts to more rigorously evaluate any type of phenotype (model or conventional approach).
  3. In terms of chart validation, I agree with @Patrick_Ryanā€™s comment that as mostly commonly implemented (sample cases only; provide one PPV) they are of limited utility. That being said, there are chart validation approaches that can provide estimates for sensitivity without radically increasing the size of the validation study. So a validation study that provides estimates of PPV and Sensitivity (in all comparison groups, assuming this validation is for a comparative effectiveness/safety study) one could use the Brenner & Gefeller QBA method to adjust for outcome misclassification. We outline this approach in a commentary that my colleague Steve Lanes and I just published in PDS. Getting estimates of specificity and NPV through chart validation may be prohibitively expensive/unrealistic for rare outcomes. Getting estimates by comparator group for PPV and Sensitivity would be more resource intensive than traditional validation (PPV only) studies (e.g. may need 500 charts instead of 150), but would be of most greater utility to address outcome misclassification and still be considerably less resource intensive than say RCTs.
1 Like
t