OHDSI Home | Forums | Wiki | Github

Introducing the OMOP CDM ER diagram challenge! Submissions due 13Dec2022

Friends:

I’d like to announce the OMOP Common Data Model (CDM) Entity-Relationship Diagram (ERD) Challenge! Starting today, all members of the OHDSI community are welcome and encouraged to submit their entries of the best ERD for the OMOP CDM to this forum post (or to the CDM Workgroup teams site) by Tuesday, Dec 13. One winner will be selected by a committee from the CDM workgroup, and announced on OHDSI’s last community call of the year on Dec20, with their award-winning ERD being a gift to our entire community, posted on the official OMOP CDM git page, but also the winner receiving a special gift from the OHDSI community! This should be a fun activity for our community, particularly those of you helping drive our open community data standards, to learn and collaborate and contribute to a community resource that all of us can benefit in. So, please accept the OMOP CDM ERD Challenge and get diagraming!

Background:

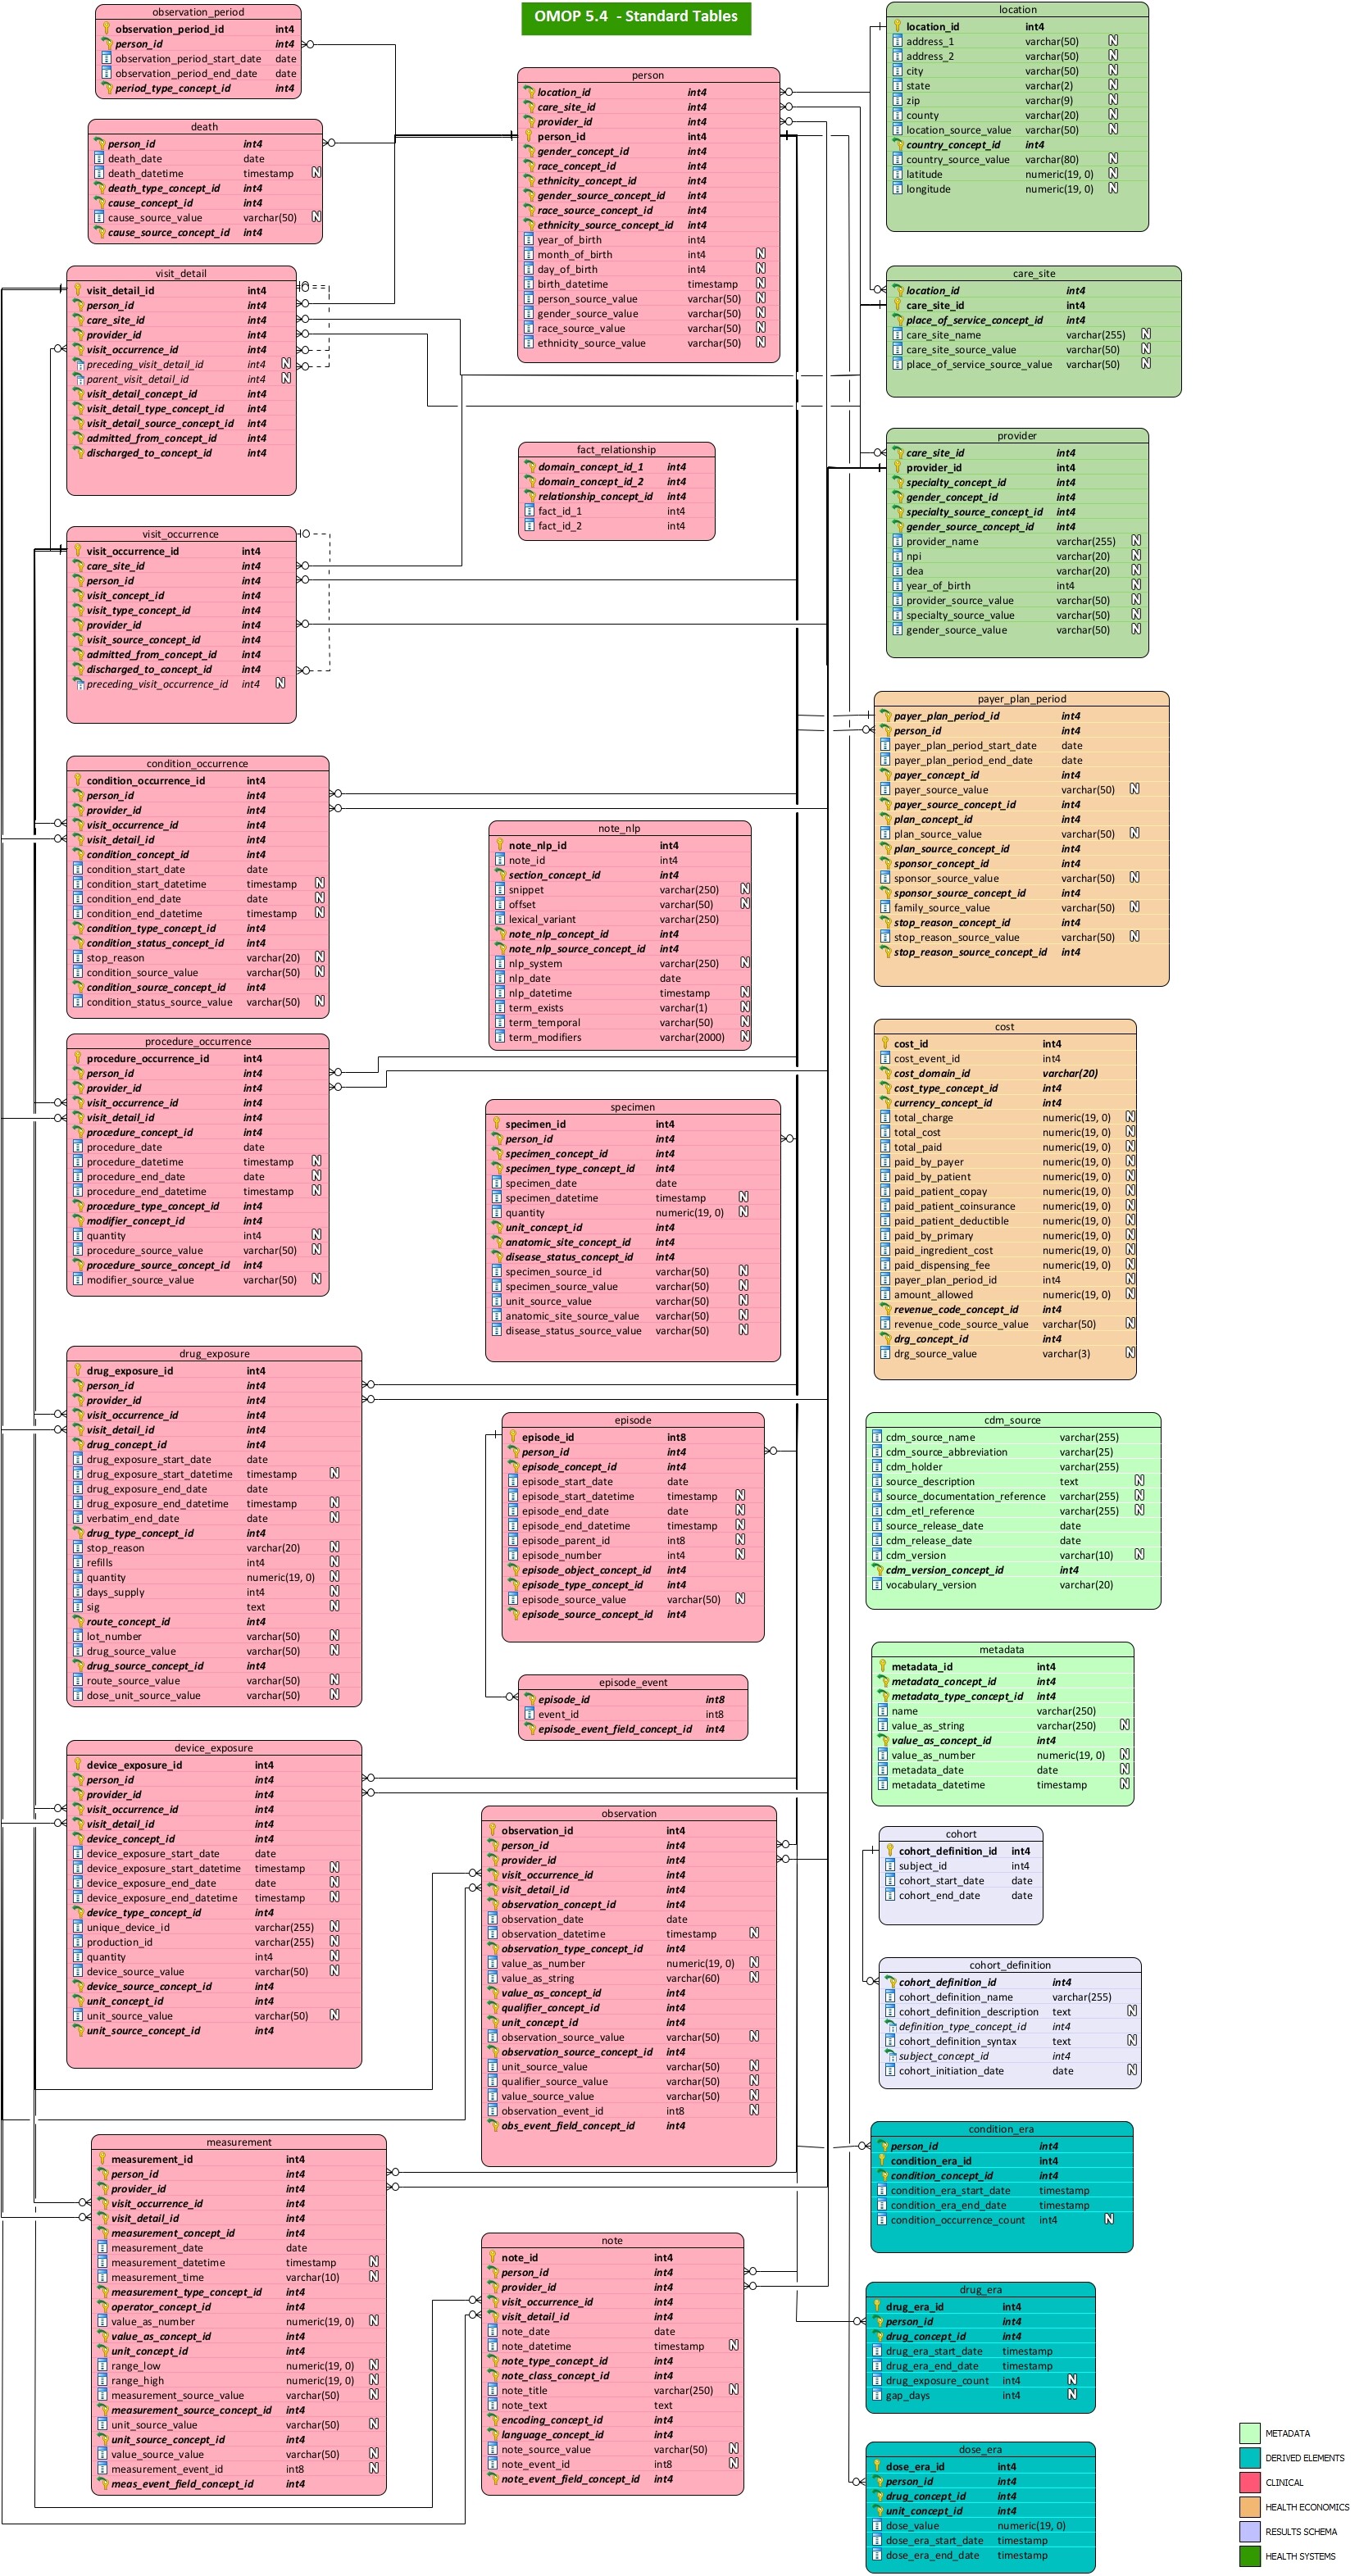
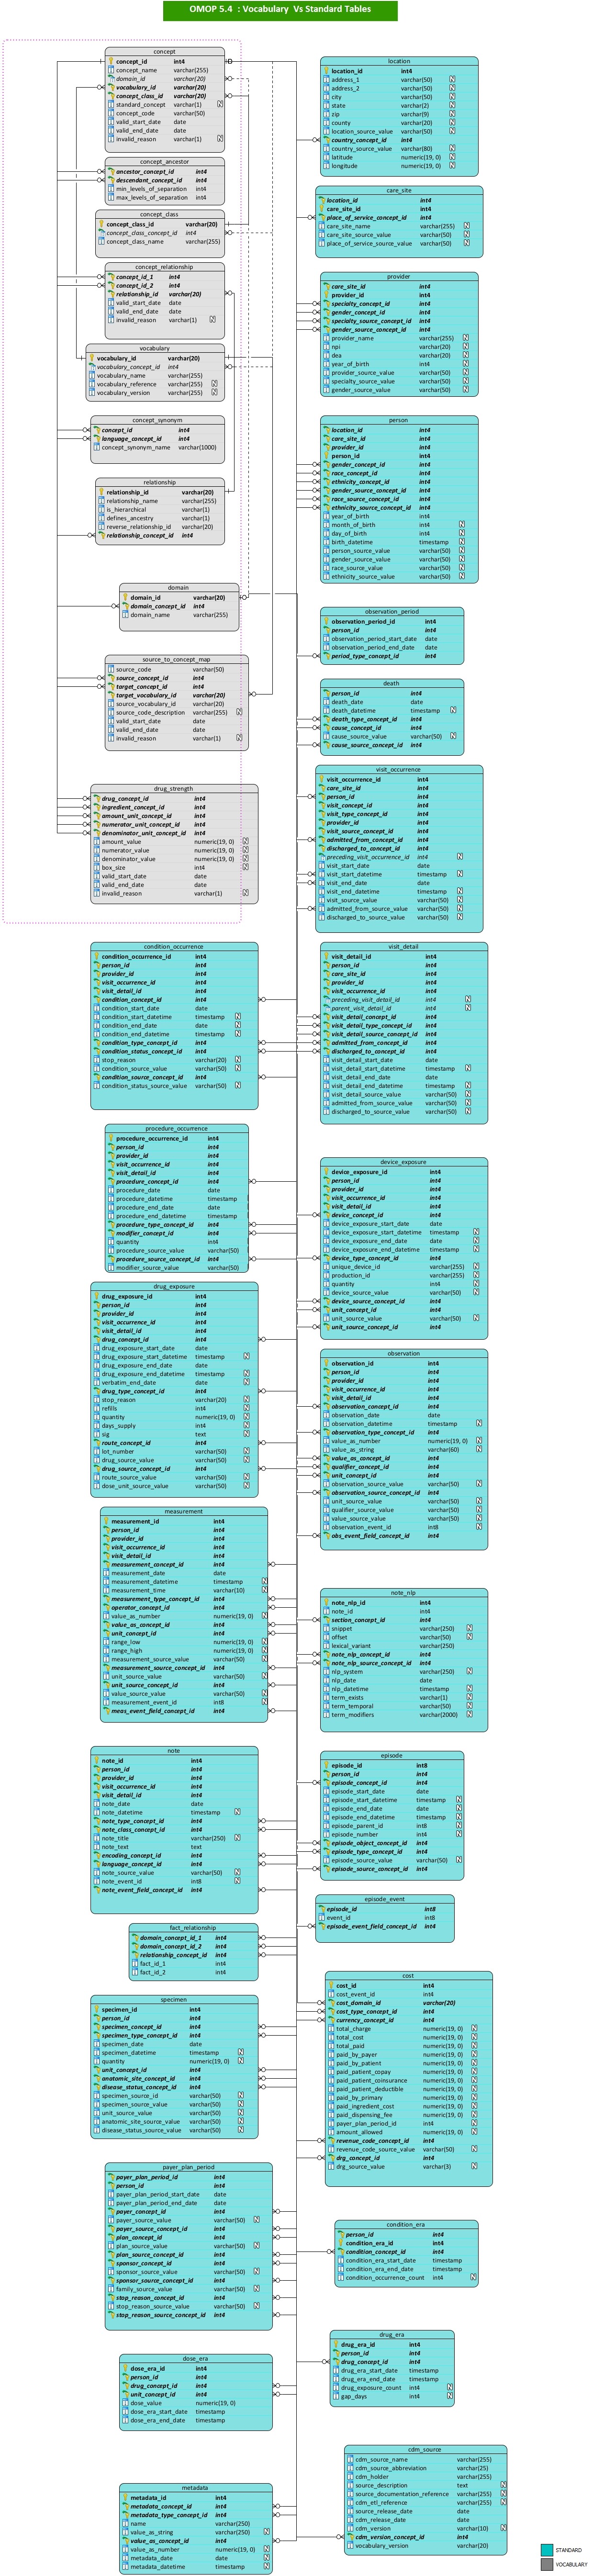
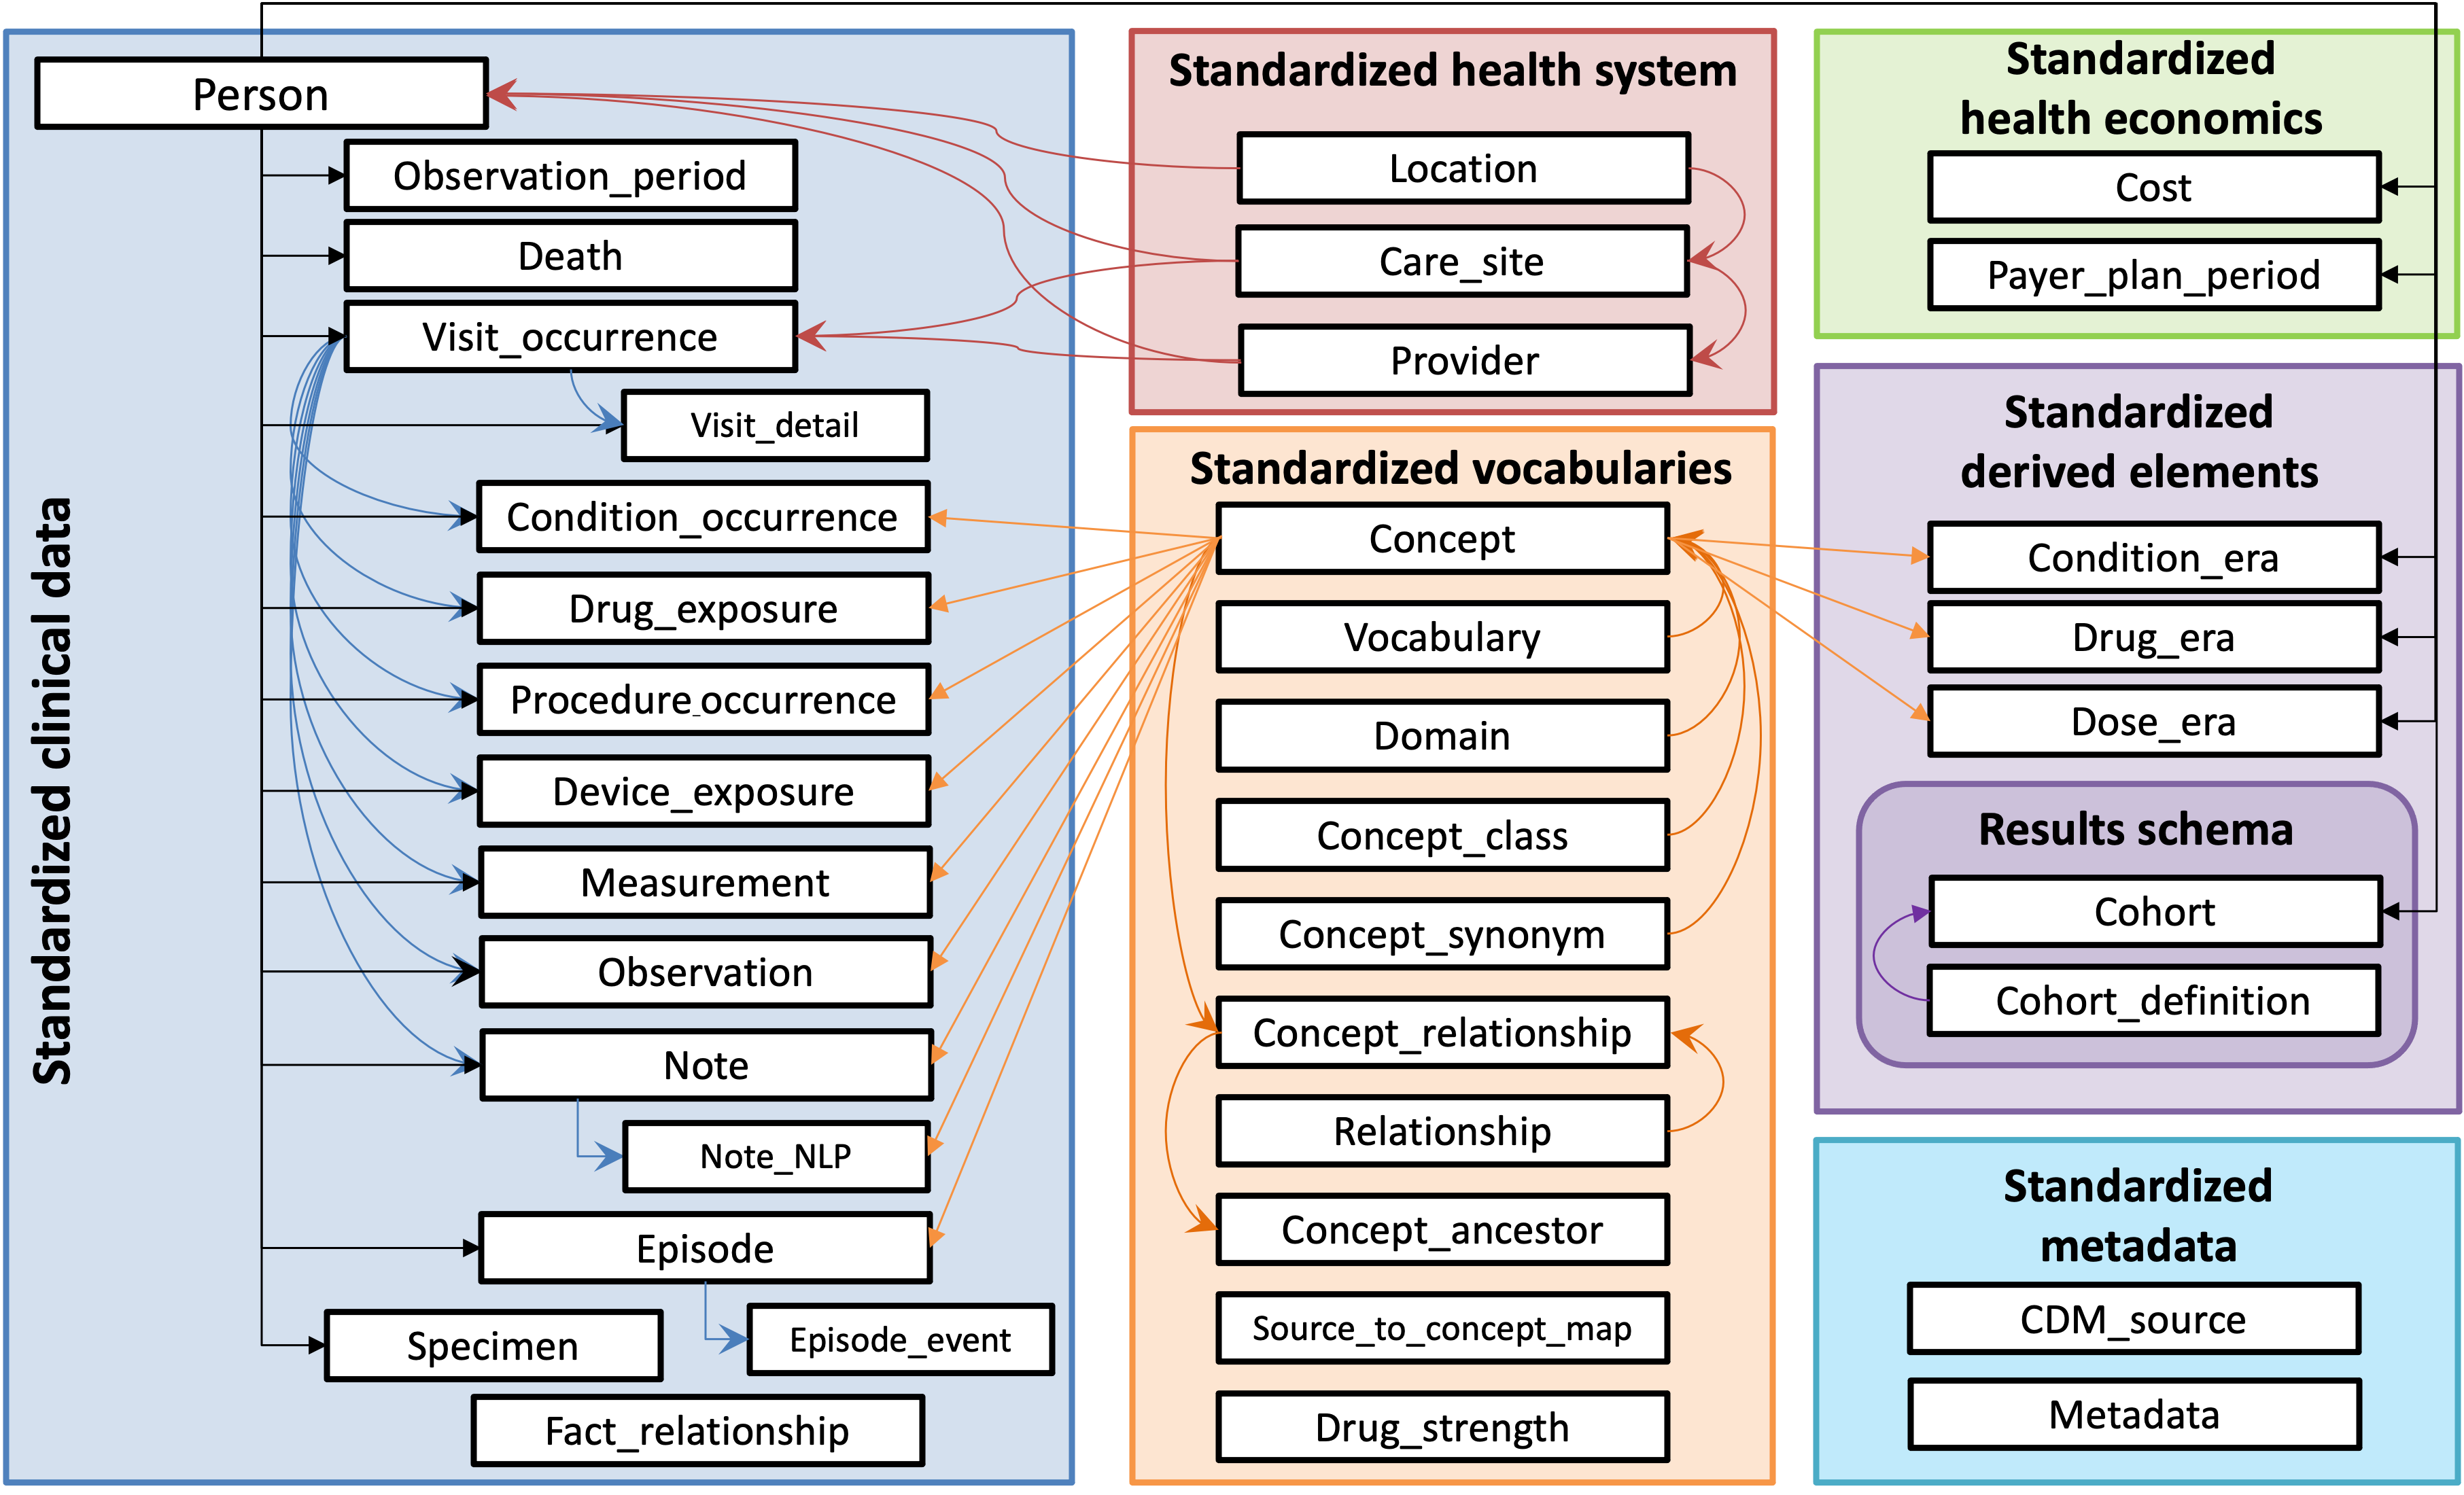
The OMOP Common Data Model v5.4 serves our community well as an open community data standard to enable standardized analytics and large-scale evidence generation. The CDM Workgroup, under the amazing leadership of @clairblacketer , has done a tremendous job of stewarding this standard, improving our documentations and conventions, and providing reference implementations, all available here at: index.knit. Our primary schematic that we use to describe the OMOP CDM is below:

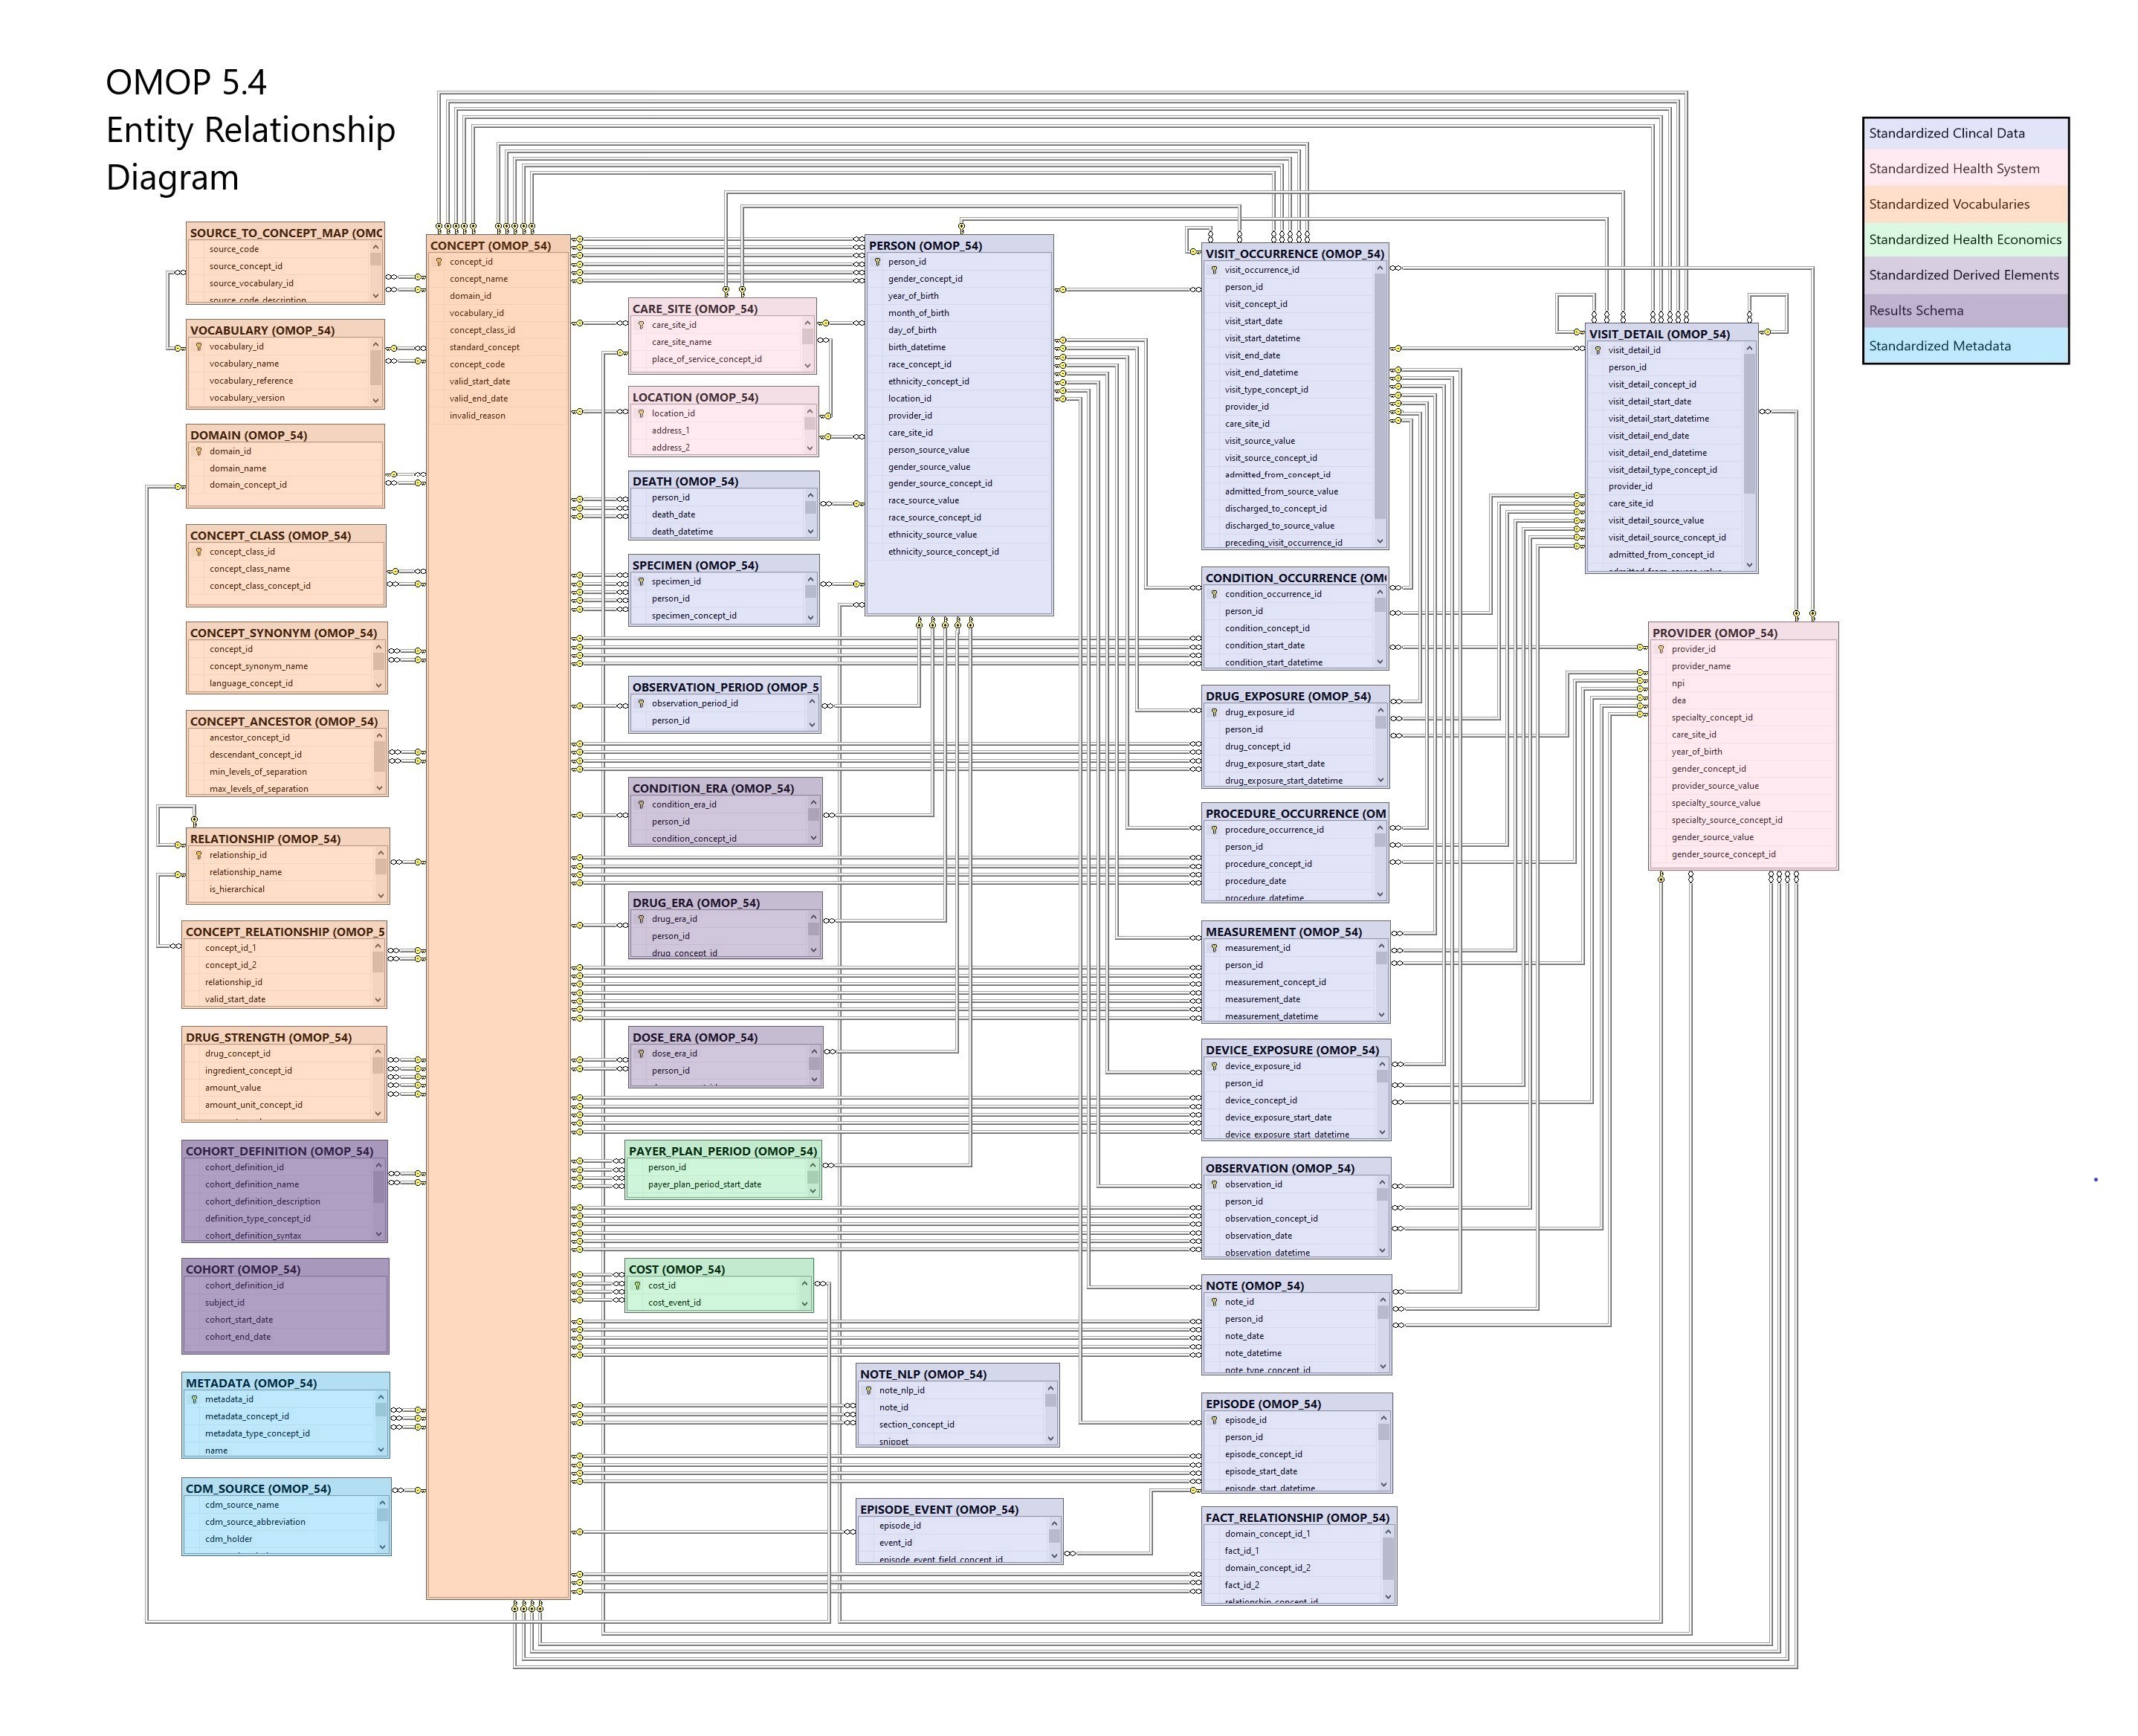
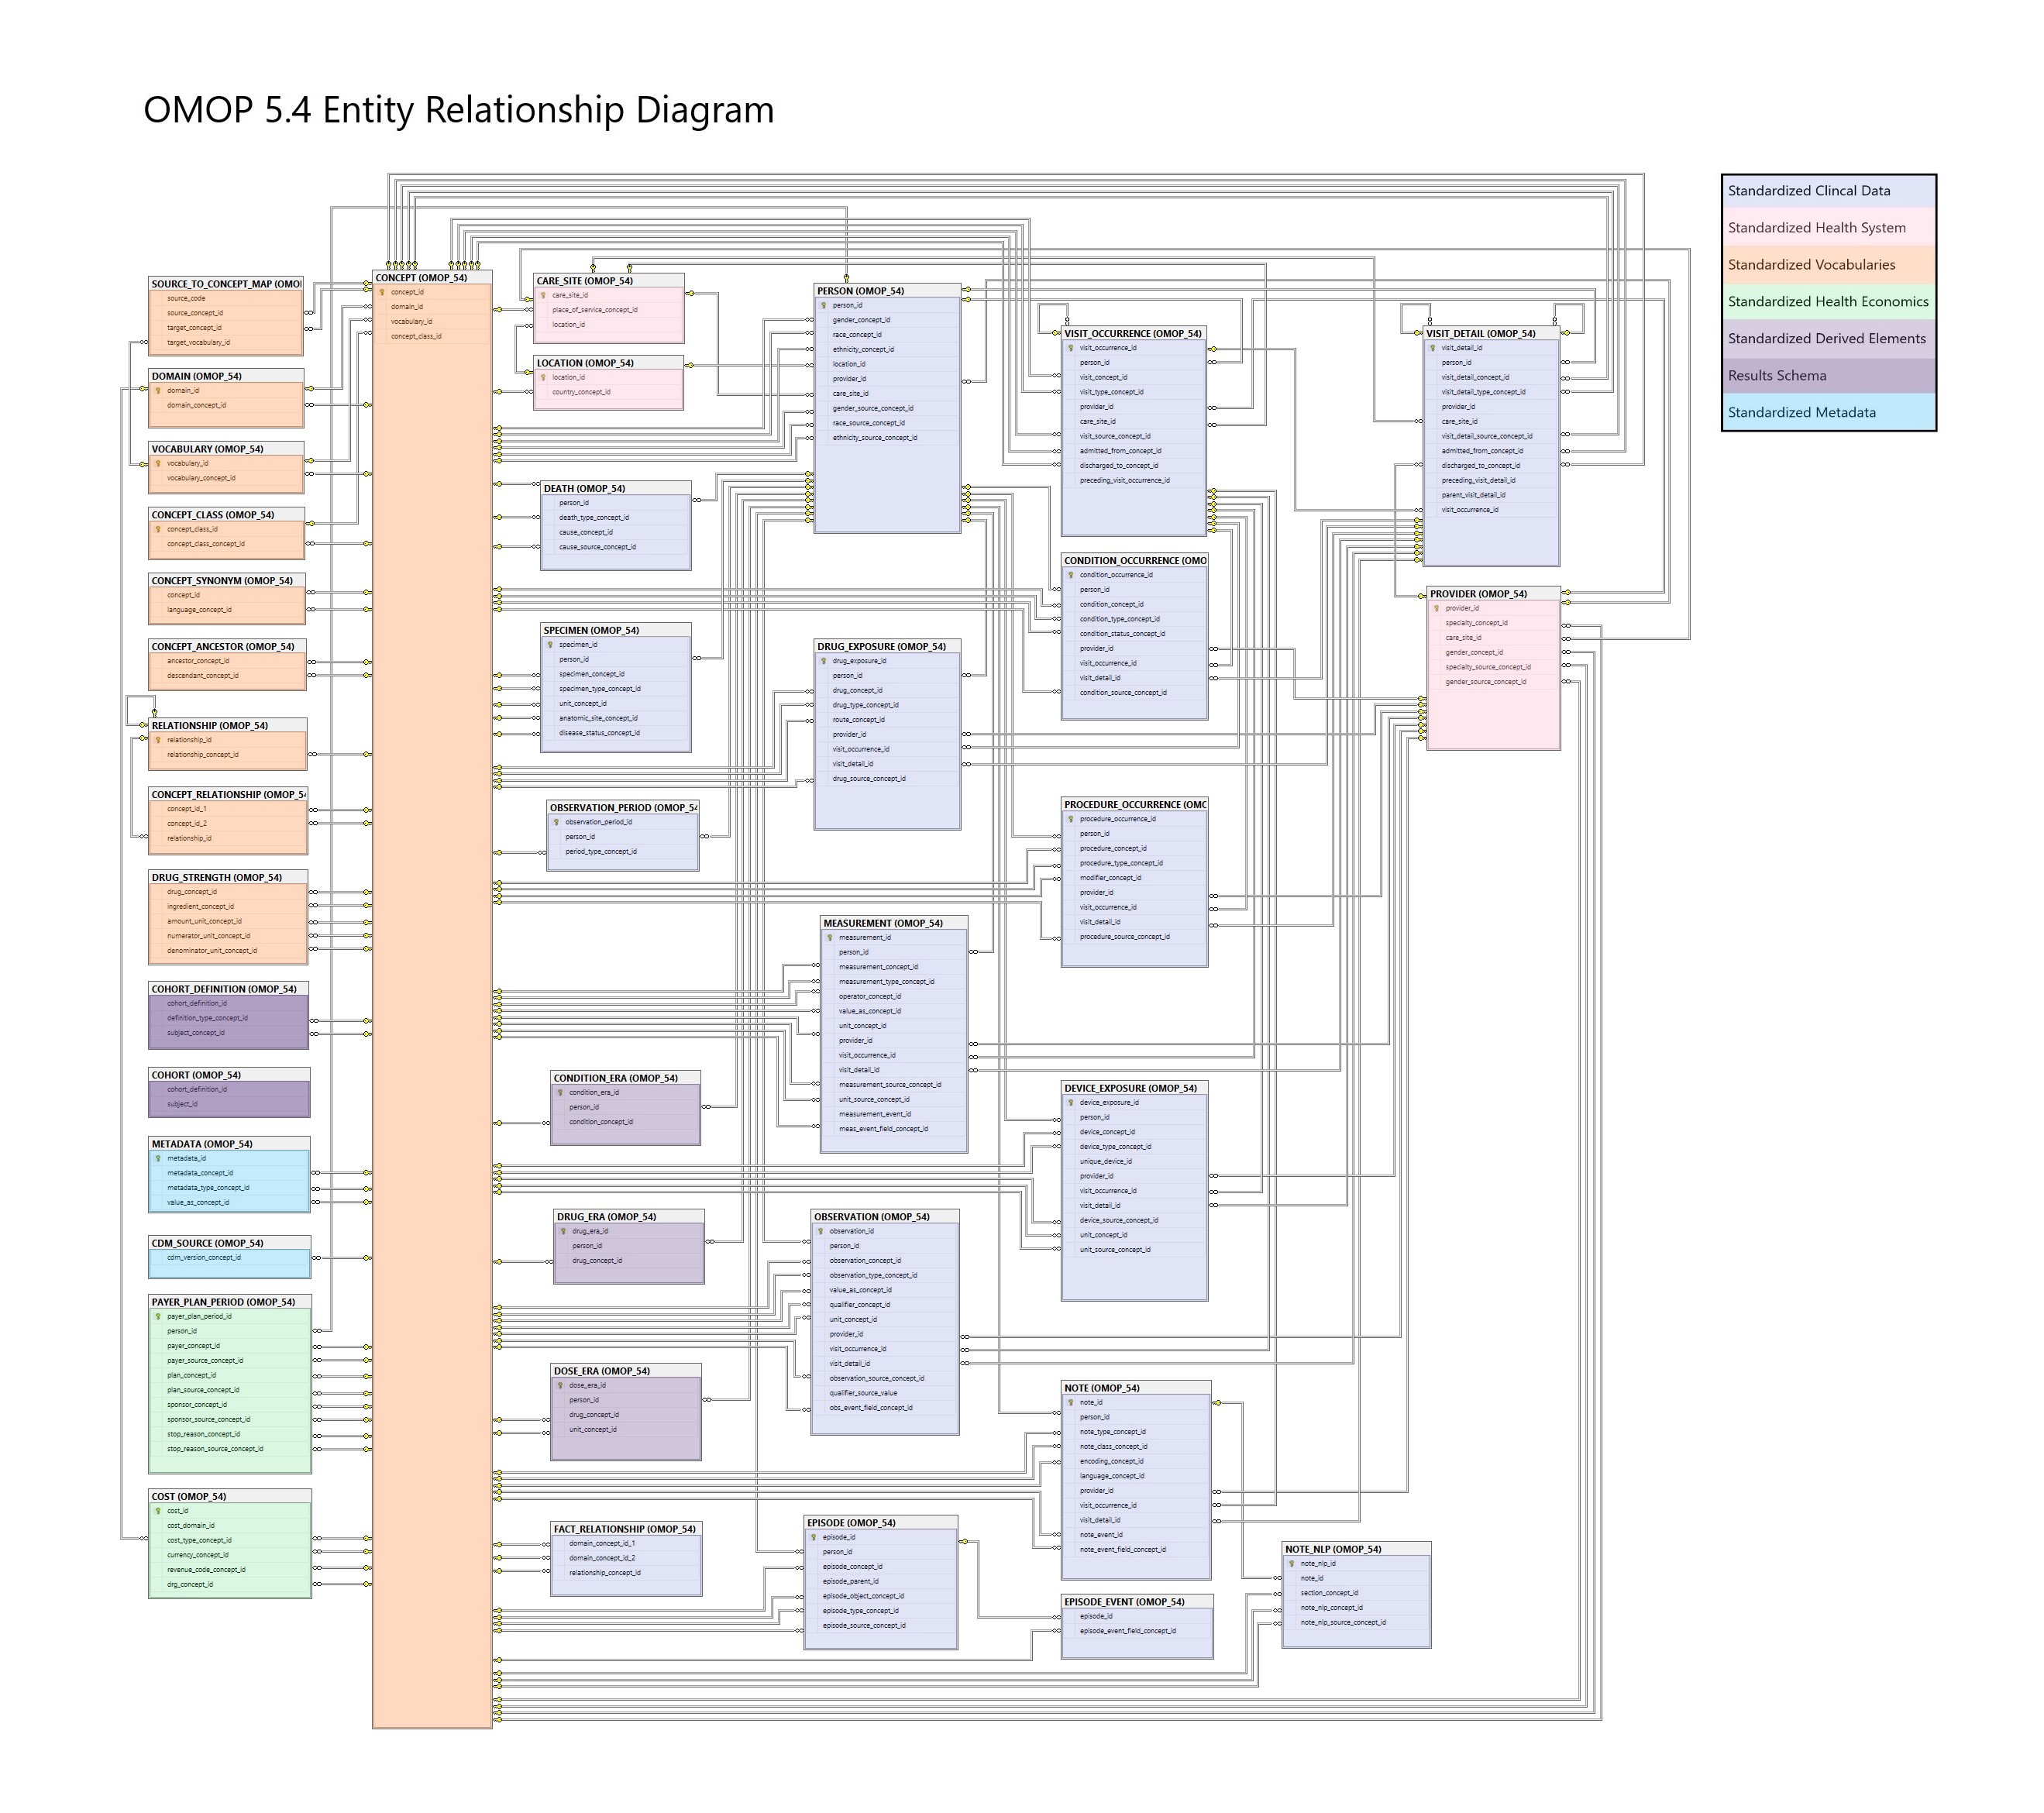
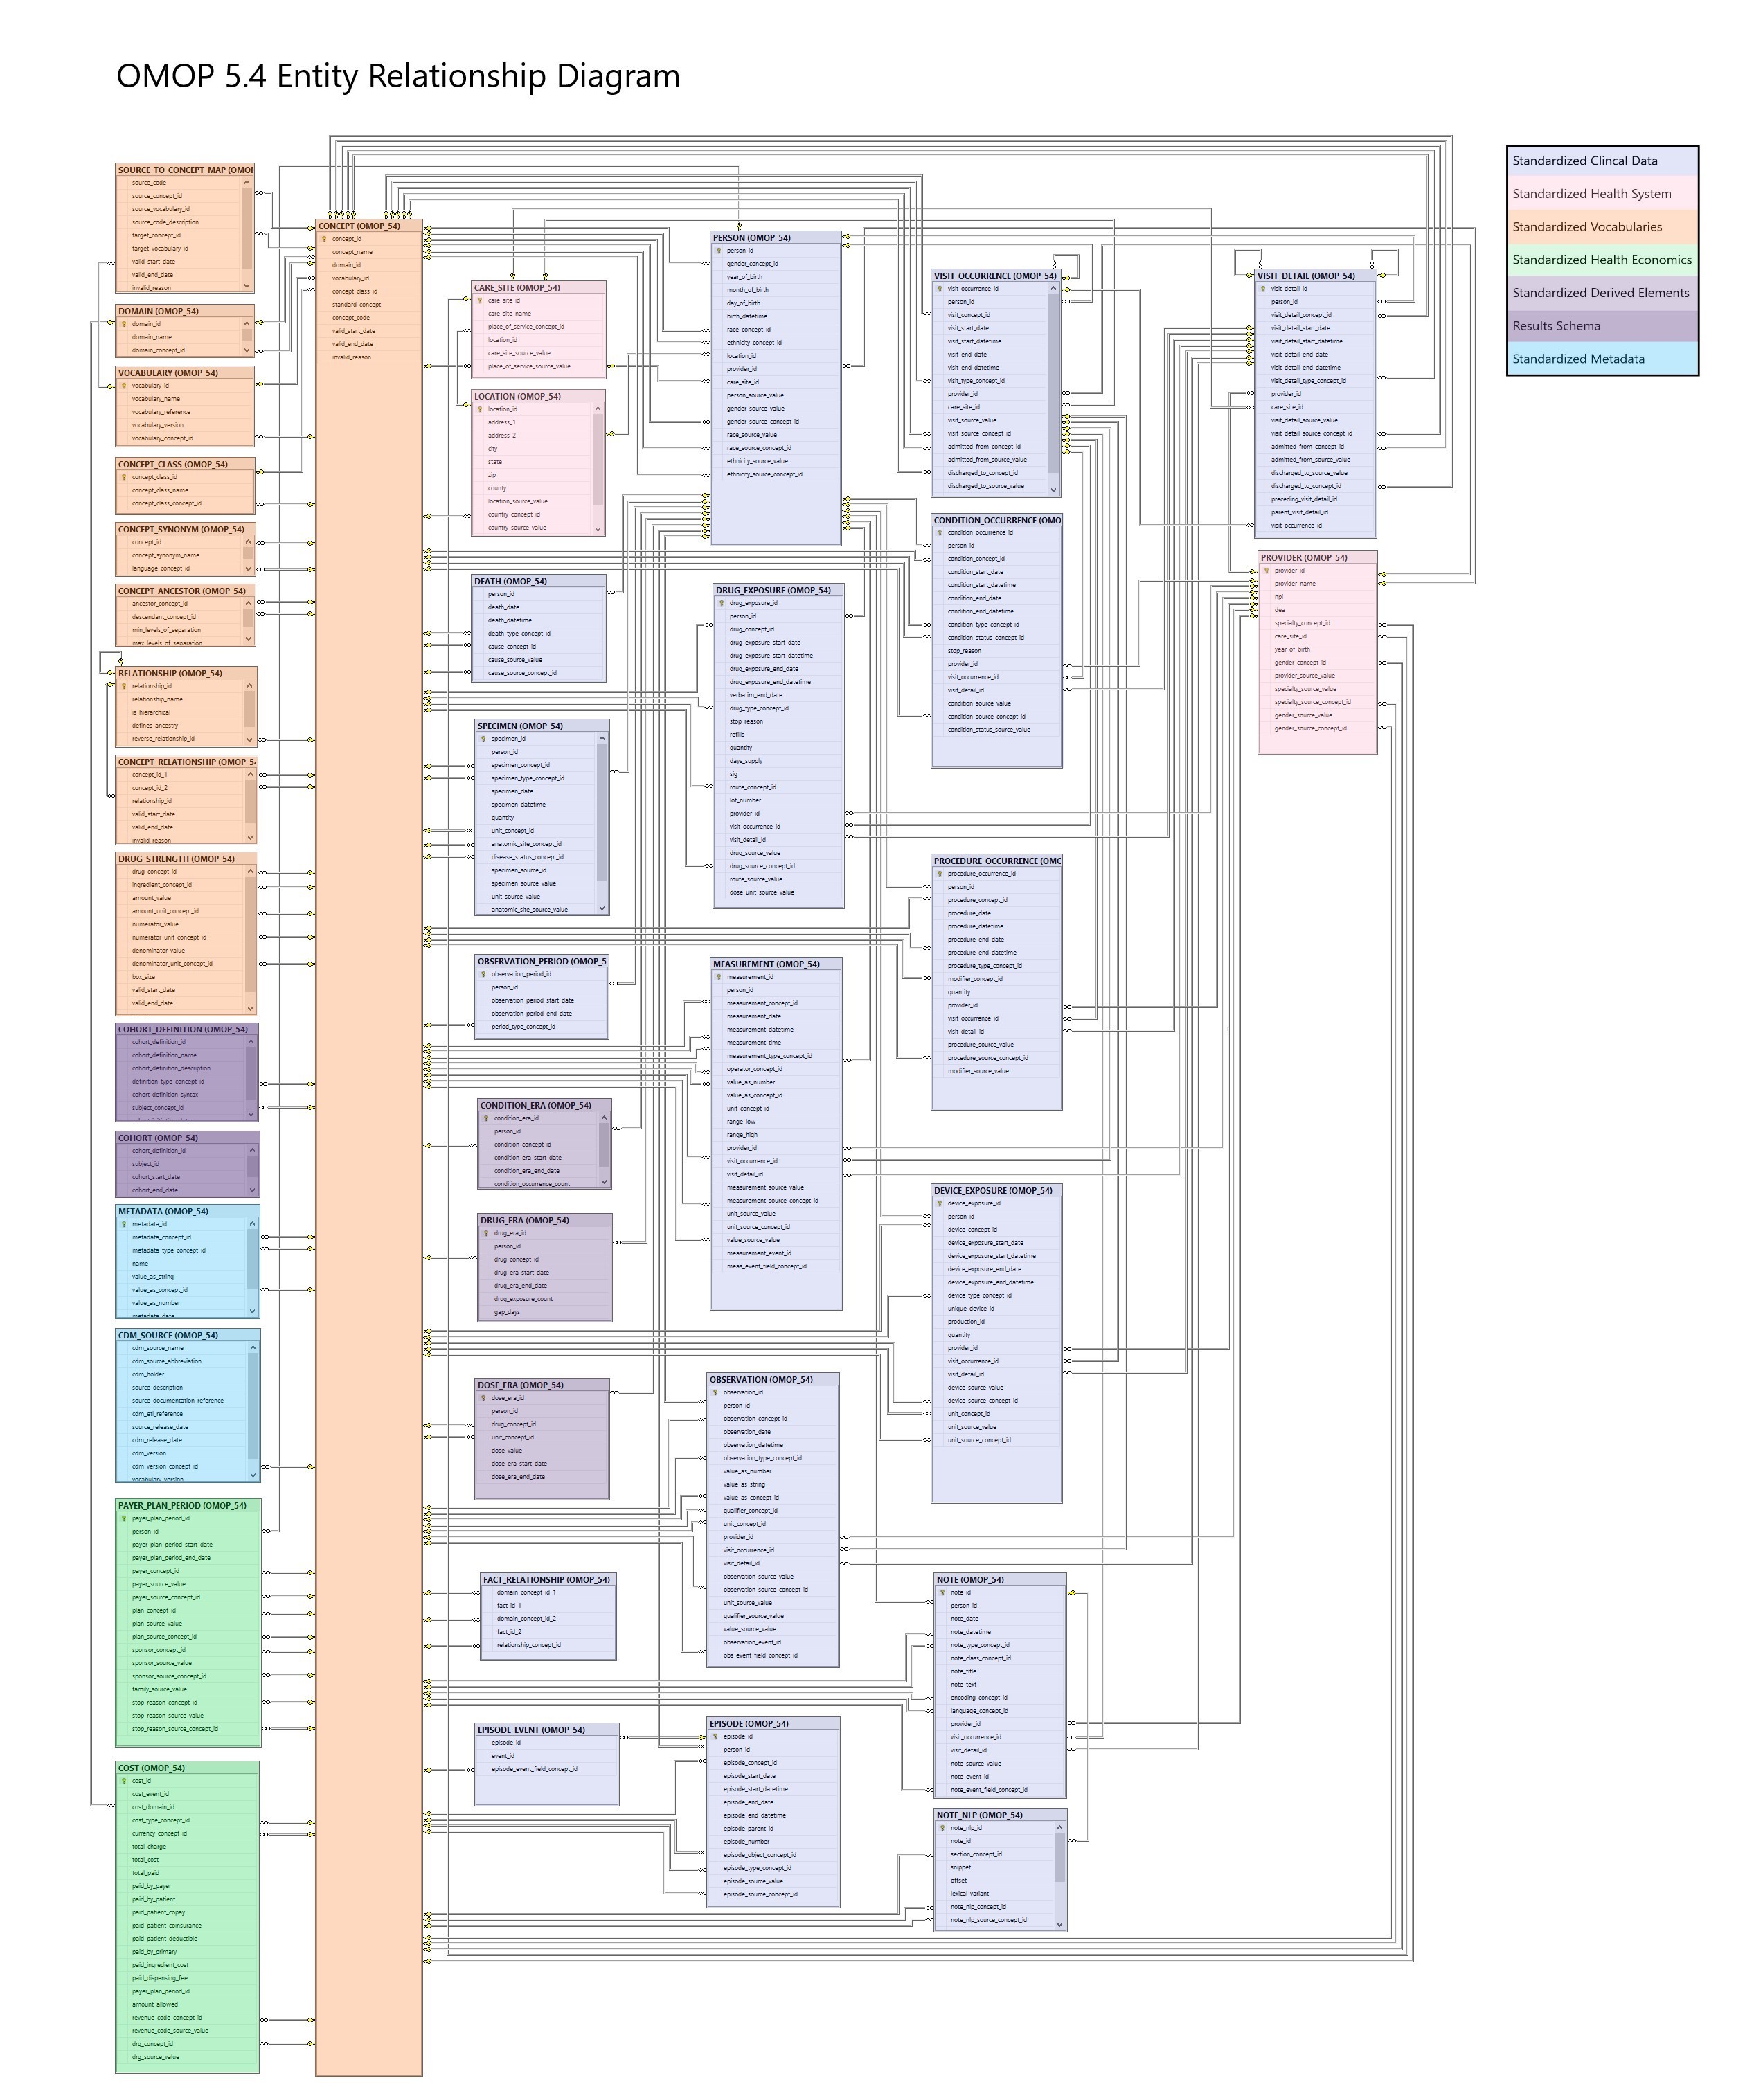
However, there’s one thing we DON’T have on our CDM Git repo, and that’s one standard entity-relationship diagram. So, if someone wants to learn about the tables, fields, data types, and PK/FK relationships, they have to read the specification one table at a time, or roll their own ER diagram after instantiating the CDM in their local environment.

Off and on, this topic has come up on the forums for discussion. For example, see these threads here and here. I’m sure that @DTorok , @MPhilofsky , @MaximMoinat , @roger.carlson @rtmill @gregk @lee_evans @cukarthik @mdewilde @Chungsoo_Kim @mvanzandt , and many others have been thinking hard on this problem in their travels through many ETLs.

@Overhage and I were chatting, and thought it would be really great if our community had one kickass ER diagram that could be printed out in large-scale (think like a 4-foot by 5-foot poster) so that someone could both take in CDM as a whole (even as a fun promotional banner) but could also ‘zoom in’ to learn about the details in a meaningful way.

Now, there are several tools (including free and open-source versions) that can create an ER diagram, I’m guessing in our community, several folks have a personal favorite, but most can get you started quite easily. A great ER diagram requires a little science and a lot of art. An ERD conveys information about the structure and content, not just by presenting the tables and fields in the database schema, but also by organizing the tables and relations in an aesthetically pleasing way so that the diagram can be easily followed and similar entities are logically arranged around each other (while also reducing the number of criss-crossing relations and avoiding entity-relationship overlaps). For example, in our cartoon schematic above, we put the PERSON table in the top left because all clinical event data flows logically from that patient, the vocabulary tables in the middle because that’s the heart of the OMOP CDM, and tried to partition out clinical tables, from health system and health economic entities, derived elements, and meta-data. This cartoon was designed to provide a readable presentation on a Powerpoint slide to give an audience of gist of the OMOP CDM. But our ERD diagram will provide a much greater level of detail, and is not bounded by the Powerpoint slide constraint. It should be able to show some/all fields in the tables, possibly data types for each field, fields that serve as keys, relations to other table/fields with cardinality, etc. There can be some artistic license taken, for example, it is probably not absolutely essential that every _CONCEPT_ID field in every table have a line to the CONCEPT table, otherwise, you’ll probably end up with an intractable spaghetti bowl:)

Instructions

We encourage any and all OHDSI collaborators to submit an entry to the OMOP CDM ERD challenge. All you have to do is create an ERD, and post the file either here on the Forums as a reply to this discussion thread or within the OHDSI Teams environment under the CDM Workgroup team (we provide this flexibility because not all filetypes can be posted here on the forums, but any file can be uploaded into MSTeams). At this point, we won’t specify a particular dimension requirement, but just require that the diagram can be viewable in some common format (e.g. can I open it as pdf and zoom in/out or pan around it).

In your post, it’d be helpful if you share how you created your ER diagram (e.g. what tools did you use?) and if applicable share the editable version so others can build off your work. We encourage people to share and borrow good ideas, and build off of each other’s submissions, but please be inclusive in attributions. Our ultimate goal is to land on one ERD that we can all benefit from as a community.

After Dec13, the submissions will be judged by a special CDM Review Committee that @clairblacketer will chair. Submissions will be reviewed for accuracy (do they correctly convey the content of OMOP CDM v5.4?) and aesthetics. The winner will be announced on the Tuesday, Dec20 OHDSI Community Call (a special gift for our holiday-themed event!).

Any further questions, just reply to this thread and I’ll be happy to answer.

Let the OMOP CDM ER Diagram Challenge Begin! :checkered_flag:

6 Likes

This is my first post here and apologies if this has been covered elsewhere. I generated an interactive ERD for OMOP CDM 5.4 which now resides at http://omop-erd.surge.sh/. Nothing particularly clever:

  1. Create an empty MSSQL OMOP CDM 5.4 database
  2. Run SchemaSpy on CDM incorporating comments from CommonDataModel/inst/csv at main · OHDSI/CommonDataModel · GitHub
  3. Publish output of 2 to Surge.sh

We are starting our OHDSI/OMOP journey at Lancashire Teaching Hospitals NHS Trust. OHDSI documentation is fabulous but we are tiny team always optimising for the laziest most efficient approach to the learning curve. SchemaSpy is significantly more powerful and can return row counts, views, etc. for a populated OMOP instance. But, this basic ERD will hopefully allow us to learn a little faster.

Next steps:

  • convert CSV comments to YAML or similar for easier version control and readability
  • option to add dataset-specific comments to the YAML for incorporation into local ERDs.
5 Likes

FROM THE OMOP CDM Channel ( Chandrabalan Vishnu (LTHTR) (Guest): OMOP CDM 5.4 Interactive Entity Relationship Dia…

posted in Workgroup - Common Data Model / General at 10 September 2022 15:54:11

1 Like

Here’s another entry to keep the ball rolling.

OMOP CDM v54 ERD - vertical.pdf (295.4 KB)

For this version, I used LucidChart on a free 7-day trial. I had never used that tool before but was quite easy to import the CDM schema specs from a postgres instance (thanks @lee_evans !, here’s the input spec in tab-delimited text format:
OMOP CDM v5.4 schema specs.txt (40.9 KB)
) and then drag and drop and organize the content.

In this version, I tried to keep the same coloring as our cartoon schematic, and tried to organize the tables to show the person, provider, visit_occurrence, and visit_detail relations into most of the clinical domain tables, and all tables having links out to the concept table. This caused me to go with a vertical layout of the domain tables, which I don’t fully love, but I found it more aesthetically pleasing than the horizontal version with lots of relation arrows running all over the place. There’s still debate on the forums about whether the EPISODE table is derived or verbatim or both, and I still haven’t seen a CDM populate this table and run analytics, so I kept it as blue but nudge over with the other derived tables to hedge my bets.

All that said, I’m quite sure that many in the community can do this much much better than I can. Happy diagraming!

1 Like

Thank you so much Patrick! This is a great challenge and I am excited to see what the community comes up with! I have heard from some collaborators in the past requesting an ERD so I know this will be a well-used resource. I know @DMStep and @stephanieshong will certainly be interested, among others. Please don’t hesitate to throw your hat in the ring, hopefully our resident artists like @sseager will also contribute :star_struck:

2 Likes

For the less technical folks in OHDSI, I want to share a favorite “OHDSI-ism” I recall from the 2017 F2F Meeting at Georgia Tech.

As @nigehughes would say, “gather round, children…”

At that 2017 F2F, when going around the table during an initial icebreaking session, someone prompted the group, “what is your tool of choice?” People went around saying things like, R or SQL. @gregk, not missing a beat, proudly told the room, “PowerPoint.” :wink:

I still laugh about this because, at the time, I was a management consultant and my technical chops weren’t anywhere close to what they are now – which is, proudly, a full-blown pretengineer status.

I’ll throw my hat in the ring to commit to an entry! Let the games begin!!

1 Like

To keep things going, hereby my work in progress. The general idea that I want to work out further in the coming week: make the diagram person-centric. Person table in the centre. A first layer with the visit tables, observation_period and death. The main clinical event tables are in a layer around that. Then a layer with the era tables and the health system tables.
OMOP CDM - Person centric.pdf (169.0 KB)

A next layer would be health economics. The vocabulary tables would be the last layer. I have not worked out yet how to integrate that without creating a mess of relationships.

The tool dbdiagram.io - Database Relationship Diagrams Design Tool lets you create simple diagrams for free. It works directly from the browser and you do not need to create an account before you can start using.

I imported the PostgreSQL DDL for CDM v5.4, this is the result:

It’s not sophisticated, but here’s my point: if someone with less technical ability would like to just reorganize a diagram, with the mouse, to sketch an even better way to dispose the CDM tables and their connecting lines, this tool would be ideal. Just copy-paste the definitions from the link above into your own new diagram inside the tool. It’s also possible to grant editing privileges to others when sharing a diagram.

I’ve got three entries.

OMOP 5.4 ERD compact
OMOP 5.4 ERD Compact.pdf (1007.1 KB)
This shows the tables, primary keys, and the relationships, but not the foreign keys.

OMOP 5.4 ERD Standard
OMOP 5.4 ERD Standard.pdf (1007.1 KB)
Which adds the foreign keys.

OMOP 5.4 ERD Extended
OMOP 5.4 ERD Extended.pdf (1.0 MB)
Which shows all of the fields in the tables as well.

The more detail there is, the larger the diagram. I’m partial to the Standard version.

2 Likes

So @schuemie and myself partnered up for a little powerpoint party.
Hope it brings as much fun to the community as we had making it :slight_smile:

(The ppt file will be uploaded to the Teams site, as I’m not allowed to upload it here.)

CDM54_SchuemieLos.pdf (218.2 KB)

2 Likes

awesome thanks @RenskeLos and @schuemie , I love the coloring of the relationship lines, that makes it much clearer than my version about where the line comes from. and thanks for the ppt version, that should make it very easy for anyone else in the community to build on your version without needing any technical tools.

@roger.carlson , thanks for these. That’s a clever use of extending the CONCEPT table so that you could have cleaner lines between the tables, since most other tables have one or more links into the vocabulary. Great stuff!

Impressed by the submissions so far!

Hereby my submission, going for a programmers approach. Last year, I discovered the Mermaid syntax with which you can easily render diagrams within markdown documents. This is now also supported by Github for comments and markdown files.

I have created a simple script that takes the CDM definition from the CommonDataModel repository and puts this in mermaid syntax. Unfortunately, mermaid currently does not allow any customisation (not even colouring). So this submission is not for printing, but to use on Github. You can copy the syntax for specific tables, put it in mermaid code highlighting, and it will render the ER diagram.

See this PR for a few examples rendered by Github and the R code used to generate the diagrams: https://github.com/OHDSI/CommonDataModel/pull/540

Full diagram (following the link will render the diagram).

2 Likes

Hi OHDSI Friends, Hope you all are doing great…! my name is Thanuj Shiva Kumar (Sr.Big Data Engineer) from Odysseus Data Services Inc. I always wanted to contribute something towards OHDSI but haven’t really had a chance. Thank you @gregk for supporting me to take up this challenge to explore and contribute towards this great Initiative hosted by OHDSI @Patrick_Ryan and Team. So here is my first post and first submission. :blush:. I am all ears to your feedback and thoughts

ER Link :- https://omop.odysseusinc.com/

Tools used :-

Visual Paradigm 17.0 (Standard Edition) & Google Chrome Web Browser

Features :-

  • Web based Portal supports by most of the Web Browsers
  • HTML support (this can be hosted as a website on any DNS on the internet)
  • Interactive style report – Supports Interaction with the ER objects on the Website
  • Navigation Panel - Enables to traverse through Entities and their descriptions, Relationships, constraints, Models and Diagrams on the Website.
  • Supports Reverse Engineering and DDL Generation ( DDl’s can be reversed to Diagrams and vice versa)
  • Color Legends- ( Helps in categorizing the type of the OMOP Specified Objects )
  • Downloadable formats supported:- SVG,JPG,PNG,TIFF,EPS,EMF, PDF(Diagram per page), PDF (Diagram per file)

ER Model Generation Information :-

  • OMOP Version DDL’s used :- 5.4
  • Database Type Used:- PostgreSQL
  • ER Model Built Type:- Physical Model

OMOP Specification Objects :-

  • Clinical Data Tables
  • Health System Data Tables
  • Health Economics Data Tables
  • Standardized Derived Elements
  • Metadata Tables
  • Vocabulary Tables

ER Objects:

  • Entities
  • Attributes
  • Data Types
  • Constraints
  • Relationships
  • Cardinality ( Crow Foot Notation)

References:

  • Descriptions for Each Field , Entities and Relationships
  • Links to Athena and OHDSI

Recommended Future Improvements :-

  • Color coding for the Entities should be muted
  • Some fields need to be adjusted/ added
  • Sort all attributes based on their type in Entities
  • Padding of diagram as the connectors on the left is nearly towards the navigation pane

Downloadable Formats :- (Jpeg)

Standard_Tables :-

Vocabulary_Tables :-

Vocabulary_With_Standard_Tables :-

Thanks,
Thanuj Shiva Kumar

6 Likes

just to add to TJ’s (@ThanujShivaKumar ) post…

What I like about a solution that TJ posted:

  • the end result is web-based, allows someone to easily explore the model and do a drill down for each element.
  • we can add any numbers of sub-views
  • all elements are annotated, including a descriptions as well as constraints for all key elements
  • color coding makes it easy to group elements by domains, similar to our classic logical CDM

Some other thoughts to share:

  • ERDs are platform specific. All database platforms do share share some elements (tables, columns) but could differ quite a bit in types, logical to ER implementation, presence or lack of certain elements, indexes, constrains etc… (RDBMS vs. MPP is a great example). Are we really looking to have separate ERDs for all supported dialects / databases? Could we all agree on the purpose of us publishing the ER diagram (s)?
  • there is a quite old standard published by OMG called Model Driven Architecture (MDA - Model Driven Architecture (MDA) | Object Management Group). It really didn’t take off at scale but there are some really attractive ideas that it put forward, including the idea that the Platform Specific Models (PSM) - including Class Diagrams, ERDs etc…- as well as Code can be automatically generated using platform specific transformations (software components that consume and model and spit out an output model/code). Maybe we should think about that approach? Funny enough, this idea has somewhat been already implemented when we generate DDLs via code.
3 Likes

Thanks @ThanujShivaKumar and @gregk , I agree its nice to have a web-based solution. Greg makes a good point, within OHDSI we try to support multiple RDMBS platforms. Our ERDs show table names, field names, and relationships, which should all be platform agnostic. The datatypes can be platform-specific, I wonder if there’s a way to display that in our figure to note where the graphic varies by target RDBMS (I’m not exactly sure what all of those are: BIGINT vs. INT4?). The other point is about indexes and constraints, though I dont think any ERDs are currently display this information.

1 Like

actually, you can see all those details in the ERD we generated - FK, PK and constraints.
https://omop.odysseusinc.com/content/DBForeignKey_qFo88yGGAqHiCC1G.html

1 Like

Hi @Patrick_Ryan , Below is the notation where you can easily identify PK, FK and constraints by looking at the objects, in future we can also add a legend for the below representation.

  • The :key: Key icon beside the Table column Field indicates Primary key.
  • The Outward Green arrow to any Table field indicates Foreign Key.
  • The Key with outward Green arrow indicates Primary Key and Foreign Key.
  • The ‘N’ in the table fields indicates ‘Nulls are Allowed’

The better and stable option is to drill down by just clicking on any table on the website and it directs to its respective table page where PK,FK and constraints and other details are provided as @gregk posted.

1 Like

Question: Do these ER diagrams document the “logical” (database-agnostic) or “physical” (database-specific) model?
If they are ‘physical’ then don’t we need a different one for each database system?


https://online.visual-paradigm.com/knowledge/visual-modeling/conceptual-vs-logical-vs-physical-data-model

They are logical, not physical. If you want physical, go to the CDM and grab the DBMS implementation of your choice to do a diagram of, although, even there, the full physical model is not complete.

t