Video uploaded to https://youtu.be/9Ui-ivff640
MS teams link OHDSI tenant 20251001_third_meeting
Introducing the CostUtilization Package.pdf (239.1 KB)
The OHDSI Health Economics & Value Assessment (HEVA) workgroup introduced the alpha release of the CostUtilization R package, a tool designed to standardize health economic analysis across the network. The presentation detailed the package’s vision to resolve methodological opacity and integrate economic outcomes into standard HADES pipelines. Lead developer Alexander Aleksiayuk @alexanderalexeyuk demonstrated its visit-centric architecture, HADES-conformant structure, and advanced capabilities like micro-costing. The primary blockers to a full release are the pending community adoption of the OMOP CDM v5.5 and finalization of Themis data conventions . The workgroup made an urgent call for community partners to validate the package with real-world data.
Topics
- Workgroup Relaunch and Objectives
- Challenges and Vision for Standardized Analysis
CostUtilization Package: Architecture and Design- Core Functionality and Analytical Workflow
- Advanced Use Cases: Micro-Costing and Unit Cost Analysis
- Testing Framework, Dependencies, and Path Forward
- Conclusion and Call for Collaboration
Detailed Topic Analysis
1. Workgroup Relaunch and Objectives
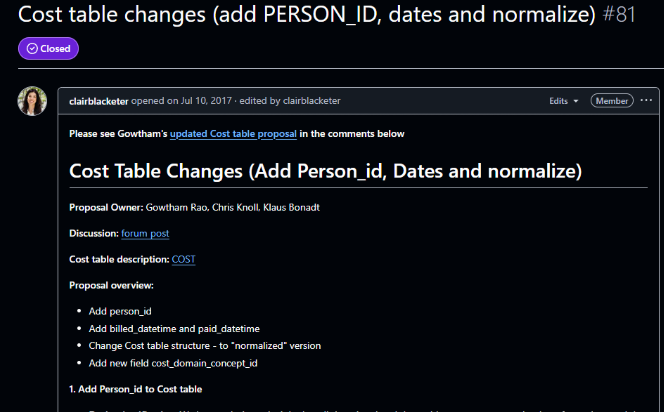
Gowtham Rao @Gowtham_Rao opened the meeting by reintroducing the Health Economics & Value Assessment (HEVA) Workgroup, which has been restarted after a five-year hiatus. He explained that the group aims to better support the Health Economics and Outcomes Research (HEOR) community, which has historically been underserved within OHDSI. The workgroup has consolidated efforts from 2017-2018 related to data standardization, ETL conventions, and vocabulary to tackle the third pillar of the OHDSI mission: standardized software. @Gowtham_Rao positioned the day’s topic, the new CostUtilization R package, as a key milestone in achieving this goal. The meeting also served as a welcome for new members, including Grace Lomax, a recent discoverer of OHDSI; Saba Sohail, a PhD student at Johnson & Johnson interested in health economics; and Shishir Shakya, an assistant professor of economics. @Gowtham_Rao emphasized the collaborative nature of the community, stating, "you’re right in front and center. No corners in the OHDSI. Everybody is equal."
- Risks / Implications: The success of the relaunched workgroup depends on sustained community engagement and the ability to convert past groundwork into tangible, adopted tools.
2. Challenges and Vision for Standardized Analysis
@alexanderalexeyuk began his presentation by outlining the primary challenges that necessitate a standardized tool for health economic analysis in OHDSI. He pointed to three core issues: methodological opacity, where studies rely on ad-hoc SQL that hinders reproducibility; semantic ambiguity from inconsistent definitions of terms like “cost,” “charge,” and “payment”; and an integration gap that prevents economic outcomes from being used in standard OHDSI packages like PatientLevelPrediction and CohortMethod. The vision for the CostUtilization package is to address these weaknesses by enabling “actuarial-quality” economic analysis at scale. The goal is to provide a HADES-conformant tool that transforms health economics “from a siloed activity into a standard component of OHDSI evidence generation.”
- Risks / Implications: The package’s vision is ambitious and relies on the community agreeing to and implementing new data standards, which has historically been a slow process.
3. CostUtilization Package: Architecture and Design
@alexanderalexeyuk described the technical architecture of the CostUtilization package, emphasizing its adherence to HADES standards. The package is structured with user-facing R functions and a core analytical engine driven by a large, parameterized SQL script located in the inst/sql/ directory. A key design decision was to develop it as a standalone package rather than integrating it directly into FeatureExtraction. @alexanderalexeyuk explained this was necessary because FeatureExtraction uses “hyper-parameterized” SQL for many simple clinical features, whereas the new package requires a more “monolithic, ‘opinionated’ SQL optimized for the complexities of the normalized COST table.” To ensure seamless integration with the broader OHDSI ecosystem, the package is designed so its output can be formatted as a standard covariateData object, making it compatible with downstream analytical tools like CohortMethod and PatientLevelPrediction.
- Risks / Implications: The standalone nature of the package, while technically necessary, may create an additional step for analysts. The success of its integration strategy hinges on the ability to perfectly mimic the
covariateData object structure.
4. Core Functionality and Analytical Workflow
The package’s analytical framework is strictly visit-centric, meaning all costs must be anchored to a clinical encounter (visit_occurrence_id) to be considered interpretable. The workflow begins with defining a cohort, after which the package calculates person-time at risk (the denominator) by carefully censoring time based on the OBSERVATION_PERIOD table. Alexander highlighted this as a crucial improvement over FeatureExtraction, which he noted “never care about observation period,” potentially creating a “huge bias” if a patient’s observation window is shorter than the analysis window. The package then identifies relevant encounters and links them to the COST table to calculate the numerator, allowing for standardized rates like cost per-member-per-month (PMPM). In response to a question from @ramvarma about enrollment, @Gowtham_Rao clarified that the denominator is calculated dynamically by constraining the analysis window (e.g., one year from cohort start date) to each patient’s observation period, ensuring accuracy.
- Risks / Implications: The strict visit-centric approach means that any cost data not properly linked to a visit in the source CDM will be excluded, potentially undercounting total costs if ETL quality is poor.
5. Advanced Use Cases: Micro-Costing and Unit Cost Analysis
Alexander detailed the package’s capability for advanced analyses, specifically “micro-costing,” which aims to isolate the line-item cost of a specific intervention (e.g., a chemotherapy drug) rather than the cost of the entire visit. This functionality is essential for detailed economic evaluations like Health Technology Assessments (HTA). However, this feature comes with significant prerequisites: the source data must have the VISIT_DETAIL table populated, and costs must be attributed at the line level using visit_detail_id. The analytical logic shifts from VISIT_OCCURRENCE to VISIT_DETAIL, requiring a more granular data structure than many CDMs currently possess. Following up on this, @ramvarma inquired about calculating unit cost versus utilization to understand cost drivers. @Gowtham_Rao confirmed this is part of the micro-costing roadmap, explaining that by generating both utilization counts and PMPM, analysts could infer whether cost increases are driven by price or volume.
- Risks / Implications: The micro-costing feature is entirely dependent on the availability of high-quality, granular
VISIT_DETAIL data, which is not yet common across the OHDSI network. Without this data, a key use case for HTA cannot be realized.
6. Testing Framework, Dependencies, and Path Forward
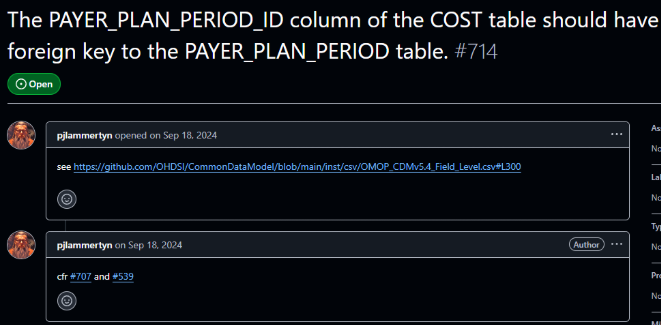
A significant challenge for the package is the lack of a standardized OHDSI test dataset that includes cost data or conforms to the proposed CDM v5.5. To overcome this, the team developed an innovative testing framework that “dynamically generates a compliant test environment.” The test suite programmatically creates the necessary COST table structure within the Eunomia dataset, synthesizes and injects linked cost data, and then executes unit tests. Despite this progress, the package’s adoption is blocked by two critical external dependencies: the formal approval and adoption of the OMOP CDM v5.5 normalized COST table structure, and the finalization of Themis conventions for standardizing the semantic meaning of cost data. @shishirshakya question about installation difficulties highlighted its alpha status, with Gowtham explaining it must be installed from a specific development branch.
- Risks / Implications: The package’s utility is currently theoretical. Without community-wide adoption of CDM v5.5 and Themis, the tool cannot be validated on real-world data or promoted for general use. This makes finding early adopter partners critical.
7. Conclusion and Call for Collaboration
@Gowtham_Rao concluded the meeting by summarizing the workgroup’s rapid progress in re-establishing itself and producing the alpha release of the CostUtilization package, calling it a “very high bar” that the team successfully met before the upcoming OHDSI Global Symposium. He congratulated @gdravida09 and @alexanderalexeyuk for their work. The final message was a strong call to action for the community. @ramvarma offered to explore using real-world data from sources like HealthVerity and Optum, which @Gowtham_Rao welcomed enthusiastically, noting that the CDM Workgroup needs to see real use cases to accelerate the standardization process. He urged attendees of the symposium to meet and discuss the project further, aiming to build partnerships for testing and validation.
- Risks / Implications: The momentum generated by this alpha release could be lost if the workgroup cannot secure partners for real-world data validation in the near future. The OHDSI symposium represents a key opportunity to build these crucial collaborations.
Q&A Session
Question (@ramvarma ): Are you also looking at unit cost metrics? For instance, when PMPM costs increase, it can be driven by either higher utilization of a service or an increase in the unit cost of that service. Is the package able to distinguish between those drivers?
Answer (@Gowtham_Rao ): Yes, that capability is part of the micro-costing roadmap. The package is designed to calculate both utilization counts and PMPM costs. By trending both metrics, an analyst could infer the driver; for example, if utilization counts remain stable while the PMPM goes up, it would suggest an increase in the unit cost. However, this advanced functionality is not fully implemented because it requires granular, line-level data in the VISIT_DETAIL table, which is not yet available in our testing environments.
Question (@shishirshakya ): I’m having trouble installing the package from GitHub; it’s giving me a “Not Found” error. Is it available yet?
Answer (@Gowtham_Rao ): The package is in an alpha release stage, so you have to install it from a specific development branch, not the main branch. To install it correctly, you need to add the ref argument to the installation command, specifying the “Alpha release” branch.
Question: Is the primary goal of this package to generate summary data at the person or visit level?
Answer (@alexanderalexeyuk & @Gowtham_Rao ): The package can do both. It has an aggregate setting that controls the output. If you set aggregate = TRUE, the package will return population-level summary statistics, including mean, median, and percentiles. If you set aggregate = FALSE, it will output clean, person-level data. This person-level data can then be used for more complex modeling or characterization studies, allowing analysts to apply any method that uses a continuous variable as either a feature or an outcome.