OHDSI Home | Forums | Wiki | Github

Phenotype Phebruary Day 29 - Acute Kidney Injury

Thank you @Gowtham_Rao, I agree that being able to do some basic calculations in ATLAS would be of much added value!
Regarding the cohort definitions, we don’t have writing privilege in the ATLAS Phenotype, so I can’t create a new cohort, would it work if I share them with you by email?

Yes, that works perfect!

Thank you @Marcela and @david_vizcaya . I :heart: our community so much that we don’t feel ‘limited’ by 28 days in Phenotype Phebruary, we create a Day 29!!! That’s the spirit!

And thank you for initiating an important discussion on ‘Acute Kidney Injury’. This is an outcome that we’ve encountered over and over again, and each time, it kind of feels like we attempt to reinvent the wheel, so it would be VERY helpful if this discussion leads to a community consensus approach that we can develop and thoroughly evaluate across a large network of data partners.

Re: change in creatinine values, I’ll note that during CHARYBDIS we wrote a custom script outside of ATLAS to capture these cases. @aostropolets did a lot of work in this space back then. And we found that few databases were actually capturing SCr values with the frequency necessary to observe the acute changes. So, while it is currently a known limitation in ATLAS, I suspect its primarily a limitation of most data that will hold us back from using the creatinine change values. But, for data partners with complete capture of SCr, there is a crude work-around one can use in ATLAS: instead of looking for relative changes (e.g. increase in SCr >=0.3 mg/dl in 48 hours), one can create entry events based on absolute values (e.g. SCr <1.35 mg/dL (upper bound of normal range) AND mesurement value SCr > 1.65 mg/dL (upper bound + 0.3) the next day). This would not be a ‘sensitive’ definition, in that it’s possible for someone to have a lower baseline value and still qualify for AKI, but it would be a ‘specific’ definition in that anyone with two values on two days meeting these thresholds would certainly qualify. And, at least according to this article by Waiker et al, if I’d reading it correctly, the absolute increase is often ~2 mg/dL, so this would mean we’d capture most of the cases this way (at least those without pre-existing kidney disease who start with a normal value). And if we wanted to get even cuter, then we could create multiple entry events to model the ‘Increase in SCr >=1.5 time baseline’, such as ‘(baseline SCr < 1.35 AND SCr > 2.025 (1.351.5) in 7 days post index) OR (baseline SCr < 2 AND SCr > 3 (21.5) in 7 days post index) OR (baseline SCr < 3 AND SCr > 4.5 (31.5) in 7 days post index) OR (baseline SCr < 5 AND SCr > 7.5 (51.5) in 7 days post index)’. We could profile the data of baseline values to make sure we covered the observed scenarios, to see how much we ‘miss’ by this approximate approach but I’d be willing to bet we could get very close with only a couple iterations.

I agree @Patrick_Ryan, it would be great to have other DBs to be able to implement the complete phenotype with lab values, evaluate and potentially validate against case ascertainment.

Any DB with SCr values, would be a great start. Unfortunately the DBs we have in OMOP don’t have Scr measurements, although Optum has records of a measurement it does not have values:

It would be interesting to check the units that are used when the measurement is reported because some there are some units that might already give the ratio of Scr time t compared to SCr at baseline such as
“CONCEPT_ID”: 8688,
“CONCEPT_NAME”: “percent baseline”
and
“CONCEPT_ID”: 9217,
“CONCEPT_NAME”: “percent basal activity”

but I don’t know if they are used. It seems that units is something that also needs to be standardized unless done in an adhoc way. Or could all possible unit nomenclature be added in an inclusion criteria with an OR in between?

Yes. Yes. Yes. To the standardized part…

When you select the unit concepts in this way, those are used as ORs within the specific criterion. In other words, it doesn’t say: where unit is 1000ml/L AND 100ml/.1L AND 1L/L…those are or’d together.

1 Like

Dear @Gowtham_Rao , thank you for looking into this from a concept prevalence perspective. Indeed when running cohort diagnostics it confirms what you said and adding N00 and N01 codes does not add a lot of value, so our suggestion is to use only N17 and its related standard concepts.

My comment with regards to poor sensitivity still stands though. Hwang et al. did a remarkable work on addressing the validity of N17.x codes to ascertain AKI both at presentation in ER and at hospital admission. For the former sensitivity is 30.4& and PPV 33.8 (spec of 99.2%!!). For the validation at hospital admission, sens increases to 56.4% and PPV drops to 24.7% (spec 96.0%). Hence, this phenotype needs to be used with caution when trying to build a generalizable cohort and probably. I wonder if it may work better for certain sub-phenotypes of AKI such as contrast-induced AKI or even in certain segments of the patient population (age, history CV disease/CV surgery, history of advanced CKD…)

This was discussed thoroughly in our las phenotype WG Friday call and it seems to me a very elegant way for exiting a cohort based on recovery from the acute event. We finally did not implement it because I was concerned of other factors affecting a normal SCr such as physical activity (muscle mass), metabolic factors, age, etc. It was challenging for me to decide on a threshold value that one could consider back to normal that applies to a large heterogenous population. I wonder why it is not standardized in AKI as it is in CKD with estimation of GFR based on SCr and other parameters. Any thoughts?

I’d just like to chime in that the ability to make criteria based on change in measurement values may not be required here. If you can establish that the person enters the cohort under some condition (diagnosis, a measurement above a certain value) you can make a censor criteria (where a person leaves the cohort) based on the observation of a ‘normal’ range of serum creatine value. I’m not clinically experienced to know if serum creative is measured in ‘relative to prior measurement’ in order to make the determination of ‘normal’ but if it is just a matter of fidning a value within a range, then you should be able to use the current functionality of cohort exit criteria.

This all depends on the capture of entry events is as reliable as exit events, but you can use a persistence window on the entry events to have a ‘default exit’ if you don’t see any reason to keep them in the cohort within X days.

Acute kidney disease and renal recovery: consensus report of the Acute Disease Quality Initiative (ADQI) 16 Workgroup
This 2017 Consensus statement provides some insight into work being done to stage renal recovery post AKI/AKD

Thanks @Tina_French, this is consistent with our definition so far, and adds an interesting new concept which is rapid reversal of AKI (recovery in less than 48h post-AKI). Certainly it justifies having the variable cohort exit as @Gowtham_Rao was proposing along with the 7-days fixed rule.

Thank you @Chris_Knoll! I’m glad to know I don’t have to build one inclusion criteria for each unit, until they are standardized, this is a good workaround.

Hi @Chris,
your point is consistent with the proposal from @Patrick_Ryan

We are eager to test it, once we have access to SCr values! If anyone in the community has access to such DB we’ll share the phenotype with lab values to test it (the other phenotypes are already in the ATLAS-Phenotype repository.
Thank you!

Thanks @Chris_Knoll actually the issue is that we would like to use lab measurements of SCr independently and not associated with a diagnosis code (to capture more cases that may not have an AKI code as entry for whatever reason). There are normality ranges for Scr although it varies largely with age, sex, height, metabolism, and other factors. For the purpose of AKI ascertainment one must look at a sudden decline in SCr regardless of the baseline, which might even be already pathological (for example, chronic kidney disease)

We probably will have to add that functionality, @Chris_Knoll. It is not that common, but sometimes it will be used. PSA in prostate cancer is another example.

One possible approach to implement changes in measurement values is to compute the values beforehand, and deposit them in the respective OMOP table (normally MEASUREMENT or OBSERVATION).

For example, you can create a custom concept ID that means “difference in SCr value from last record,” and use it to create custom records from the actual SCr values. Those custom records can be generated using a SQL query employing the LAG() window function, assuming your database supports it. For every instance of SCr except the patient’s first, a new record is created using the custom concept.

Then, you can use that custom concept normally in Atlas. A similar approach can be used for rolling averages, and notice it’s also possible to filter outliers using CASE expressions. What would be a lot harder to implement in SQL, though, is intelligent filtering of records akin to what a physician would do in the physical world, e.g. test is suspicious for technical error and should be redone.

One point that I feel is being left unsaid in this conversation is this. Computing “difference in value between two rows” in real time is computationally very different from computing “value above constant.” The fomer requires a potentially very expensive JOIN operation, unless you can circumvent the join by leveraging underlying assumptions of the data. One such case is using the LAG() function as I described, which assumes you’ll never need to ignore a record based on other records. If your phenotype logic has multiple branches with such cross-row computations, and the query plan optimizer can’t simplify everything into fewer table joins, you could be facing queries that may take too long for your server to compute, even if using advanced database engines and powerful, distributed cloud enviroments.

Exactly @Christian_Reich ! I also think of slopes for certain markers like eGFR or UACR as a marker of rapid progression of diseases like CKD. That would be challenging to program as an outcome in the current atlas envrionment, right?

@Marcela @david_vizcaya

We would be interested in testing out how to include lab measurements (and changes) in cohort definitions and collaborating.

We are a research group from Denmark (Center for Surgical Science, https://centerforsurgicalscience.dk/), that has a CDM of the danish laboratory database, which among many other laboratory measurements, records serum creatinine (with measurement values). Similarly, we have GFR and UACR available.

However, the laboratory database, while containing data for around ~140.000 patients that have a cancer diagnosis (and about 3.7 million seCr measurements), is a standalone database - that is, not containing other medical records such as diagnoses, procedures etc.
We are currently in the process of merging this data from several other databases into a combined CDM, so as to be able to create cohorts based on a variety of concepts, and are expecting this to be finished in april/may 22. In order to incorporate the full cohort definition, we will have to wait for that.

We currently specialize mostly in colorectal cancer surgery research, where one of our use-case-scenarios will be to implement conditions like anemia into our CDM research, which similarly to AKI, would require a cohort definition that incorporates diagnosis codes, a range of measurement values and possibly drugs administered such as iv iron etc.
However, AKI is a complication that frequently occurs after surgery - therefore this would also be within the scope of our research.

Let me know if you are interested, you can also write me an e-mail at vial@regionsjaelland.dk :slight_smile:

@cssdenmark @Karoline_Bendix_CSS @Julwa

2 Likes

Hi @Viviane! that sounds very interesting! I strongly suggest that you and your colleagues join the phenotype WG and bring your specific doubts and queries to our Friday calls. I am sure you will find it useful and very enlightening! And it may be a place to initiate collaborations :blush:. Also do not hesitate to ask questions in the forum to reach out to the whole community of experts.

2 Likes

Hello. I’m a laboratory informaticist new to OHDSI. Also working on SHIELD with FDA and others on laboratory data interoperability nationally/globally, especially for RWD/RWE.

Do your AKI Phenotypes and timelines take into account the following?

  1. New NKF Oct 2021 guidelines and formulas to calculate eGFR? Updated formula does not use race to avoid the biases where different eGFR calculations used with certain populations lead to misstaging for AKI and thus not receiving adequate clinical care.

  2. The shift in eGFR result values (from a single laboratory) from the older eGFR formula (whichever one of several they used) to the new eGFR formula. Some are reporting a % increase in certain populations compared to previous, while others are reporting a % decrease in other populations.

  3. Accounting that laboratories are all at different stages of transition from the old to new eGFR formulas. Some changed in 2021, while others have not yet changed. When comparing data in cohorts, are cohorts all before the 2021 guidelines change? Or do they include a mix of lab result values, some on older formula and some on newer formula.

  4. If cohort timeline is only data prior to Oct 2021, then are you identifying the different eGFR formulas to avoid comingling data from them so analytics can be performed on each separately?

Missed if these have been addressed, so feel free to point me in the right direction.

Cordially,
Andrea

My R package Phea can help compute changes in lab values over time, for example “increase in serum creatinine by >= 0.3 mg/dL within 48 hours”, or “ratio of >= 1.5 within 7 days”.

I wrote a vignette to walk you through how to do that using the package. Please see it here.

This is how the phenotype looks like:

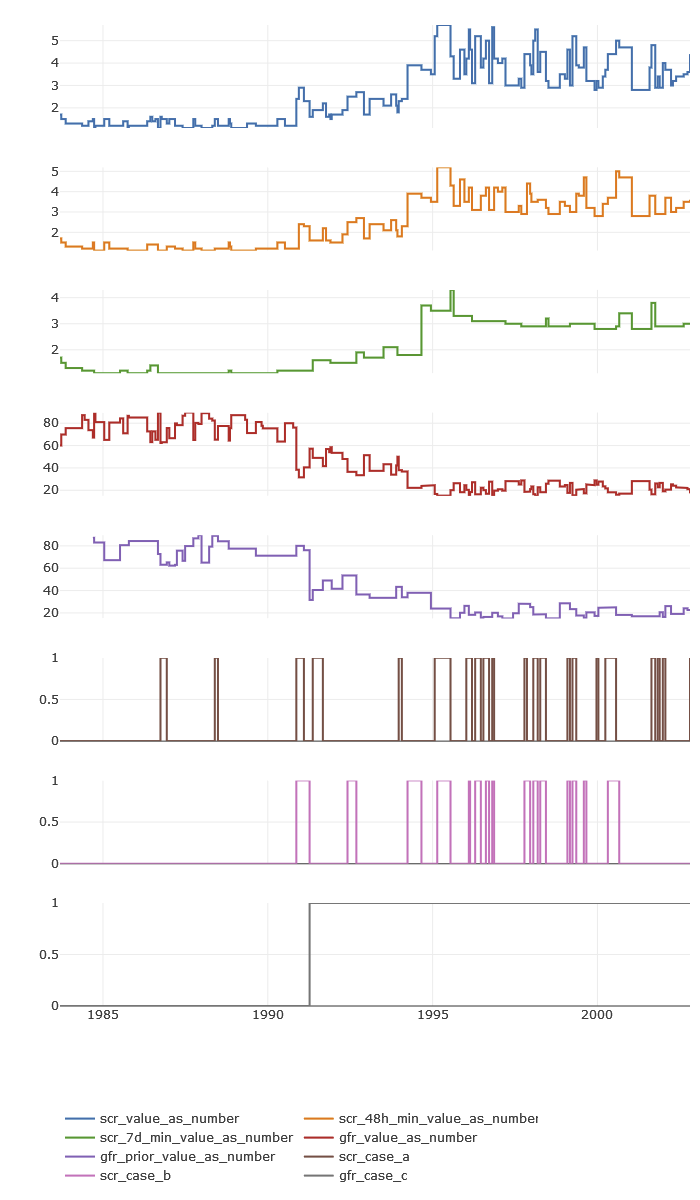
And here is how the plot of the scr_change phenotype looks like for a single patient:

My vignette is limited to data that Synthea™ can produce. I hope the demonstration is clear enough so that anyone can easily update, for example, the concept IDs, or how units of measurement are identified. If anyone would like to talk to me about this over email or a call, just let me know!

Phea’s phenotypes are just SQL queries. The final SQL code for scr_change is in the vignette. You can get that query and take it elsewhere, if wanted.

2 Likes
t