Exactly @Christian_Reich ! I also think of slopes for certain markers like eGFR or UACR as a marker of rapid progression of diseases like CKD. That would be challenging to program as an outcome in the current atlas envrionment, right?
We would be interested in testing out how to include lab measurements (and changes) in cohort definitions and collaborating.
We are a research group from Denmark (Center for Surgical Science, https://centerforsurgicalscience.dk/), that has a CDM of the danish laboratory database, which among many other laboratory measurements, records serum creatinine (with measurement values). Similarly, we have GFR and UACR available.
However, the laboratory database, while containing data for around ~140.000 patients that have a cancer diagnosis (and about 3.7 million seCr measurements), is a standalone database - that is, not containing other medical records such as diagnoses, procedures etc.
We are currently in the process of merging this data from several other databases into a combined CDM, so as to be able to create cohorts based on a variety of concepts, and are expecting this to be finished in april/may 22. In order to incorporate the full cohort definition, we will have to wait for that.
We currently specialize mostly in colorectal cancer surgery research, where one of our use-case-scenarios will be to implement conditions like anemia into our CDM research, which similarly to AKI, would require a cohort definition that incorporates diagnosis codes, a range of measurement values and possibly drugs administered such as iv iron etc.
However, AKI is a complication that frequently occurs after surgery - therefore this would also be within the scope of our research.
Let me know if you are interested, you can also write me an e-mail at vial@regionsjaelland.dk 
2 Likes
Hi @Viviane! that sounds very interesting! I strongly suggest that you and your colleagues join the phenotype WG and bring your specific doubts and queries to our Friday calls. I am sure you will find it useful and very enlightening! And it may be a place to initiate collaborations  . Also do not hesitate to ask questions in the forum to reach out to the whole community of experts.
2 Likes
Hello. I’m a laboratory informaticist new to OHDSI. Also working on SHIELD with FDA and others on laboratory data interoperability nationally/globally, especially for RWD/RWE.
Do your AKI Phenotypes and timelines take into account the following?
-
New NKF Oct 2021 guidelines and formulas to calculate eGFR? Updated formula does not use race to avoid the biases where different eGFR calculations used with certain populations lead to misstaging for AKI and thus not receiving adequate clinical care.
-
The shift in eGFR result values (from a single laboratory) from the older eGFR formula (whichever one of several they used) to the new eGFR formula. Some are reporting a % increase in certain populations compared to previous, while others are reporting a % decrease in other populations.
-
Accounting that laboratories are all at different stages of transition from the old to new eGFR formulas. Some changed in 2021, while others have not yet changed. When comparing data in cohorts, are cohorts all before the 2021 guidelines change? Or do they include a mix of lab result values, some on older formula and some on newer formula.
-
If cohort timeline is only data prior to Oct 2021, then are you identifying the different eGFR formulas to avoid comingling data from them so analytics can be performed on each separately?
Missed if these have been addressed, so feel free to point me in the right direction.
Cordially,
Andrea
My R package Phea can help compute changes in lab values over time, for example “increase in serum creatinine by >= 0.3 mg/dL within 48 hours”, or “ratio of >= 1.5 within 7 days”.
I wrote a vignette to walk you through how to do that using the package. Please see it here.
This is how the phenotype looks like:

And here is how the plot of the scr_change phenotype looks like for a single patient:
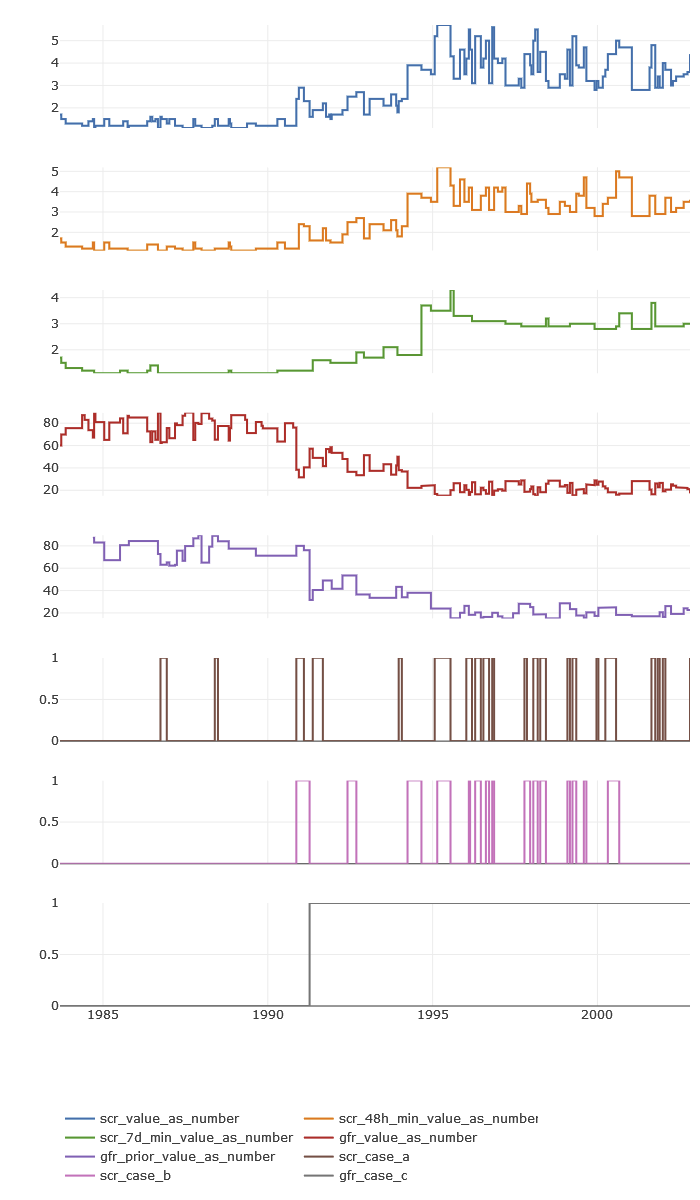
My vignette is limited to data that Synthea™ can produce. I hope the demonstration is clear enough so that anyone can easily update, for example, the concept IDs, or how units of measurement are identified. If anyone would like to talk to me about this over email or a call, just let me know!
Phea’s phenotypes are just SQL queries. The final SQL code for scr_change is in the vignette. You can get that query and take it elsewhere, if wanted.
3 Likes