Hello Everyone,
I recently tried out the “Cohort pathways” feature in Atlas and it’s cool. Thank you Atlas team. However as I would like to investigate the subjects under each pathway, I have few questions on the results stored under pathway_analysis_ * tables. Just would like to confirm my understanding on few things. Can help us with this?
- Pathway_analysis_stats
This table just contains our cohort id,its count and pathway count. If we keep modifying/editing the same target cohort again and again, we just have to pick the recent version. Am I right to understand that there is nothing more to this table? But is the Pathway_analysis_generation_id a sequence number? How is it generated and why do I see some break in generation_ids as shown below?
- Pathway_analysis_codes
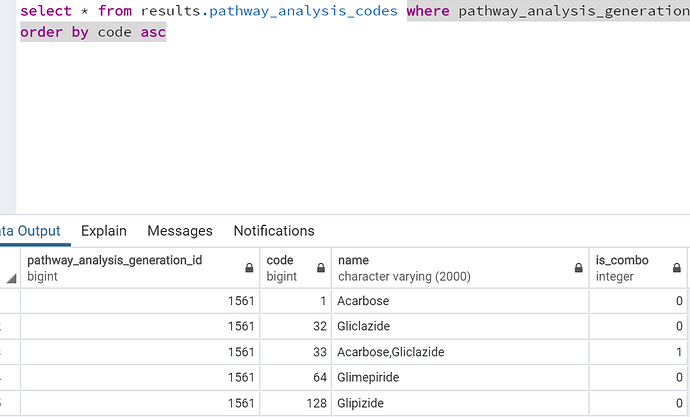
I understand that here we have to filter the table based on our “pathway_analysis_generation_id” but may I know
a) what does code column mean here? I mean I understand it is used to indicate the drugs but how is it obtained? because they aren’t concept_ids
b) Is_combo - I believe it is just about indicating whether a medication is appearing in combination with any other medication or not. 1 for combination and 0 for not.
- Pathway_analysis_events
a) Here “combo_id” column is same as “code” and “ordinal” column can have a maximum of the “maximum path length” that we set during design phase. Meaning path length of 3 indicates, ordinal column can only have a maximum value of 3 in the generated data.
b) “subject_id” and “ordinal” together gives us the info on number of events a subject was part of. If I would like filter patients based on events, I have to use the code/combo_id? Am I right to understand this?
- pathway_analysis_paths
a) Again, here steps indicate the path length. And nothing new here. Since I have set a path length of 3, the data would only be present till Step 3 and rest all would be empty. Am I right? So I can just confidently skip looking at the rest of steps?
- May I know whether is there any R package to run this? If yes, how different it is from in Atlas? Meaning the main part of cohort pathways is it’s visualization which is best shown in Atlas. if R package is present, is it used to present results in tabular form? Just trying to understand

