This post is part of a series showcasing my new R package Phea for electronic phenotyping.
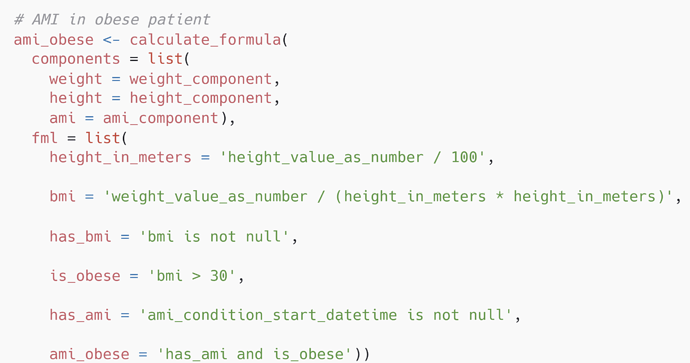
How to find events of an acute myocardial infarction (AMI) happening in clinically obese patients, body mass index, BMI > 30? Considering that a patient can have multiple myocardial infarctions, and their weight can change over time.
In Phea, this is how it looks like:
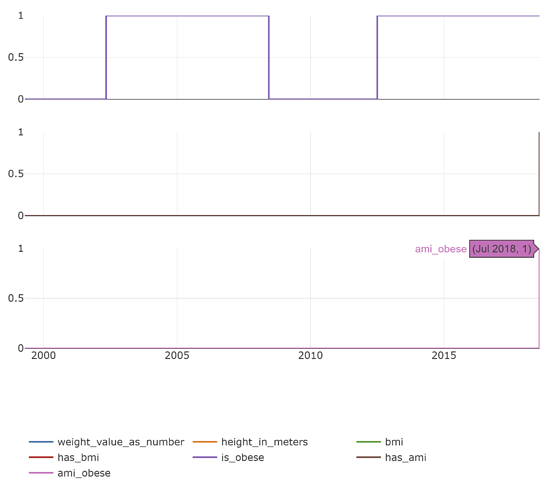
And you can make an interactive Plotly plot like this:
Phea is a SQL query builder and its phenotypes are single queries. You can get that query and take it elsewhere, if wanted.
See the full vignette here, or checkout Phea in GitHub at GitHub - fabkury/phea: R package for finding patients in SQL databases using formulas and without using SQL joins.
Kind regards!

