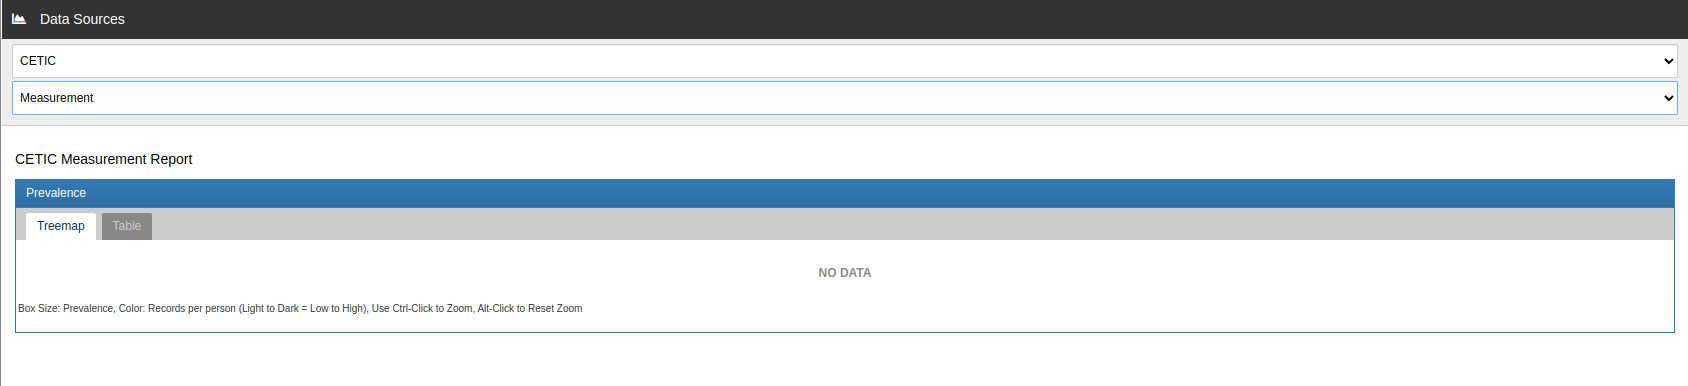
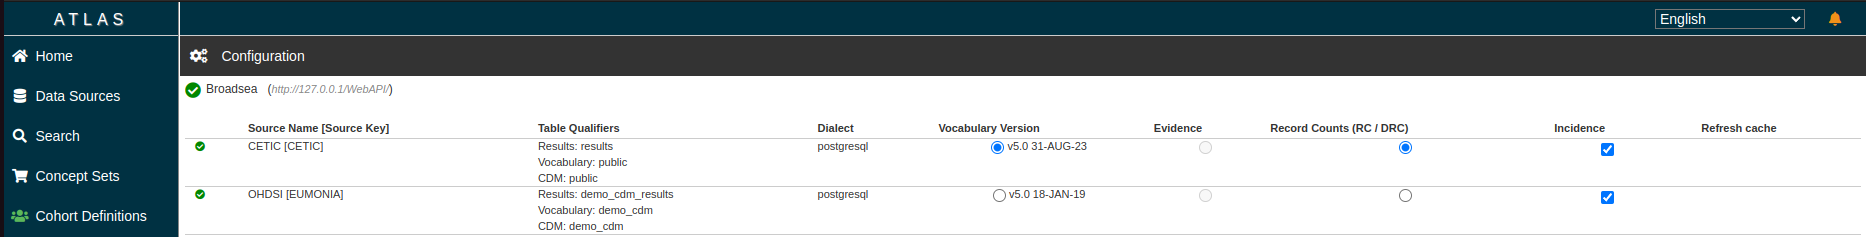
Hello everyone, I’m new to this community. I recently managed to install Atlas using Brodsea 3.1 and linked it to my database. Unfortunately, most of reports show “no data”
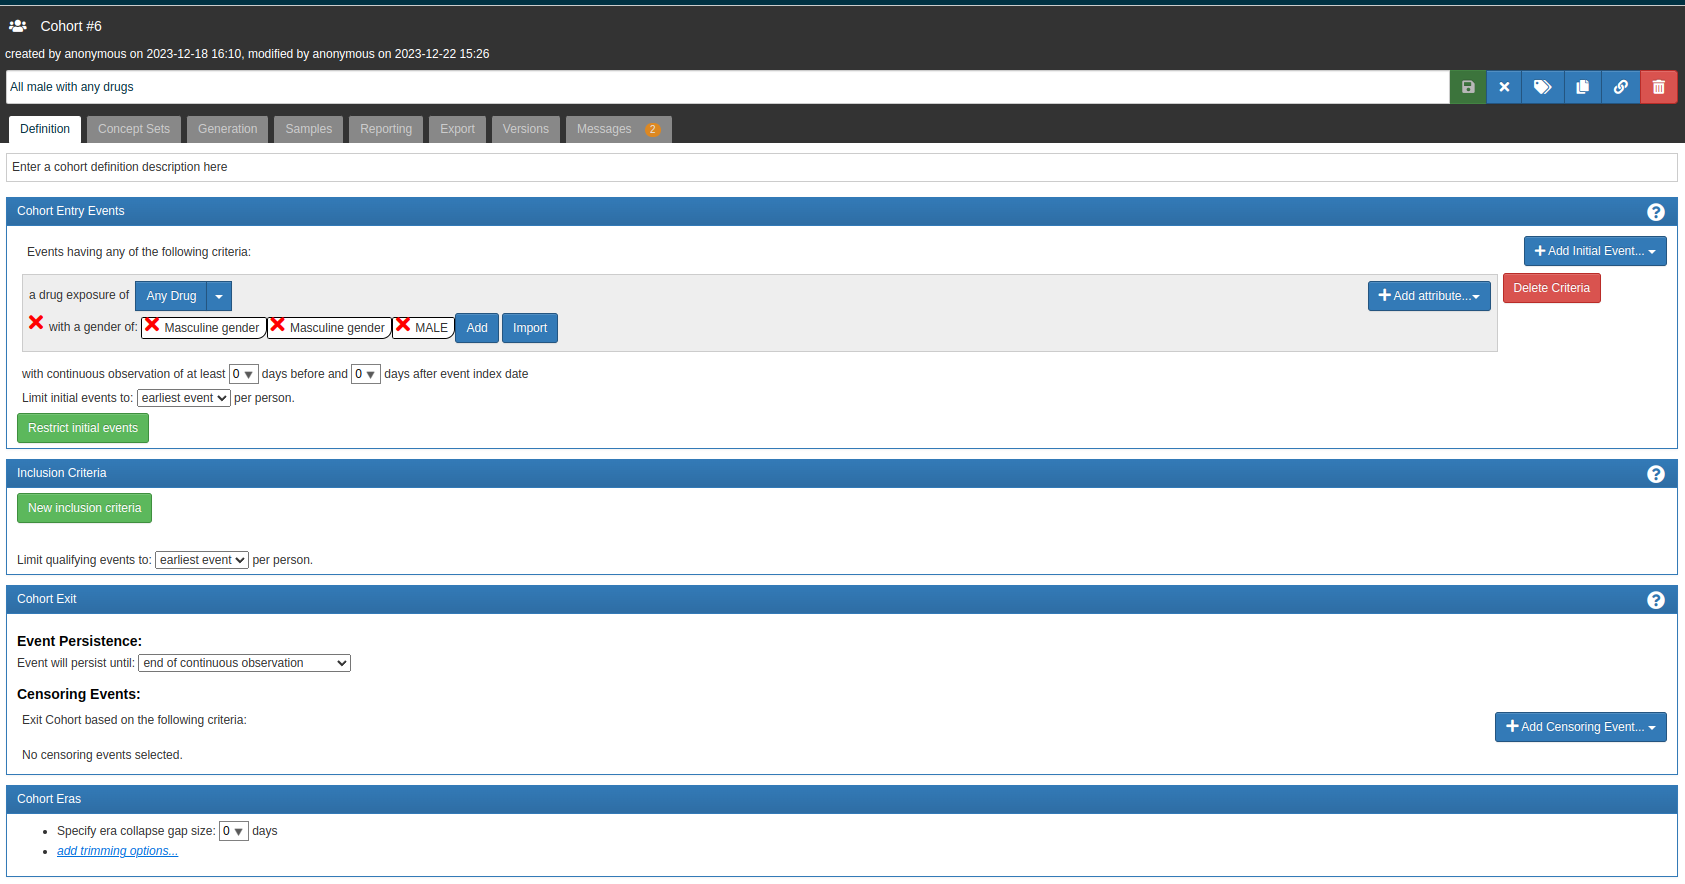
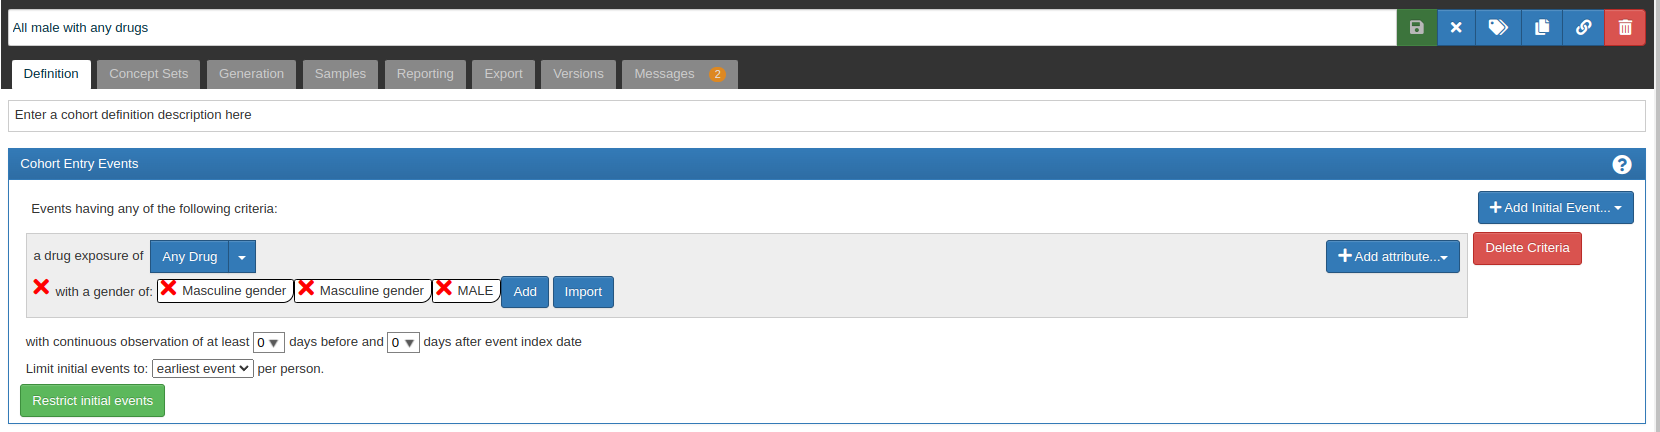
However, my major issue is that I can’t generate a cohort. I defined a cohort for “all males who have used any drugs,” but there are zero results from this cohort.
If you have any suggestions or need specific information to help me, please feel free to ask. I’m not sure what details I should provide to facilitate the exchange. Thank you very much for your assistance!
Have you populated the Observation Period table? I’m guessing that you can see the Person report in Data Sources, but all other ones are empty — this is because Person-related analyses in Achilles do not require a join to Observation Period, unlike other reports. Likewise, when you define cohort entry events, there’s an inner join to Observation Period in the generated SQL queries — you can check it by switching to the ‘Export’ → ‘SQL’ tabs in the cohort definition view.
Thank you very much. I have followed the steps you provided, so I have populated the observation_period table. This has allowed me to see several reports that were not visible before, however, some are still not visible.
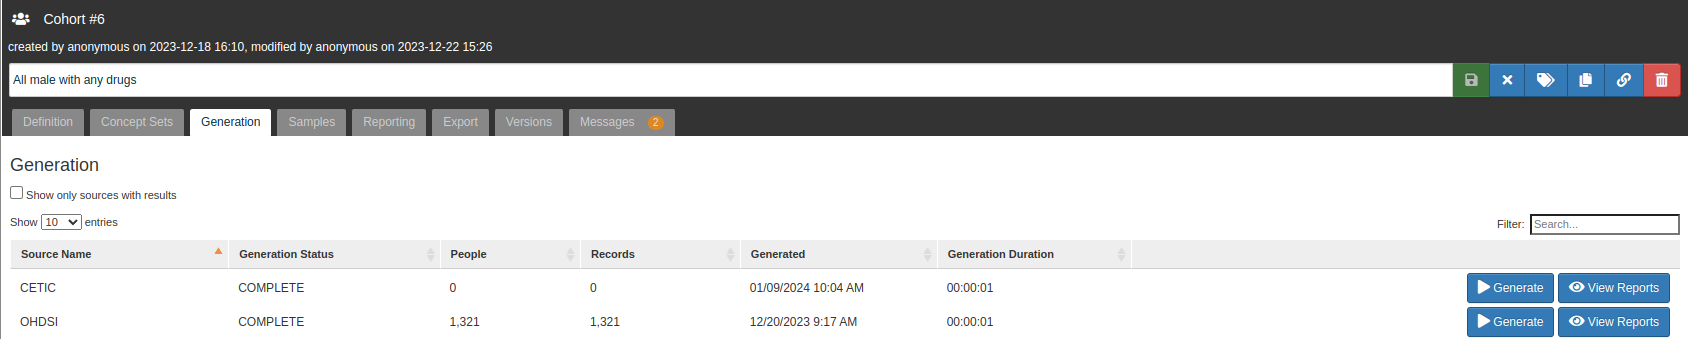
I have also attempted to generate a cohort in my database, but I don’t think the results are accurate. I conducted two tests for this purpose :
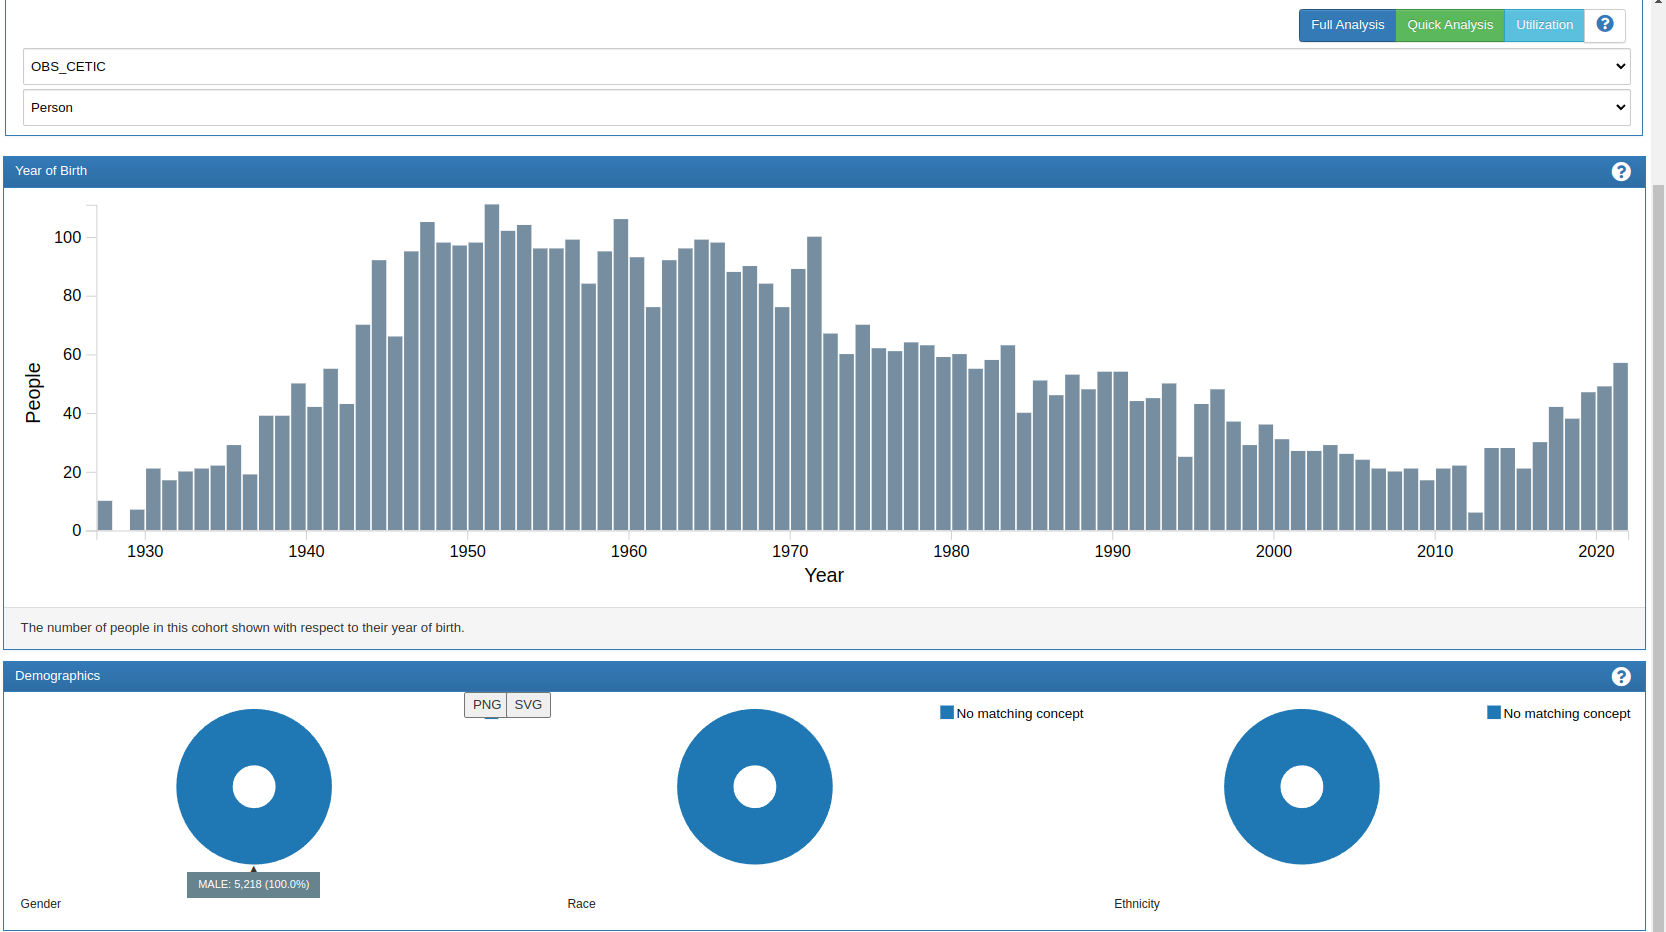
I checked the set of men who have been exposed to any drugs, and the result was 5218. Considering there are 126k persons in the database, with 53k being men, it’s possible that not all men have been exposed to a medication. (bad test)
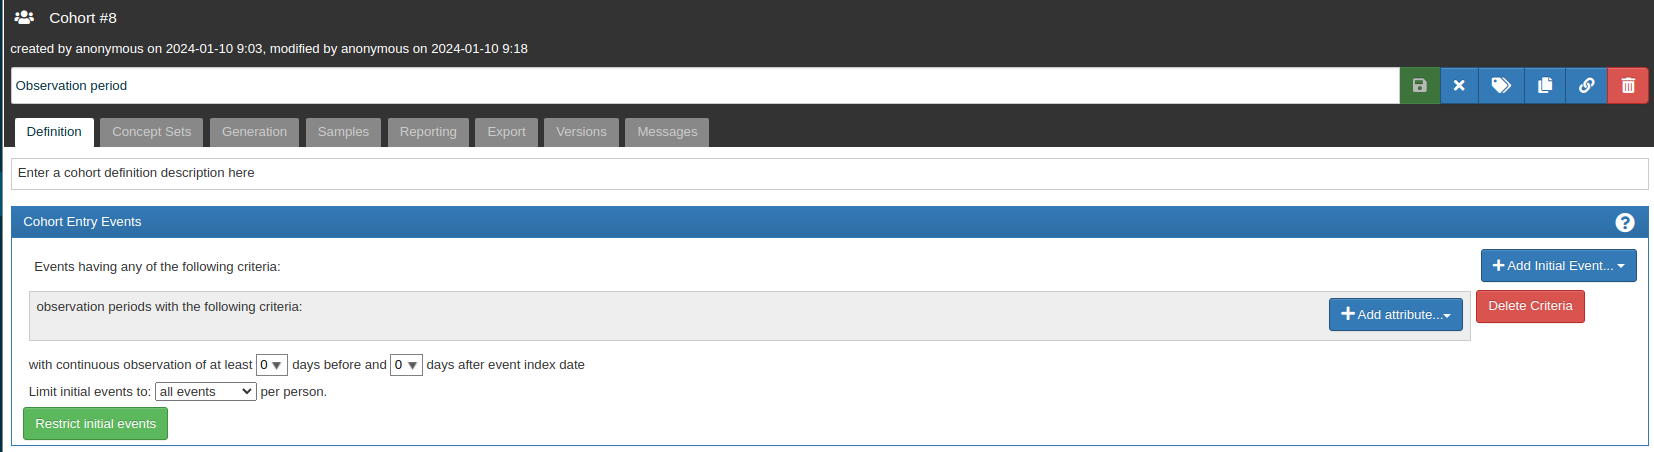
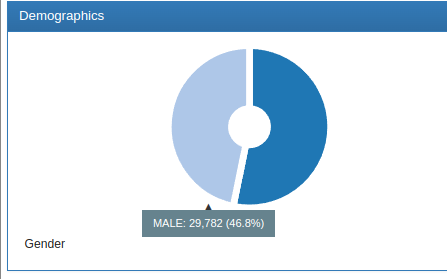
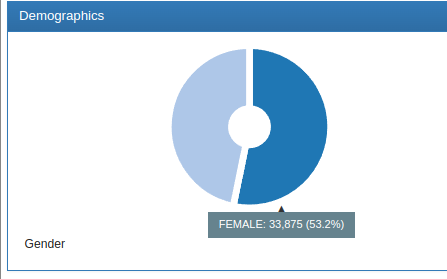
In my second test, I used the observation period as the entry event without any other filters. Since I have completely filled this table for all person_IDs present in my database (126k individuals), I obtained a cohort of 63k people(29k men, 34k women).
I’m wondering if there are other tables similar to the observation_period that must be filled.
I appreciate any insights you can provide. It’s possible that I am conducting the test incorrectly, and I might have made a mistake somewhere in the cohort generation or understanding of it.
Sorry for the delayed response. Glad that the cohorts are getting generated normally now.
Can you share which particular reports are not visible?
Looking at the concepts in your cohort definition and the results you received, I’m wondering which concepts are used in Person.gender_concept_id field of your dataset. This field is supposed to contain only standard concepts of Gender domain, and OMOP CDM documentation has an ‘Accepted concepts’ link in the ‘ETL Conventions’ column that displays the concept list in Athena with the corresponding search filters.
There are only two standard Gender concepts — 8532 ‘FEMALE’ and 8507 ‘MALE’. This makes it easier to define gender criteria in cohorts because only one concept is required, so ‘Masculine gender’ concepts from your definition are not going to be used anyway (although they can be used in gender_source_concept_id).
Consider the following query; I’m wondering if the numbers in the row with gender_concept_id = 8507 and has_op = true will be equal to the ATLAS results:
SELECT
    p.gender_concept_id,
    (op.observation_period_id IS NOT NULL) AS has_op,
    count(*) AS n_rec, count(DISTINCT p.person_id) AS n_pat
FROM drug_exposure de
INNER JOIN person p ON p.person_id = de.person_id
LEFT JOIN observation_period op
    ON op.person_id = de.person_id
    AND de.drug_exposure_start_date >= op.observation_period_start_date
    AND de.drug_exposure_start_date <= op.observation_period_end_date
GROUP BY 1,2
This can also be explained by the choice of concepts in gender_concept_id field. The part of WebAPI code that generates Person report for cohorts uses this SQL query to fetch the distribution. As you can see, the query includes the c1.concept_id in (8507, 8532) filter (probably as a performance tweak), so if any other concepts are used in gender_concept_id field, these Person records are not included and the numbers in the report are less than expected and don’t add up to the total number of patients.
I’d advise to check the Gender concepts used in the dataset and remap any non-standard ones to 8507/8532.
Only Person and Observation Period are mandatory (see #3 in OMOP CDM FAQ), this is enough to build an “empty” OMOP CDM dataset without any clinical events. All other tables should exist in the database but may be empty. Vocabulary tables are mandatory too, but they’re populated with the standardized vocabularies and therefore do not depend on the input data.
The reports that are not visible are due to the tables not being filled in my database. I am currently working on populating them :
Condition Era
Condition occurrence
Procedure
Drug Era
Observation
Death
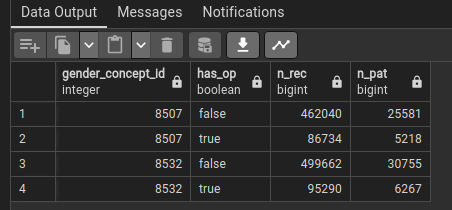
The result of this script is exactly the same as the output from Atlas:
SELECT
    p.gender_concept_id,
    (op.observation_period_id IS NOT NULL) AS has_op,
    COUNT(*) AS n_rec,
    COUNT(DISTINCT p.person_id) AS n_pat
FROM drug_exposure de
INNER JOIN person p ON p.person_id = de.person_id
LEFT JOIN observation_period op
    ON op.person_id = de.person_id
    AND de.drug_exposure_start_date >= op.observation_period_start_date
    AND de.drug_exposure_start_date <= op.observation_period_end_date
GROUP BY 1, 2;
Output script :
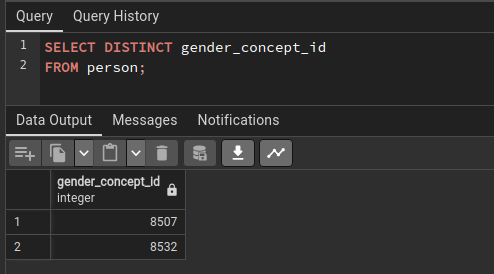
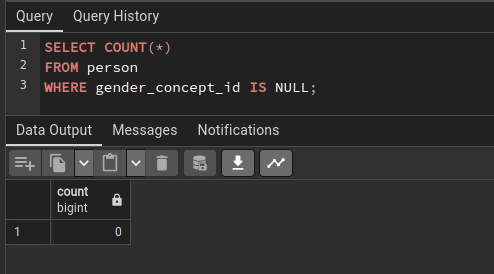
As indicated in the screenshots, I have incorrectly defined my cohort, but I do have only two gender concept IDs in my dataset (8507, 8532).
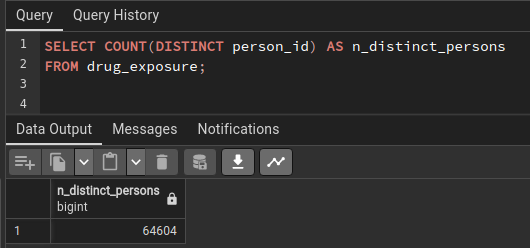
And i have only 64k distinct person_id in the drug_exposure :
I suspect that I didn’t properly populate the observation_period table. Do you have a script that goes through the database and fills it in a proper way?
That’s good, thanks for checking it. My hypothesis about the non-standard mapping was based on the fact that a share of patients “disappeared” from the report, but it turned out to be wrong.
I’m afraid there’s no ‘one-size-fits-all’ script for Observation Period because it depends on the nature of the source data:
clinical trials have start and end dates, so each subject will simply have a single observation period that spans the whole clinical trial;
insurance/claims data usually have enrollment periods, and it’s rather safe to assume that if anything happens to the patient, it will be captured by the insurance provider, so enrollment dates can be reused for observation periods;
it gets trickier with EHR data, because the time spans need to be inferred under a set of assumptions. A popular strategy is to simply take min/max dates across all recorded clinical events and create one long observation period per patient — example 1 build upon a dedicated encounters source table, and example 2 builds observation periods after all other CDM tables are populated.