Hello.
While watching some Ehden tutorials about Atlas I found something strange.
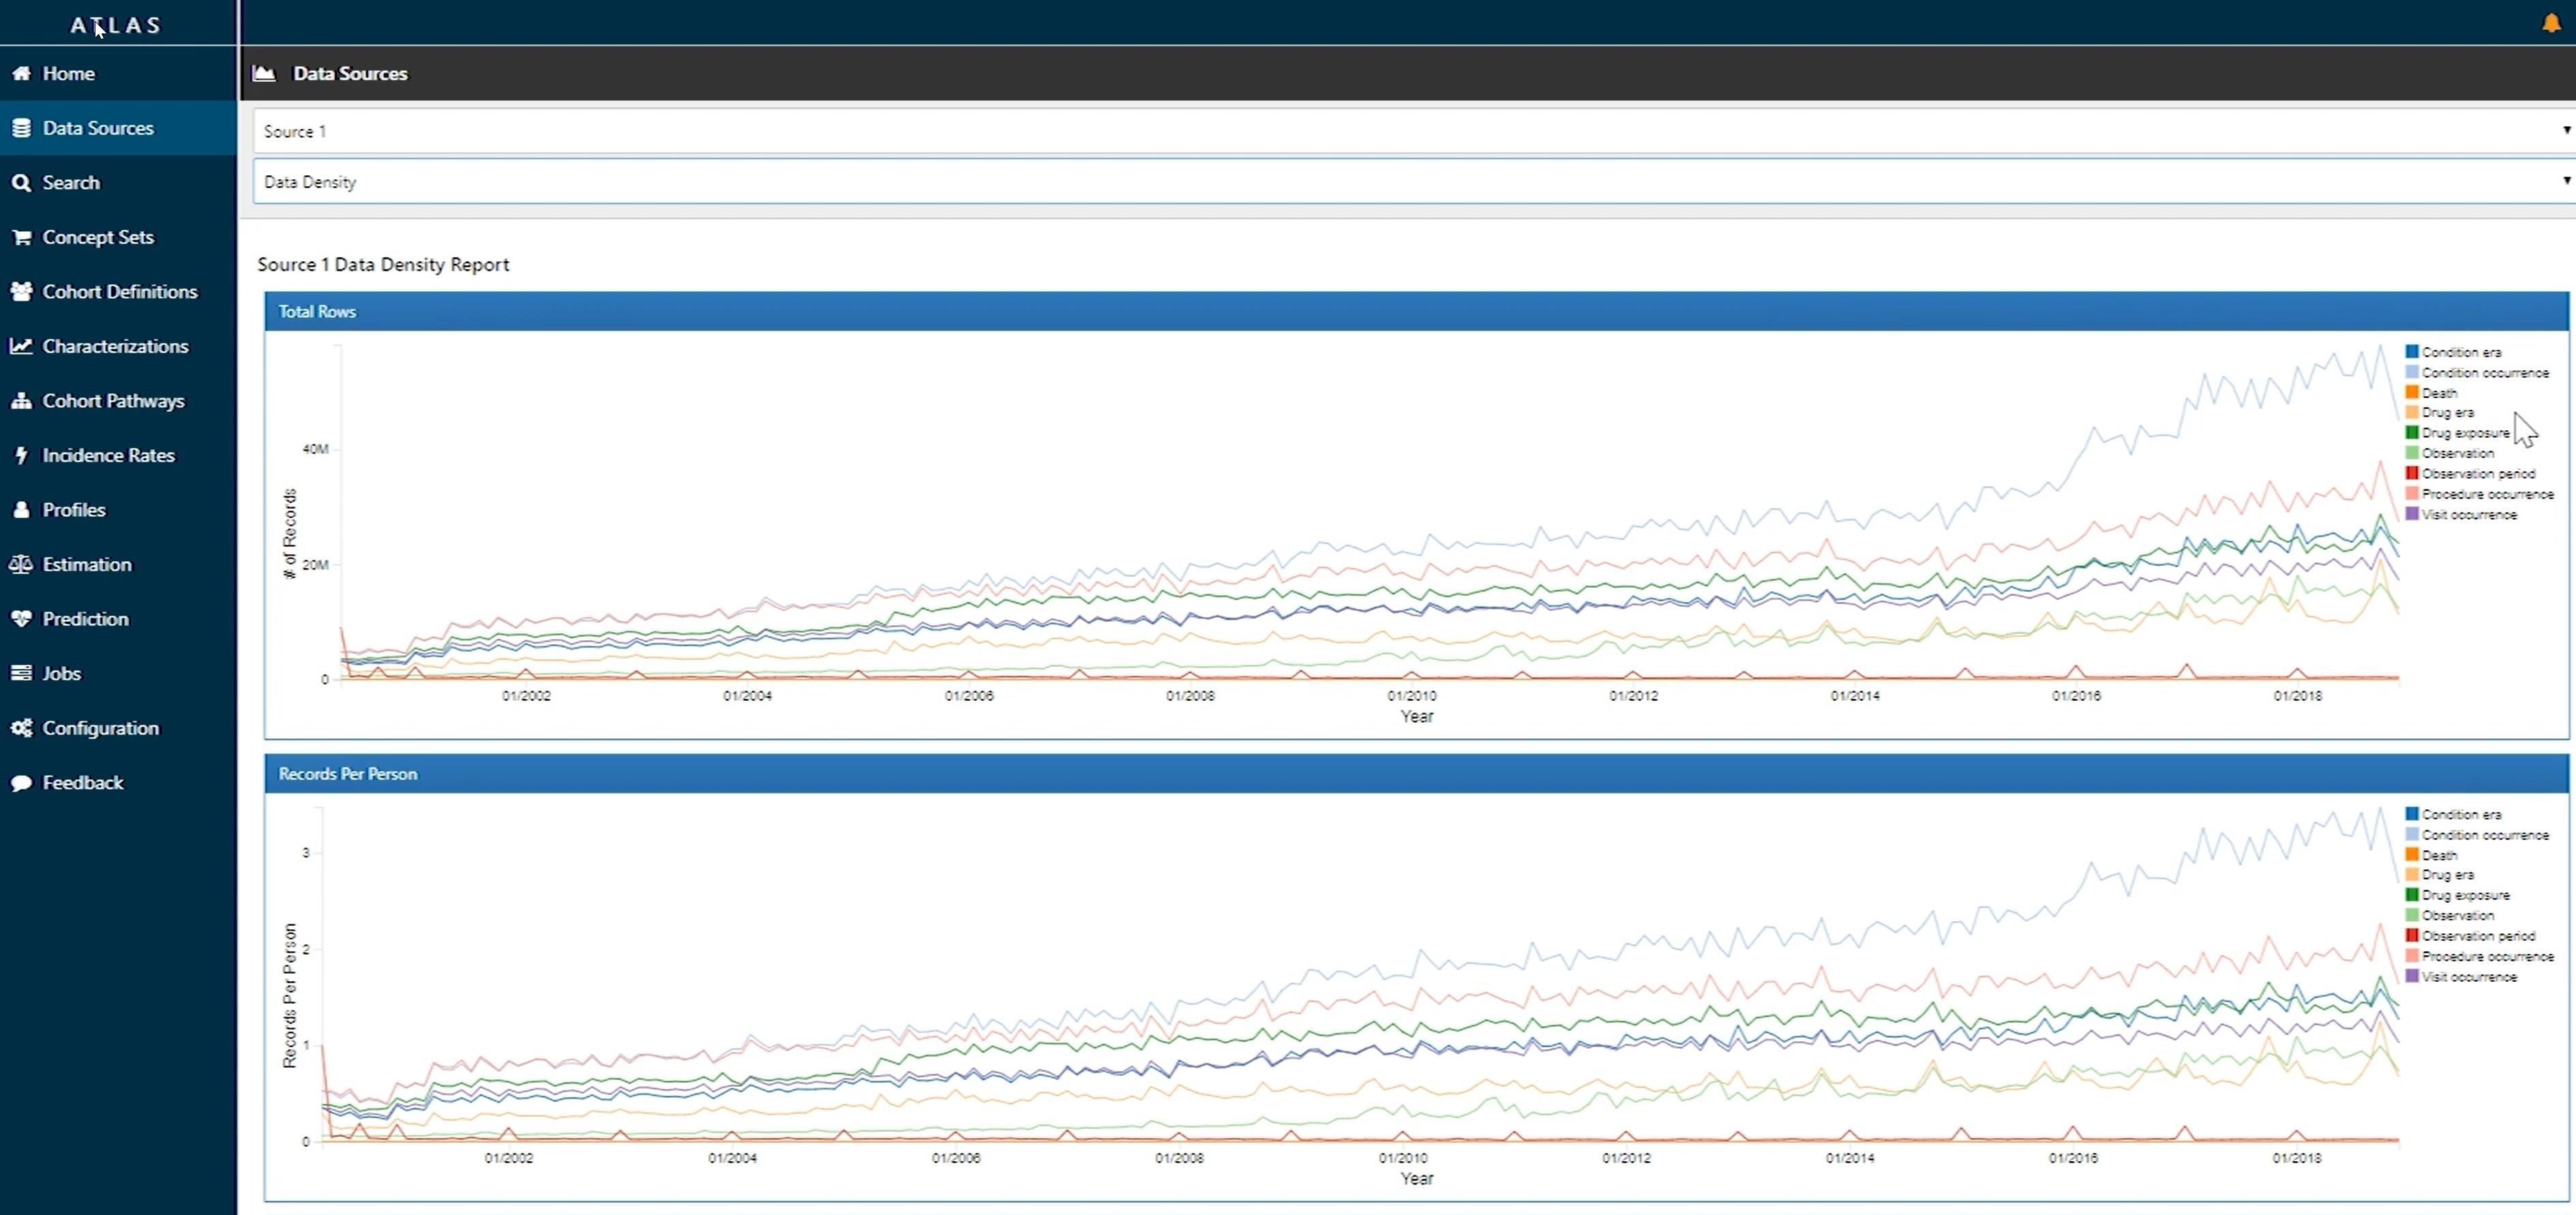
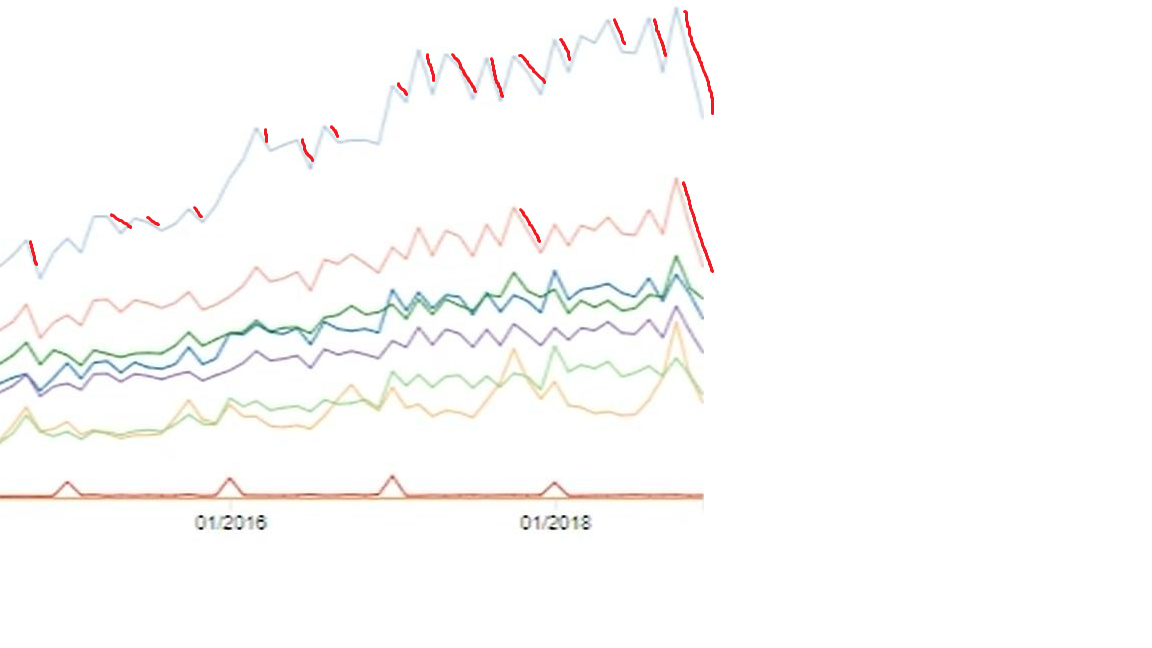
The source data density report shows that the number of records, in average, increases over time, but if we take a closer look we can also see small drops.
Why does the total number of records decrease so often?
If it only happened once, it could be an error but it happens hundreds of times.
Maybe it’s not the (cumulative) total number of records but new records?
Maybe the data is plenty of errors and is corrected every day or has duplicated?