Hi folks. We’re using CDM v 5.3, atlas 2.10.1 and webapi 2.11.1. I’m not sure how to check Achilles version but anyway.
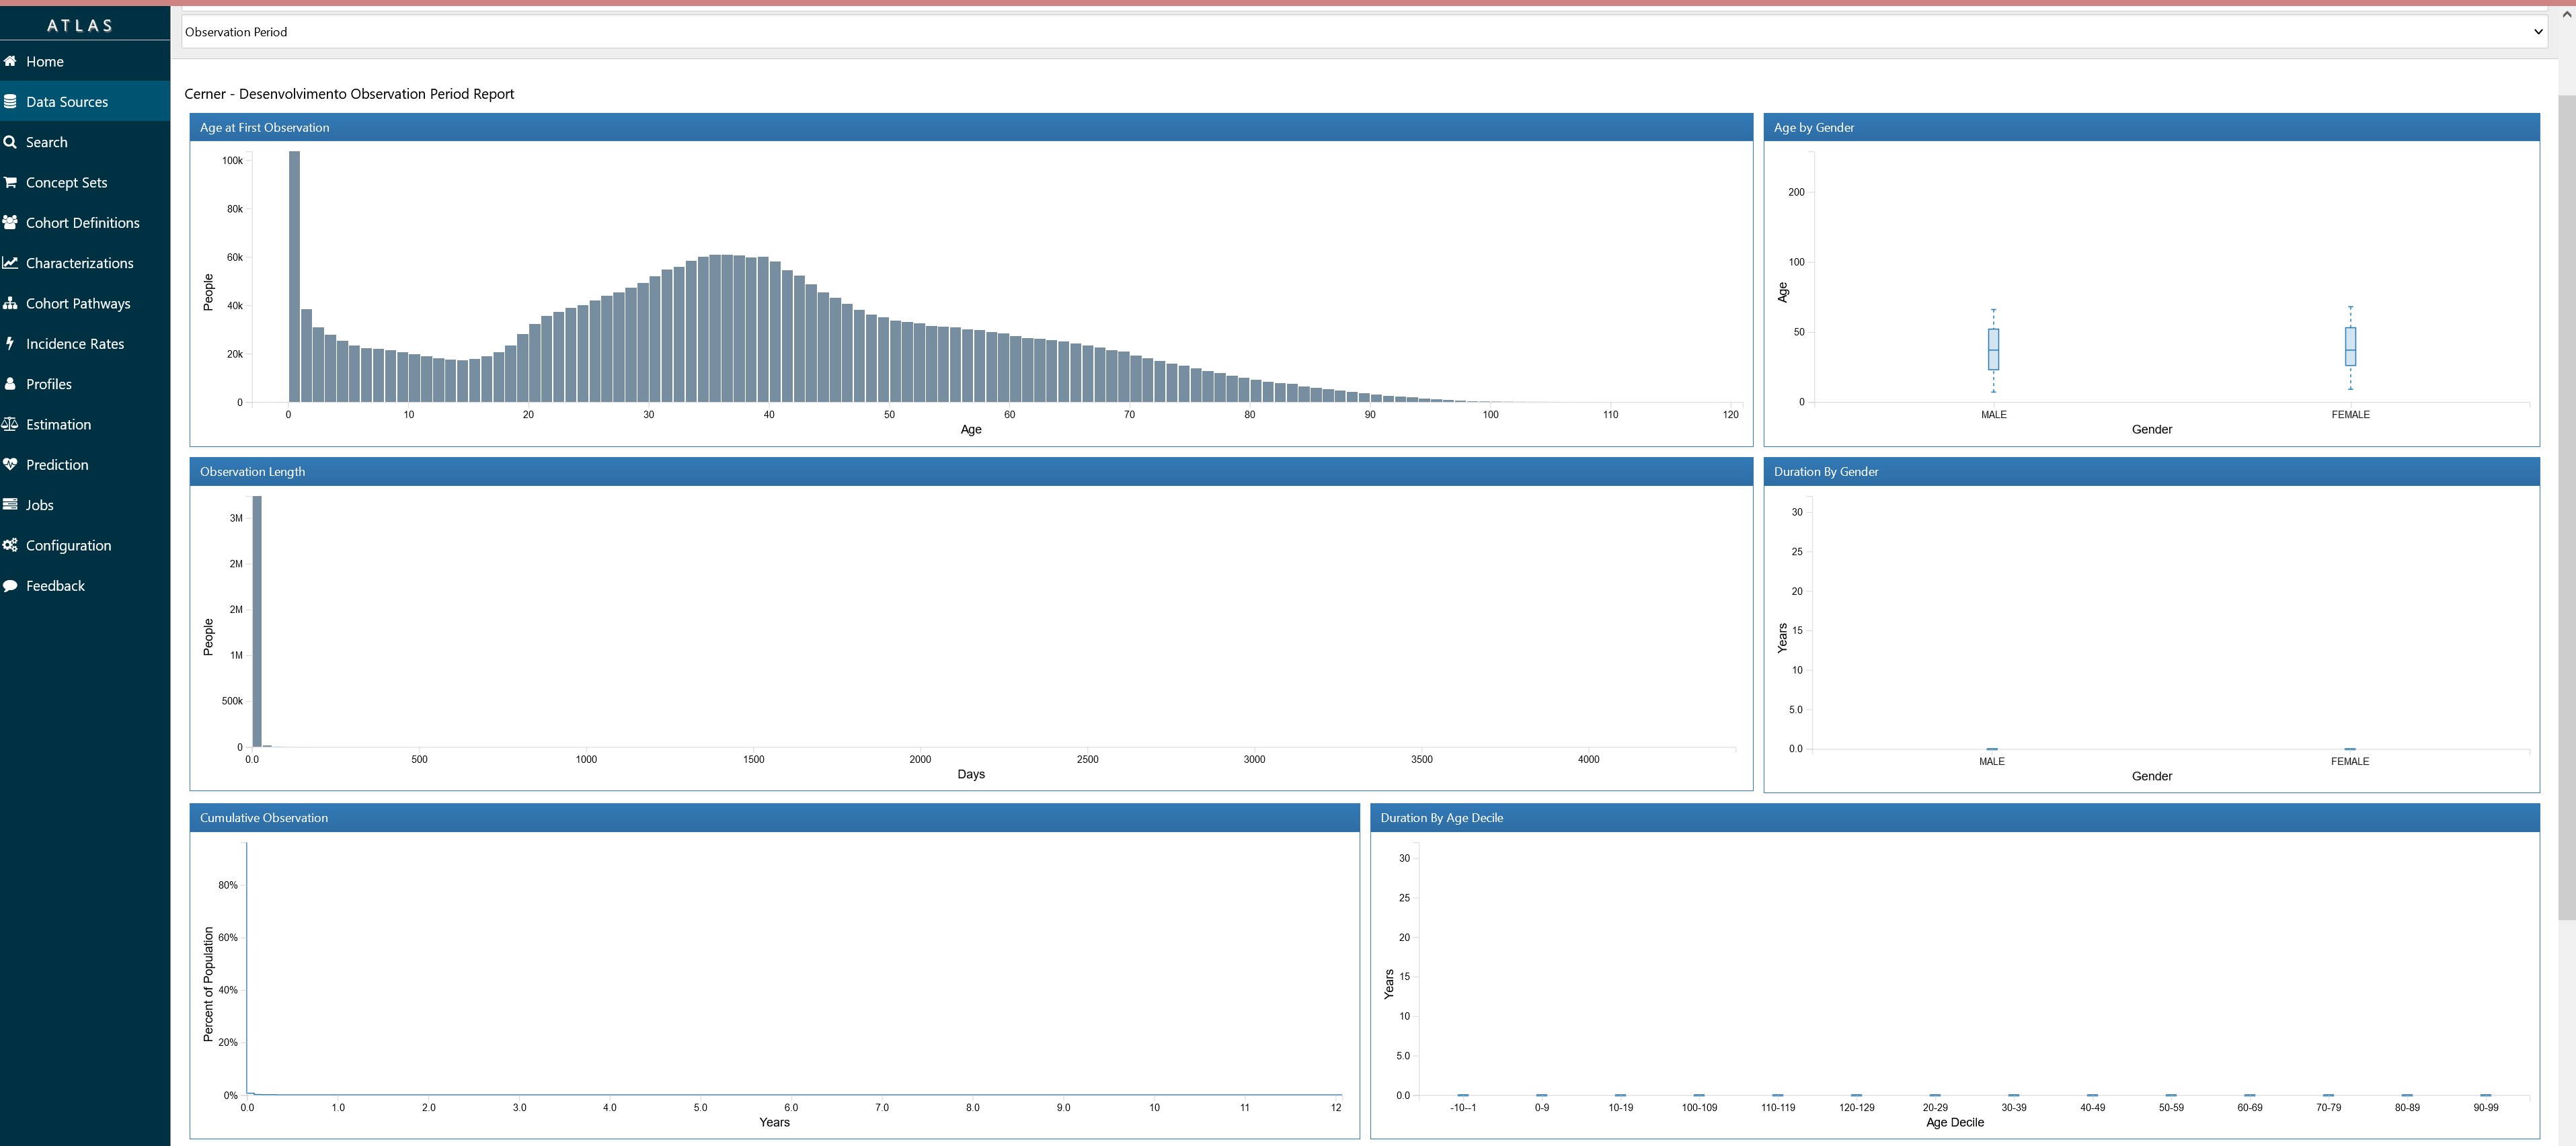
I was inspecting why in our database some of the observation period graphs were so flat (see attached image). In particular, the Observation Length graph shows that 95% of patients in our hospital have 0-30 days on their first observation period.
These graphs are generated by a series of queries that end up getting data from achilles analysis 106, 107 and 108. And all those queries retrieve only the first observation period from each patient (see the row_number() columns and where clause )
I’m not sure what those analysis intend to show. We expect that, in a hospital, the minority of first-time patients will be both an inpatient AND have a prolonged 30+ days stay. Also, from the graph captions, we expected to see the sum of all observation periods.
So my questions are:
are those analysis supposed to consider only the first observation period? if so, what are they showing?
Thanks a lot!
-- 106	Length of observation (days) of first observation period by gender
--HINT DISTRIBUTE_ON_KEY(gender_concept_id)
CREATE TABLE sandbox_gov_hdsb_omop_tmp.jeablzyvrawData_106
 STORED AS PARQUET AS
SELECT
p.gender_concept_id, op.count_value
FROM
(
  select person_id, DATEDIFF(CASE TYPEOF(op.observation_period_end_date ) WHEN 'TIMESTAMP' THEN CAST(op.observation_period_end_date  AS TIMESTAMP) ELSE TO_UTC_TIMESTAMP(CONCAT_WS('-', SUBSTR(CAST(op.observation_period_end_date  AS STRING), 1, 4), SUBSTR(CAST(op.observation_period_end_date  AS STRING), 5, 2), SUBSTR(CAST(op.observation_period_end_date  AS STRING), 7, 2)), 'UTC') END, CASE TYPEOF(op.observation_period_start_date ) WHEN 'TIMESTAMP' THEN CAST(op.observation_period_start_date  AS TIMESTAMP) ELSE TO_UTC_TIMESTAMP(CONCAT_WS('-', SUBSTR(CAST(op.observation_period_start_date  AS STRING), 1, 4), SUBSTR(CAST(op.observation_period_start_date  AS STRING), 5, 2), SUBSTR(CAST(op.observation_period_start_date  AS STRING), 7, 2)), 'UTC') END) as count_value,
    ROW_NUMBER() over (PARTITION by op.person_id order by op.observation_period_start_date asc) as rn
  from sandbox_gov_hdsb_omop_dev.observation_period op
) op
JOIN sandbox_gov_hdsb_omop_dev.person p on op.person_id = p.person_id
where op.rn = 1
;