After runing Achilles for a while using the next configuration:
DatabaseConnector JDBC drivers downloaded to ‘/application/jdbcDrivers’.
connectionDetails ← createConnectionDetails(
- dbms=“postgresql”,
- server=“hsc-ctsc-achilles.health.unm.edu/truven”,
- user=“ouruser”,
- password=‘pwd567’,
- port=“5432”)
achilles(connectionDetails,
- cdmDatabaseSchema = “mdcr2003_2016”,
- resultsDatabaseSchema = “atlas_results”,
- scratchDatabaseSchema = “achilles_scratch”,
- vocabDatabaseSchema = “mdcr2003_2016”,
- numThreads = 1,
- sourceName = “AchilesAtlas”,
- cdmVersion = “5.0.1”,
- runHeel = FALSE,
- runCostAnalysis = FALSE,
- tempAchillesPrefix = ‘ta’,
- optimizeAtlasCache = TRUE,
- createIndices = TRUE)
I got the next messages:
2021-10-16 07:04:29 Analysis 2003 (Number of patients with at least 1 Visit) – START
|======================================================================| 100%
Executing SQL took 10.8 mins
2021-10-16 07:15:19 [Main Analysis] [COMPLETE] 2003 (10.827925 mins)
2021-10-16 07:15:19 Analysis 2100 (Number of persons with at least one device exposure, by device_concept_id) – START
|======================================================================| 100%
Executing SQL took 1.74 mins
2021-10-16 07:17:03 [Main Analysis] [COMPLETE] 2100 (1.739639 mins)
2021-10-16 07:17:03 Analysis 2101 (Number of device exposure records, by device_concept_id) – START
|======================================================================| 100%
Executing SQL took 37.3 secs
2021-10-16 07:17:41 [Main Analysis] [COMPLETE] 2101 (37.282221 secs)
2021-10-16 07:17:41 Analysis 2102 (Number of persons by device records start month, by device_concept_id) – START
|======================================================================| 100%
Executing SQL took 2.44 mins
2021-10-16 07:20:07 [Main Analysis] [COMPLETE] 2102 (2.439798 mins)
2021-10-16 07:20:07 Analysis 2104 (Number of persons with at least one device exposure, by device_concept_id by calendar year by gender by age decile) – START
|======================================================================| 100%
Executing SQL took 2.97 mins
2021-10-16 07:23:05 [Main Analysis] [COMPLETE] 2104 (2.973323 mins)
2021-10-16 07:23:05 Analysis 2105 (Number of device exposure records, by device_concept_id by device_type_concept_id) – START
|======================================================================| 100%
Executing SQL took 40.8 secs
2021-10-16 07:23:46 [Main Analysis] [COMPLETE] 2105 (40.799523 secs)
2021-10-16 07:23:46 Analysis 2106 (Distribution of age by device_concept_id) – START
|======================================================================| 100%
Executing SQL took 2.36 mins
2021-10-16 07:26:08 [Main Analysis] [COMPLETE] 2106 (2.360426 mins)
2021-10-16 07:26:08 Analysis 2110 (Number of device_exposure records outside valid observation period) – START
|======================================================================| 100%
Executing SQL took 26.5 secs
2021-10-16 07:26:34 [Main Analysis] [COMPLETE] 2110 (26.472011 secs)
2021-10-16 07:26:34 Analysis 2125 (Number of device_exposure records by device_source_concept_id) – START
|======================================================================| 100%
Executing SQL took 39.5 secs
2021-10-16 07:27:14 [Main Analysis] [COMPLETE] 2125 (39.502346 secs)
2021-10-16 07:27:14 Analysis 2130 (Number of device_exposure records inside a valid observation period) – START
|======================================================================| 100%
Executing SQL took 31.1 secs
2021-10-16 07:27:45 [Main Analysis] [COMPLETE] 2130 (31.059273 secs)
2021-10-16 07:27:45 Analysis 2131 (Proportion of people with at least one device_exposure record outside a valid observation period) – START
|======================================================================| 100%
Executing SQL took 56.8 secs
2021-10-16 07:28:42 [Main Analysis] [COMPLETE] 2131 (56.832927 secs)
2021-10-16 07:28:42 Analysis 2132 (Proportion of device_exposure records outside a valid observation period) – START
|======================================================================| 100%
Executing SQL took 36.3 secs
2021-10-16 07:29:18 [Main Analysis] [COMPLETE] 2132 (36.277576 secs)
2021-10-16 07:29:18 Analysis 2191 (Percentage of total persons that have at least x device exposures) – START
|======================================================================| 100%
Executing SQL took 1.52 mins
2021-10-16 07:30:49 [Main Analysis] [COMPLETE] 2191 (1.517505 mins)
2021-10-16 07:30:49 Analysis 2200 (Number of persons with at least one note by note_type_concept_id) – START
|======================================================================| 100%
Executing SQL took 0.328 secs
2021-10-16 07:30:49 [Main Analysis] [COMPLETE] 2200 (0.328335 secs)
2021-10-16 07:30:49 Analysis 2201 (Number of note records, by note_type_concept_id) – START
|======================================================================| 100%
Executing SQL took 0.0182 secs
2021-10-16 07:30:49 [Main Analysis] [COMPLETE] 2201 (0.018860 secs)
2021-10-16 07:31:37 Merging scratch Achilles tables
|=================================== | 50%2021-10-16 07:31:37 Merging scratch Achilles tables [ERROR] (Error in FALSE: Error executing SQL:
org.postgresql.util.PSQLException: ERROR: relation “s_ta_1203” does not exist
** Position: 81020**
An error report has been created at //errorReportSql.txt
)
2021-10-16 07:31:37 Done. Achilles results can now be found in schema atlas_results
Connecting using PostgreSQL driver
| | 0%Error: Error executing SQL:
org.postgresql.util.PSQLException**: ERROR: relation “atlas_results.achilles_results” does not exist**
An error report has been created at //errorReportSql.txt
Run rlang::last_error() to see where the error occurred.
What creates that achilles_results within atlas_results?
do I need to restart the whole process? Is there a way to restart from the error I got?
What means that error : relation “s_ta_1203” does not exist
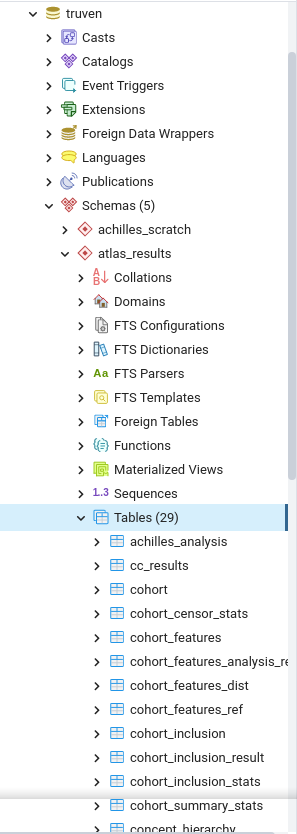
The next picture show the truven database and related schemes to work with Achilles:
Thanks
Jose