OHDSI Home | Forums | Wiki | Github

Question(s) about OHDSI Analysis Viewer (HowOftenApp) and data

I’m using the OHDSI Analysis Viewer (sourced from https://github.com/OHDSI/HowOftenApp). A few questions:

  • Is this the application/version I should be using for a study I’m running using Strategus (the study is similar to what was done in the HowOften meeting)?
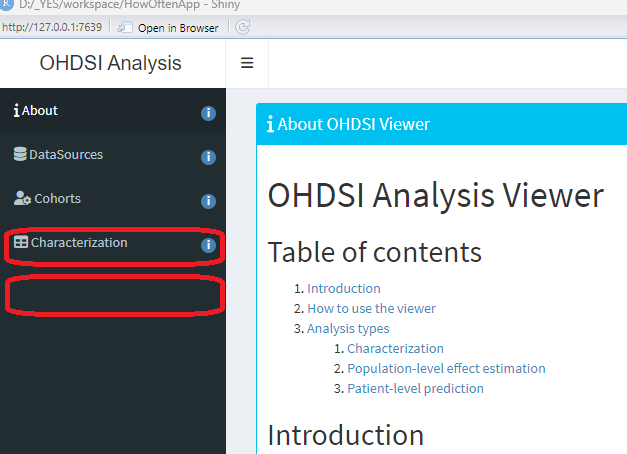
  • I’m not seeing how to get to data for Population effect estimation. There is a link for Characterization but not for Population effect estimation (I would expect it would be in the empty red box).
    image
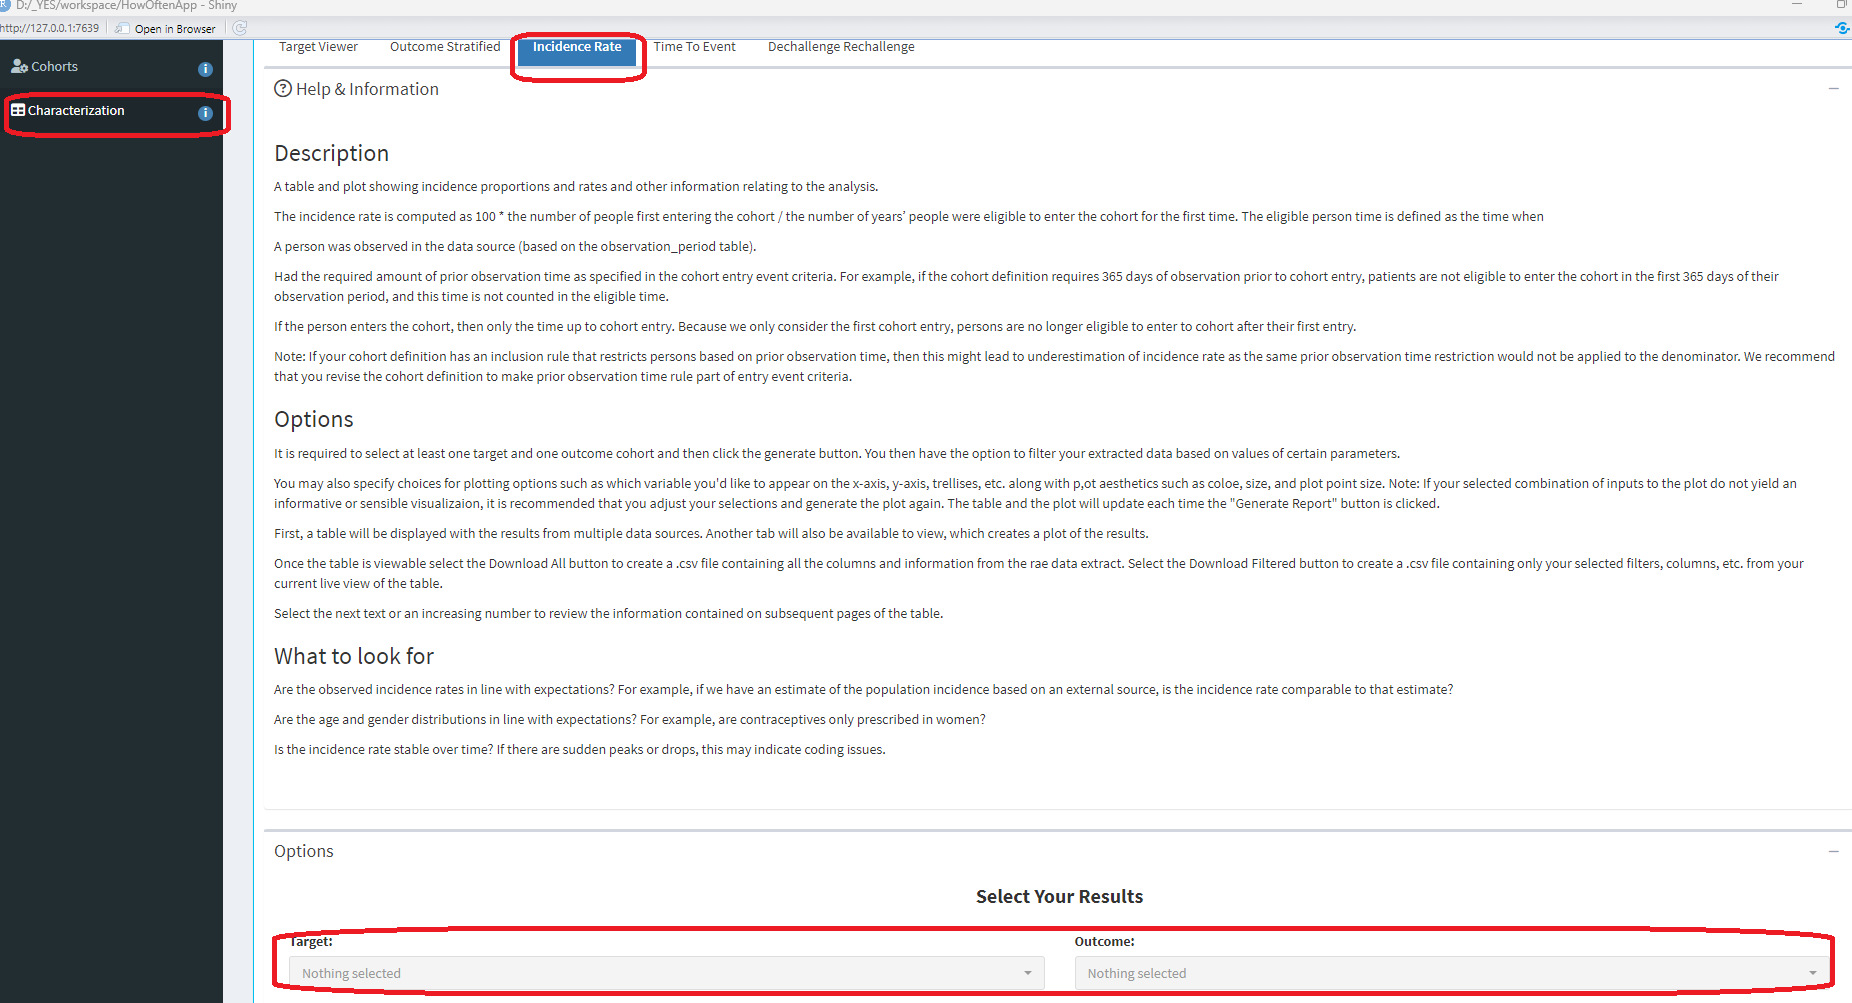
  • Also, I’m not seeing data for the target or outcome picklists (I do see data for data sources and cohorts an my 3 cohorts appear and have patients associated with them). Is there a way I can tell what tables need to be populated for the characterization incedence rate tables/visualizations?

@greshje : If you are looking for an example of OHDSI Shiny viewer in Strategus that shows other modules beyond just CohortIncidence, I suggest you explore one of the Sisyphus Challenge studies: https://data.ohdsi.org/AntiVegfKidneyFailure/ and https://data.ohdsi.org/FluoroquinoloneAorticAneurysm/, which have results for characterization, estimation, and prediction. Note, the Shiny viewer has been under active development by @jpegilbert @jennareps @nathanh36 and others, so they may point you to an even more recent version as well.

Thanks Patrick! I think I’ve found most of what I need with the help of Sena. I’ll post more details here when I get this resolved.

t