I’m running Achilles against my production database of about 1.5 million patients. This step has been running for about 24 hours.
  |===============================================================================================================| 100%
Executing SQL took 1.47 mins
2022-05-29 21:18:45   [Main Analysis] [COMPLETE] 1814 (1.471732 mins)
2022-05-29 21:18:45   Analysis 1815 (Distribution of numeric values, by measurement_concept_id and unit_concept_id) -- START
  |================                                                                                               |  14%
When I run Achilles against my test data set of 2,500 patients this step takes about a minute.
The following two steps (shown below) take about 10 minutes each for the 2,500 patient data set.
  |=========================================================================================================================================| 100%
Executing SQL took 38.8 secs
2022-05-30 15:48:22   [Main Analysis] [COMPLETE] 1815 (38.786878 secs)
2022-05-30 15:48:22   Analysis 1816 (Distribution of low range, by measurement_concept_id and unit_concept_id) -- START
 |=========================================================================================================================================| 100%
Executing SQL took 9.6 mins
2022-05-30 15:57:58   [Main Analysis] [COMPLETE] 1816 (9.601678 mins)
2022-05-30 15:57:58   Analysis 1817 (Distribution of high range, by measurement_concept_id and unit_concept_id) -- START
  |=========================================================================================================================================| 100%
Executing SQL took 10.1 mins
2022-05-30 16:08:03   [Main Analysis] [COMPLETE] 1817 (10.084492 mins)
2022-05-30 16:08:03   Analysis 1818 (Number of measurement records below/within/above normal range, by measurement_concept_id and unit_concept_id) -- START
  |=========================================================================================================================================| 100%
Is this performance typical?
I believe I have all of the indexes in place that are created by the CMD 5.4 scripts but I’m not sure.
Is there anything that can be done to improve the performance of these steps?
If we try to run multithreaded we get the errors shown below (full output is attached).
> Achilles::achilles(
+   cdmVersion = cdmVersion,
+   connectionDetails = connectionDetails,
+   cdmDatabaseSchema = cdmDatabaseSchema,
+   resultsDatabaseSchema = resultsDatabaseSchema,
+   numThreads = 5
+ )
Connecting using SQL Server driver
2022-05-30 18:11:31   Beginning multi-threaded execution
Connecting using SQL Server driver
  |=========================================================================================================================================| 100%
Executing SQL took 0.073 secs
2022-05-30 18:11:32   Dropping scratch Achilles tables from schema synthea_micro_achilles_results.dbo
  |                                                                                                                                         |   0%2022-05-30 18:11:37  Thread 1 returns error: "object 'user' not found" when using argument(s): IF OBJECT_ID('synthea_micro_achilles_results.dbo.tmpach_0', 'U') IS NOT NULL DROP TABLE synthea_micro_achilles_results.dbo.tmpach_0;
Thread 1 returns error: "object 'user' not found" when using argument(s): IF OBJECT_ID('synthea_micro_achilles_results.dbo.tmpach_0', 'U') IS NOT NULL DROP TABLE synthea_micro_achilles_results.dbo.tmpach_0;
2022-05-30 18:11:37   Thread 2 returns error: "object 'user' not found" when using argument(s): IF OBJECT_ID('synthea_micro_achilles_results.dbo.tmpach_1', 'U') IS NOT NULL DROP TABLE synthea_micro_achilles_results.dbo.tmpach_1;
Thread 2 returns error: "object 'user' not found" when using argument(s): IF OBJECT_ID('synthea_micro_achilles_results.dbo.tmpach_1', 'U') IS NOT NULL DROP TABLE synthea_micro_achilles_results.dbo.tmpach_1;
  |=
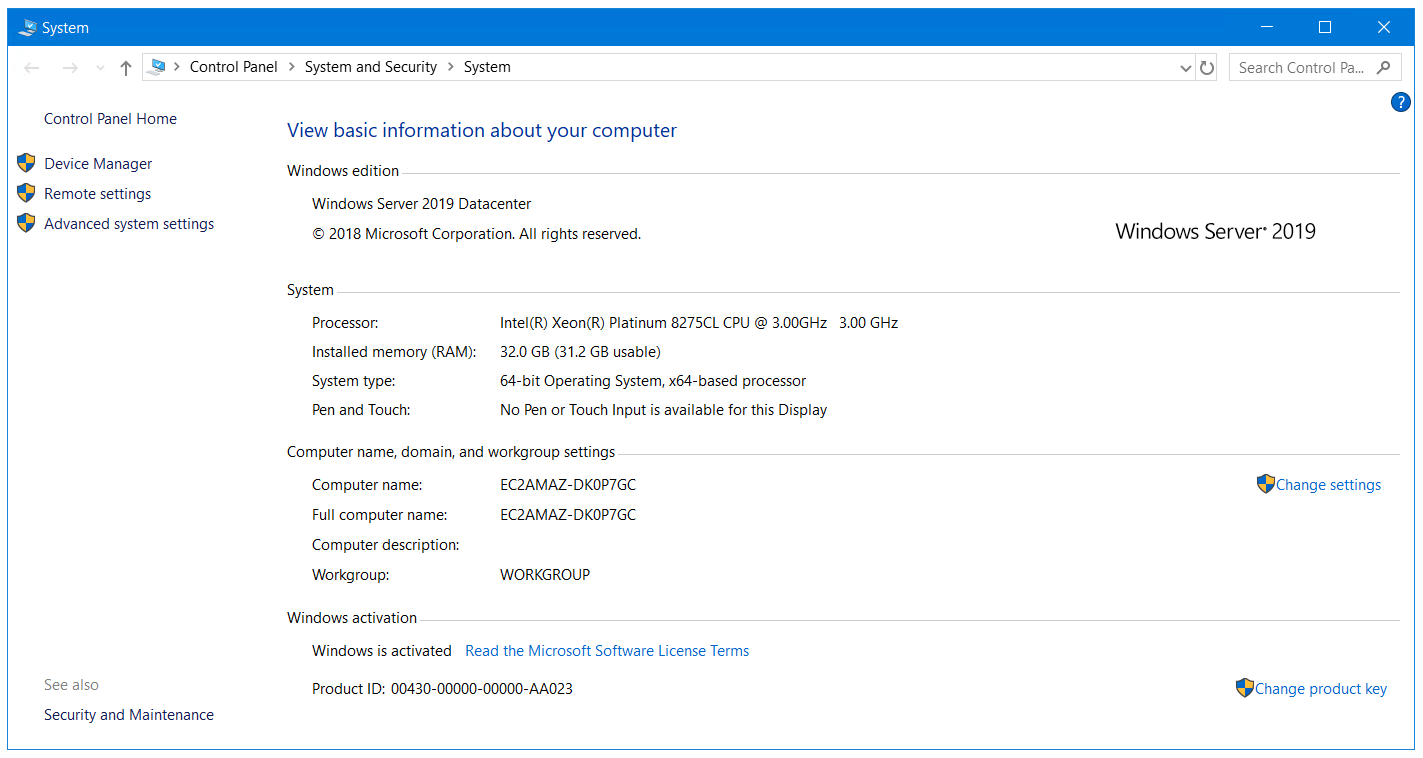
We’re running this on an AWS c5.4xlarge. Specs are shown below. When the long running process is active about 50% of the cpu and 90% of memory is being used.
Thanks,
John