Team Members: @Juan_Banda, @bill.baumgartner
The goal of our Phenotype Phebruary post was to construct, characterize, and compare depression cohorts built using rule-based and probabilistic/heuristic-based methods. It is our hope that by the end of this post we will have phe-iqued your curiosity and demonstrated how these methods can be combined to create more robust phenotype definitions than when used independently.
Depression
Depression is the most common psychiatric disorder that affects the general population with over 264 million people worldwide currently living with depression (ADAA, 2022). Symptoms of depression vary widely based on sex and age. While primary care providers are familiar with the symptoms of depression, over 60% of primary care patients with a previous depression diagnosis also present with somatic symptoms like head and backache, and chronic pain, which makes detection of depression more difficult (PMID:16163400; PMID:10536124). Without screening, only 50% of patients with major depression will be identified (PMID:19640579). This is most often due to fear; patients often withhold information about their depressive symptoms out of fear of being stigmatized (PMID:21911763).
Phenotype Phebruary Objectives
Traditionally, computational phenotypes have largely been expert-defined and have leveraged structured EHR data. More recently, development has shifted towards automated machine learning-based approaches. Each of these approaches has its advantages and disadvantages and we have designed our Phenotype Phebruary exercise to compare two such methods. Our primary objective was to construct, characterize, and compare depression cohorts built using rule-based (Atlas – i.e., gold standard) and probabilistic/heuristic methods (APHRODITE – i.e., silver standard). Our secondary objective was to showcase how to use an OHDSI tool that has not yet been used in the prior Phenotype Phebruary posts.
Rule-Based Cohort Method - Atlas
Rather than build a new cohort, we searched Atlas (https://atlas-demo.ohdsi.org/) for existing cohorts using the keyword “depression” (which returned a total of 41 entries). We selected the LEGACY Depression cohort ([LEGEND HTN] Persons with depression; #1770038), which was built on February 17, 2019.
The cohort was defined using the following 4 concept sets:
-
Depression
-
Drugs to treat depression
- Antidepressants (21604686)
-
Other indications for drugs used to treat depression
-
Procedures for depression
The clinical logic applied to these concept sets included:
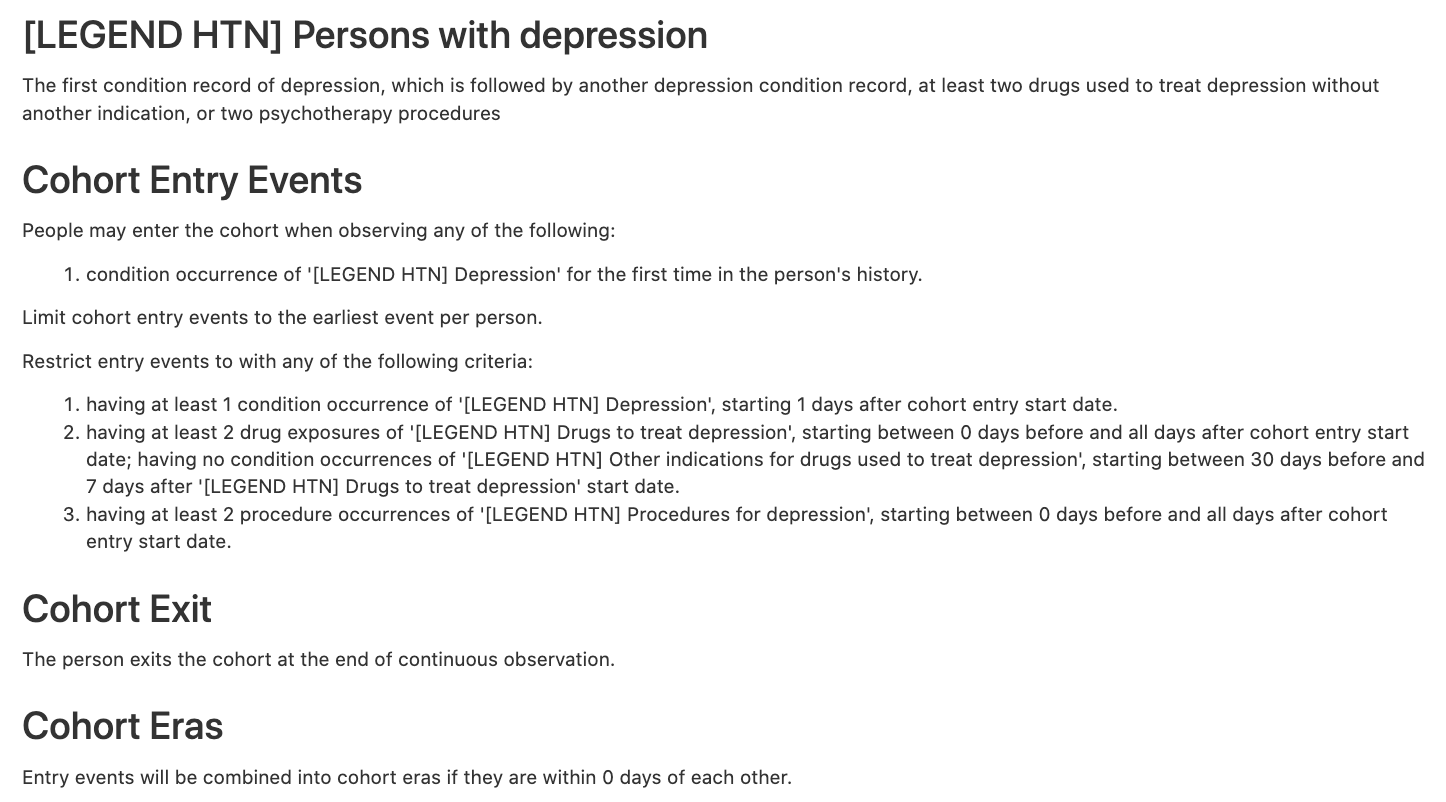
Probabilistic Cohort Method - APHRODITE
APHRODITE (PMC5543379) is an electronic phenotyping R-package/framework that combines the ability to learn from imperfectly labeled data (PMC5070523) and the Anchor learning framework for improving selected features in the phenotype models (PMC4926745), for use with the OHDSI/OMOP CDM. An overview of the APHRODITE approach is shown in Figure 1. This figure and the accompanying description have been taken from the APHRODITE manuscript (PMC5543379).
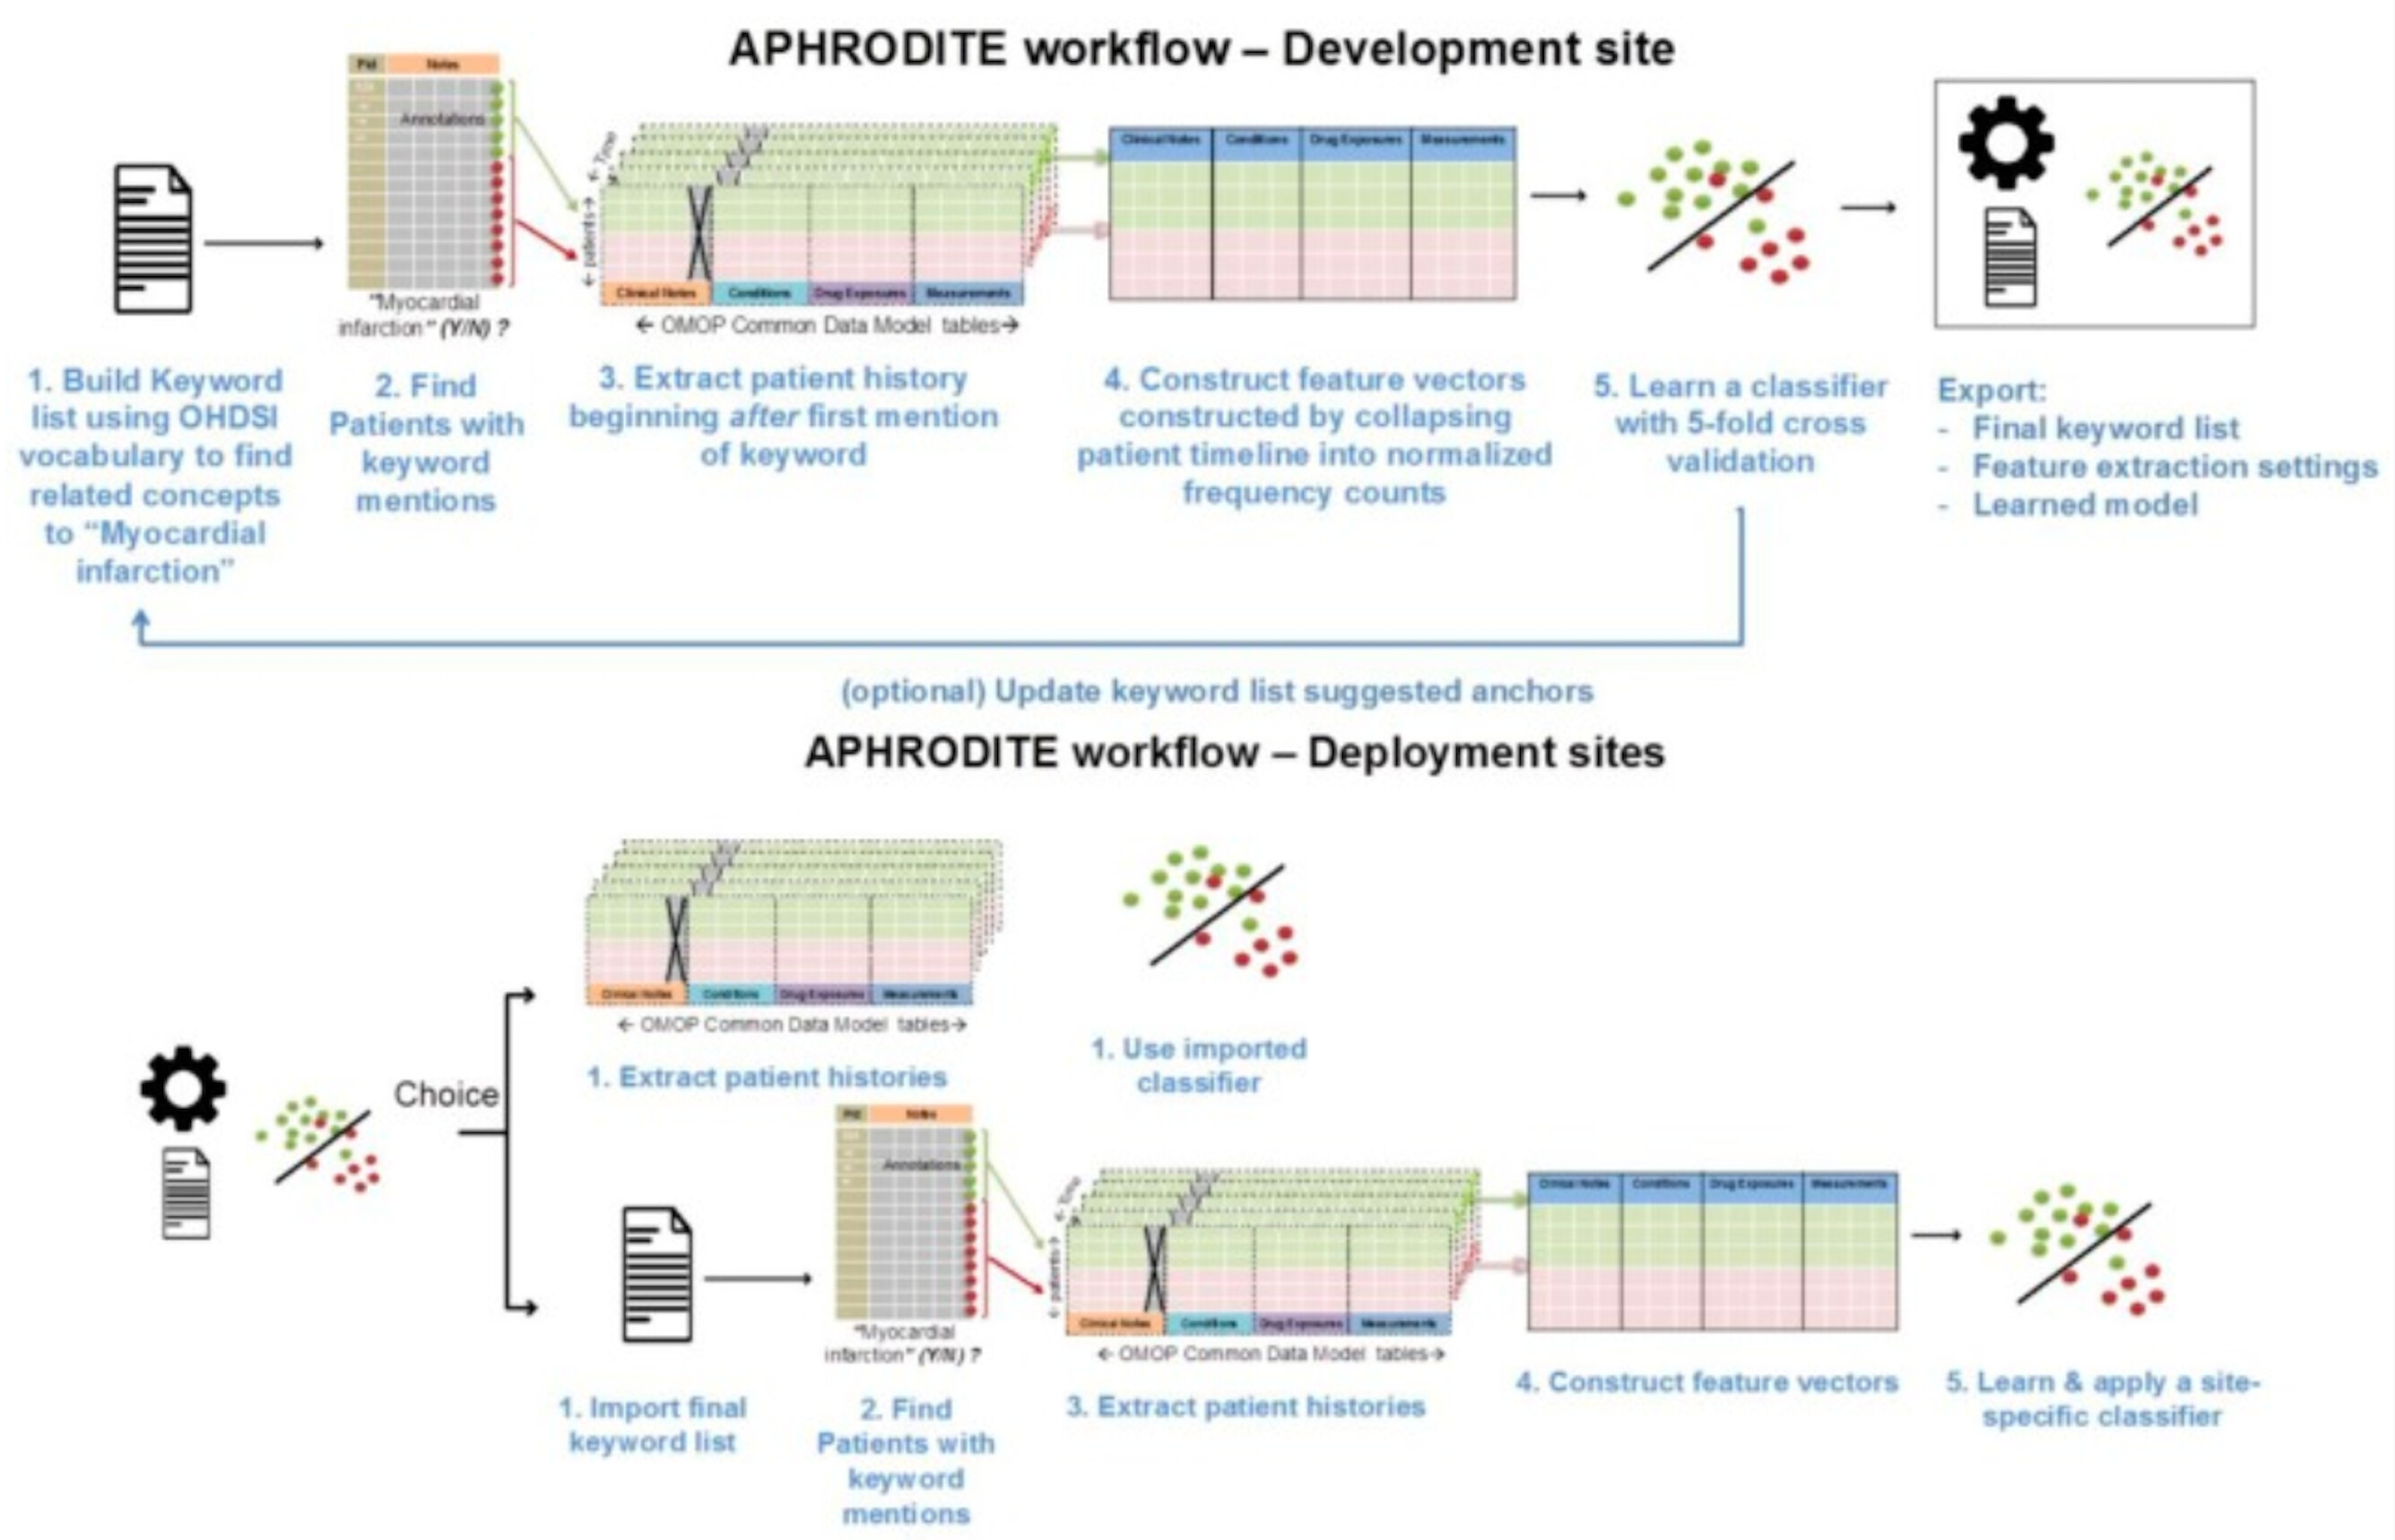
Figure 1. Overview of APHRODITE.
As shown in this figure, the workflow primarily consists of the following two components:
- Initial labeling using the OHDSI vocabulary. To build our initial list of noisy labels, we used the OHDSI vocabulary and looked for the concept we want to build a phenotype for, which in our example case of
Figure 1is Myocardial Infarction (MI). Using the vocabulary tables in the CDM we find all related synonyms and concepts that are related to myocardial infarction as child nodes in the ontologies comprising the vocabulary. Doing so allows us to obtain a broad set of concepts that are related to the phenotype in an automated way. - Iteratively updating the noisy labels with a suggestion tool (Anchor learning). The anchor & learn framework introduces an iterative updating procedure that can be used to refine the set of labels used in a noisy labeling procedure. Once an initial set of anchors is found, they can be bootstrapped, with some human guidance, to find more anchors in a data-driven manner. In the anchor-searching setting, we train a logistic regression classifier with strong L1-regularization to predict the presence or absence of the initial anchors.
The highly positively weighted terms are then presented as additional candidate anchors to a human judge, who determines whether they are indeed good anchors. The human judge has the option to add the anchor to the list of existing anchors and relearn the classifiers, generating a new list of potential anchors. The interaction stops when no more interesting anchors are found by the anchor suggestion tool or a sufficiently performant ML model has been found.
Experimental Design and Findings
Data Source
All experiments were run using a data snapshot from the Stanford clinical data warehouse, which integrates data from Stanford Children’s Health and Stanford Health Care with around 3 million patients. The Stanford data extract has been fully mapped to the OHDSI CDM V5.3 and it is made available internally on a highly indexed and optimized Postgres relational database.
Depression Cohorts
Rule-Based Cohort. As mentioned above, a pre-existing rule-based cohort definition of depression created for the LEGACY study was obtained from Atlas (ATLAS).
Probabilistic Cohort. The APHRODITE (v1.0.0; GitHub - OHDSI/Aphrodite: [in development]) cohort was created by seeding the algorithm with the keyword “depressive disorder”. Please reach out to Juan Banda directly for additional results related to APHRODITE as well for questions about the method. This cohort is obtained by selecting all patients with at least one code from the expanded list acquired from the seed keyword.
Cohort Identification
The total number of patients identified by each cohort method, including the overlap of patients found by both methods, is shown in the Venn Diagram in Figure 2. Note that we will refer to the cohorts in two different ways when presenting our findings:
- Full. Includes all of the patients identified by each method (e.g., for
Atlasthis would include both the pink and purple parts of the Venn Diagram inFigure 2). - Only. Includes those patients identified by only one method (e.g., for
Atlasthis would include only the pink part of the Venn Diagram inFigure 2).
A total of 41,784 patients were found in common by both cohort methods. The APHRODITE Full cohort contained a total of 62,450 patients and the Only cohort contained 20,666 patients. The Atlas Full cohort contained a total of 60,747 patients and the Only cohort contained 18,963 patients. On average, patients in the APHRODITE Full cohort were 52 years old, 66.8% female, and predominantly white (61.7%) at their earliest date of entry into the cohort. With respect to the Atlas Full cohort, on average, patients were 55 years old, 67.2% female, and predominantly white (63.7%) at their earliest date of entry into the cohort.
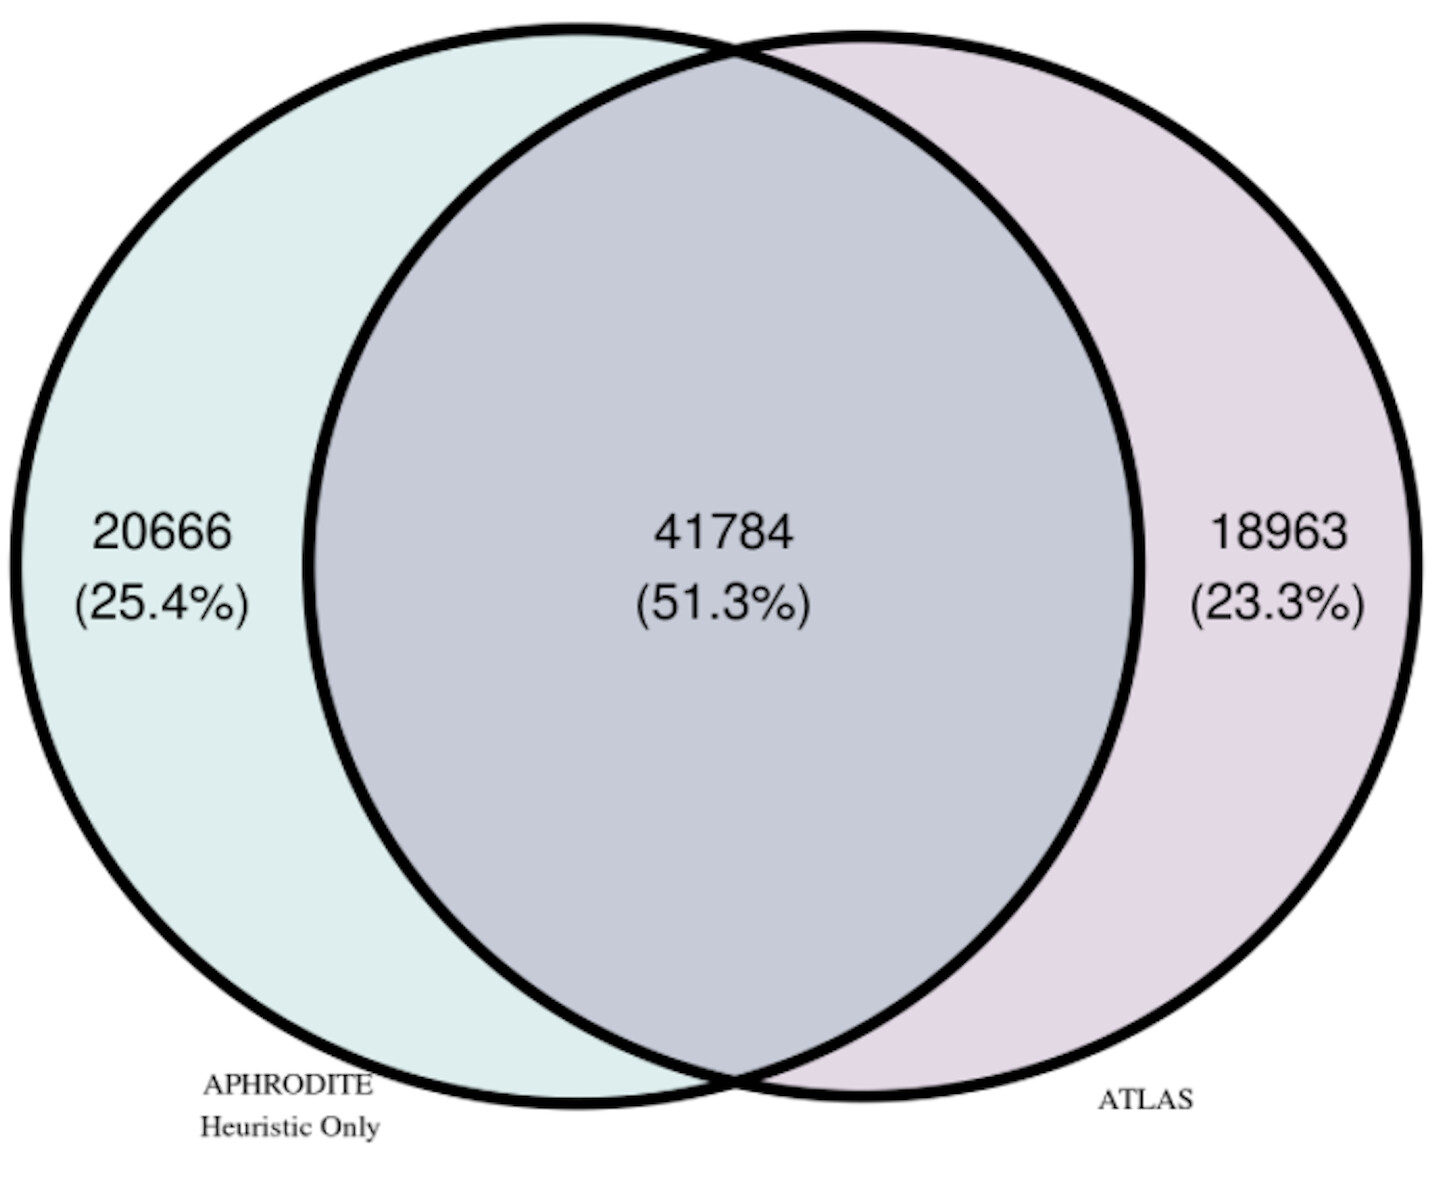
Figure 2. Venn Diagram of Patients by Cohort Method.
Cohort Characterization
Most Frequent Concepts in each Cohort
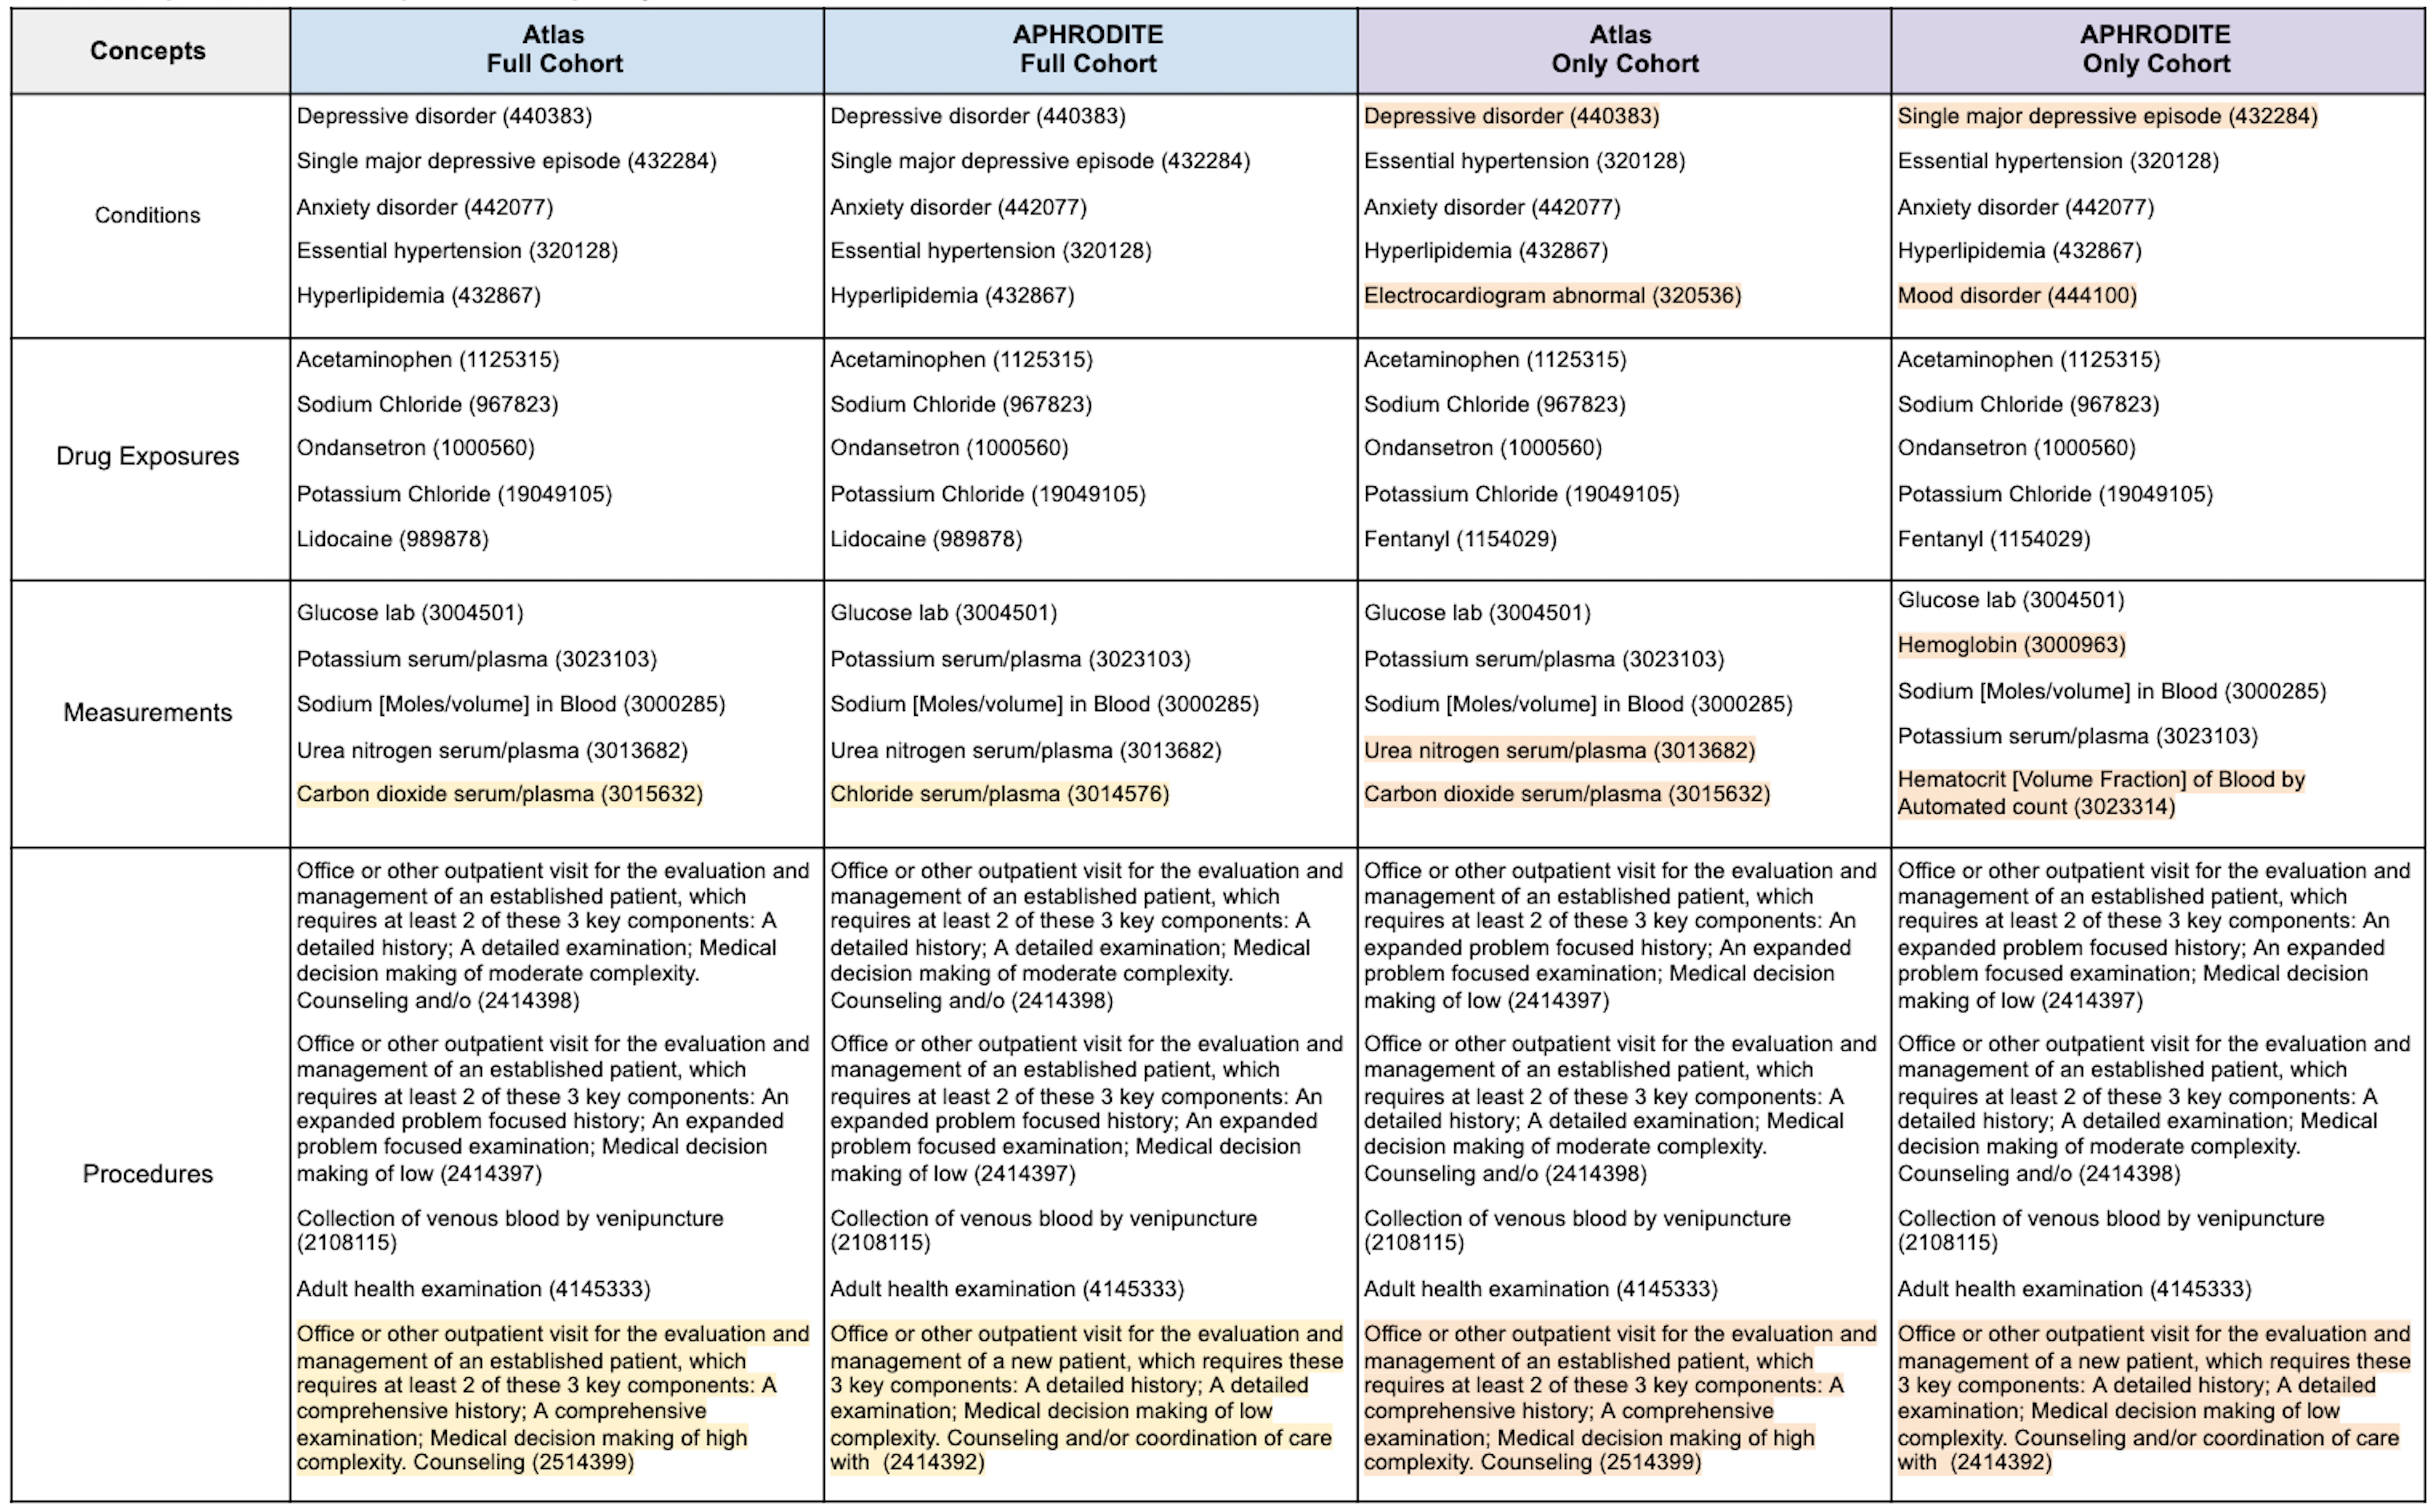
The top-five most frequent features for clinical domain by cohort are presented in Table 1. We examined the most frequent terms because they provide a means for quickly verifying assumptions with respect to what we would expect to see and not expect to see. To help with interpreting the table, we highlighted the features that were different between the Atlas and APHRODITE Full cohorts in yellow and the Atlas and APHRODITE Only cohorts in orange.
Full Cohorts. When examining the Full cohorts, all of the top-five most frequent condition and drug exposure features were the same. For measurement and procedure features, all but one feature from each domain were the same. While the procedure features had different CPT codes, they were very similar features. For measurements, the concepts that differed were carbon dioxide serum/plasma (3015632) in Atlas and chloride serum/plasma (3014576) in APHRODITE.
Only Cohorts. When examining the Only cohorts, only the top-five most frequent drug exposure features were the same. For conditions, the cohorts differed on two features: Depressive disorder (440383) and Electrocardiogram abnormal (320536) for Atlas and Single major depressive episode (432284) and Mood disorder (444100) for APHRODITE. For measurements, the cohorts differed on two features: urea nitrogen serum/plasma (3013682) and carbon dioxide serum/plasma (3015632) for Atlas and hemoglobin ( 3000963) and Hematocrit [Volume Fraction] of Blood by Automated count (3023314) for APHRODITE. The same procedure feature set differences observed in the Full cohorts were also observed here.
Observing that the majority of the most frequent features in each cohort were the same, even when looking at features for the patients in the Only cohorts, was very exciting. They highlight the ability of the probabilistic/heuristic method (i.e., APHRODITE) to identify patients who have the majority of the same highly relevant features as the patients in the gold standard Atlas cohorts.
Table 1. Top-Five Most Frequent Concepts by Clinical Domain for each Cohort.
Most Frequent Concepts Unique to each Cohort
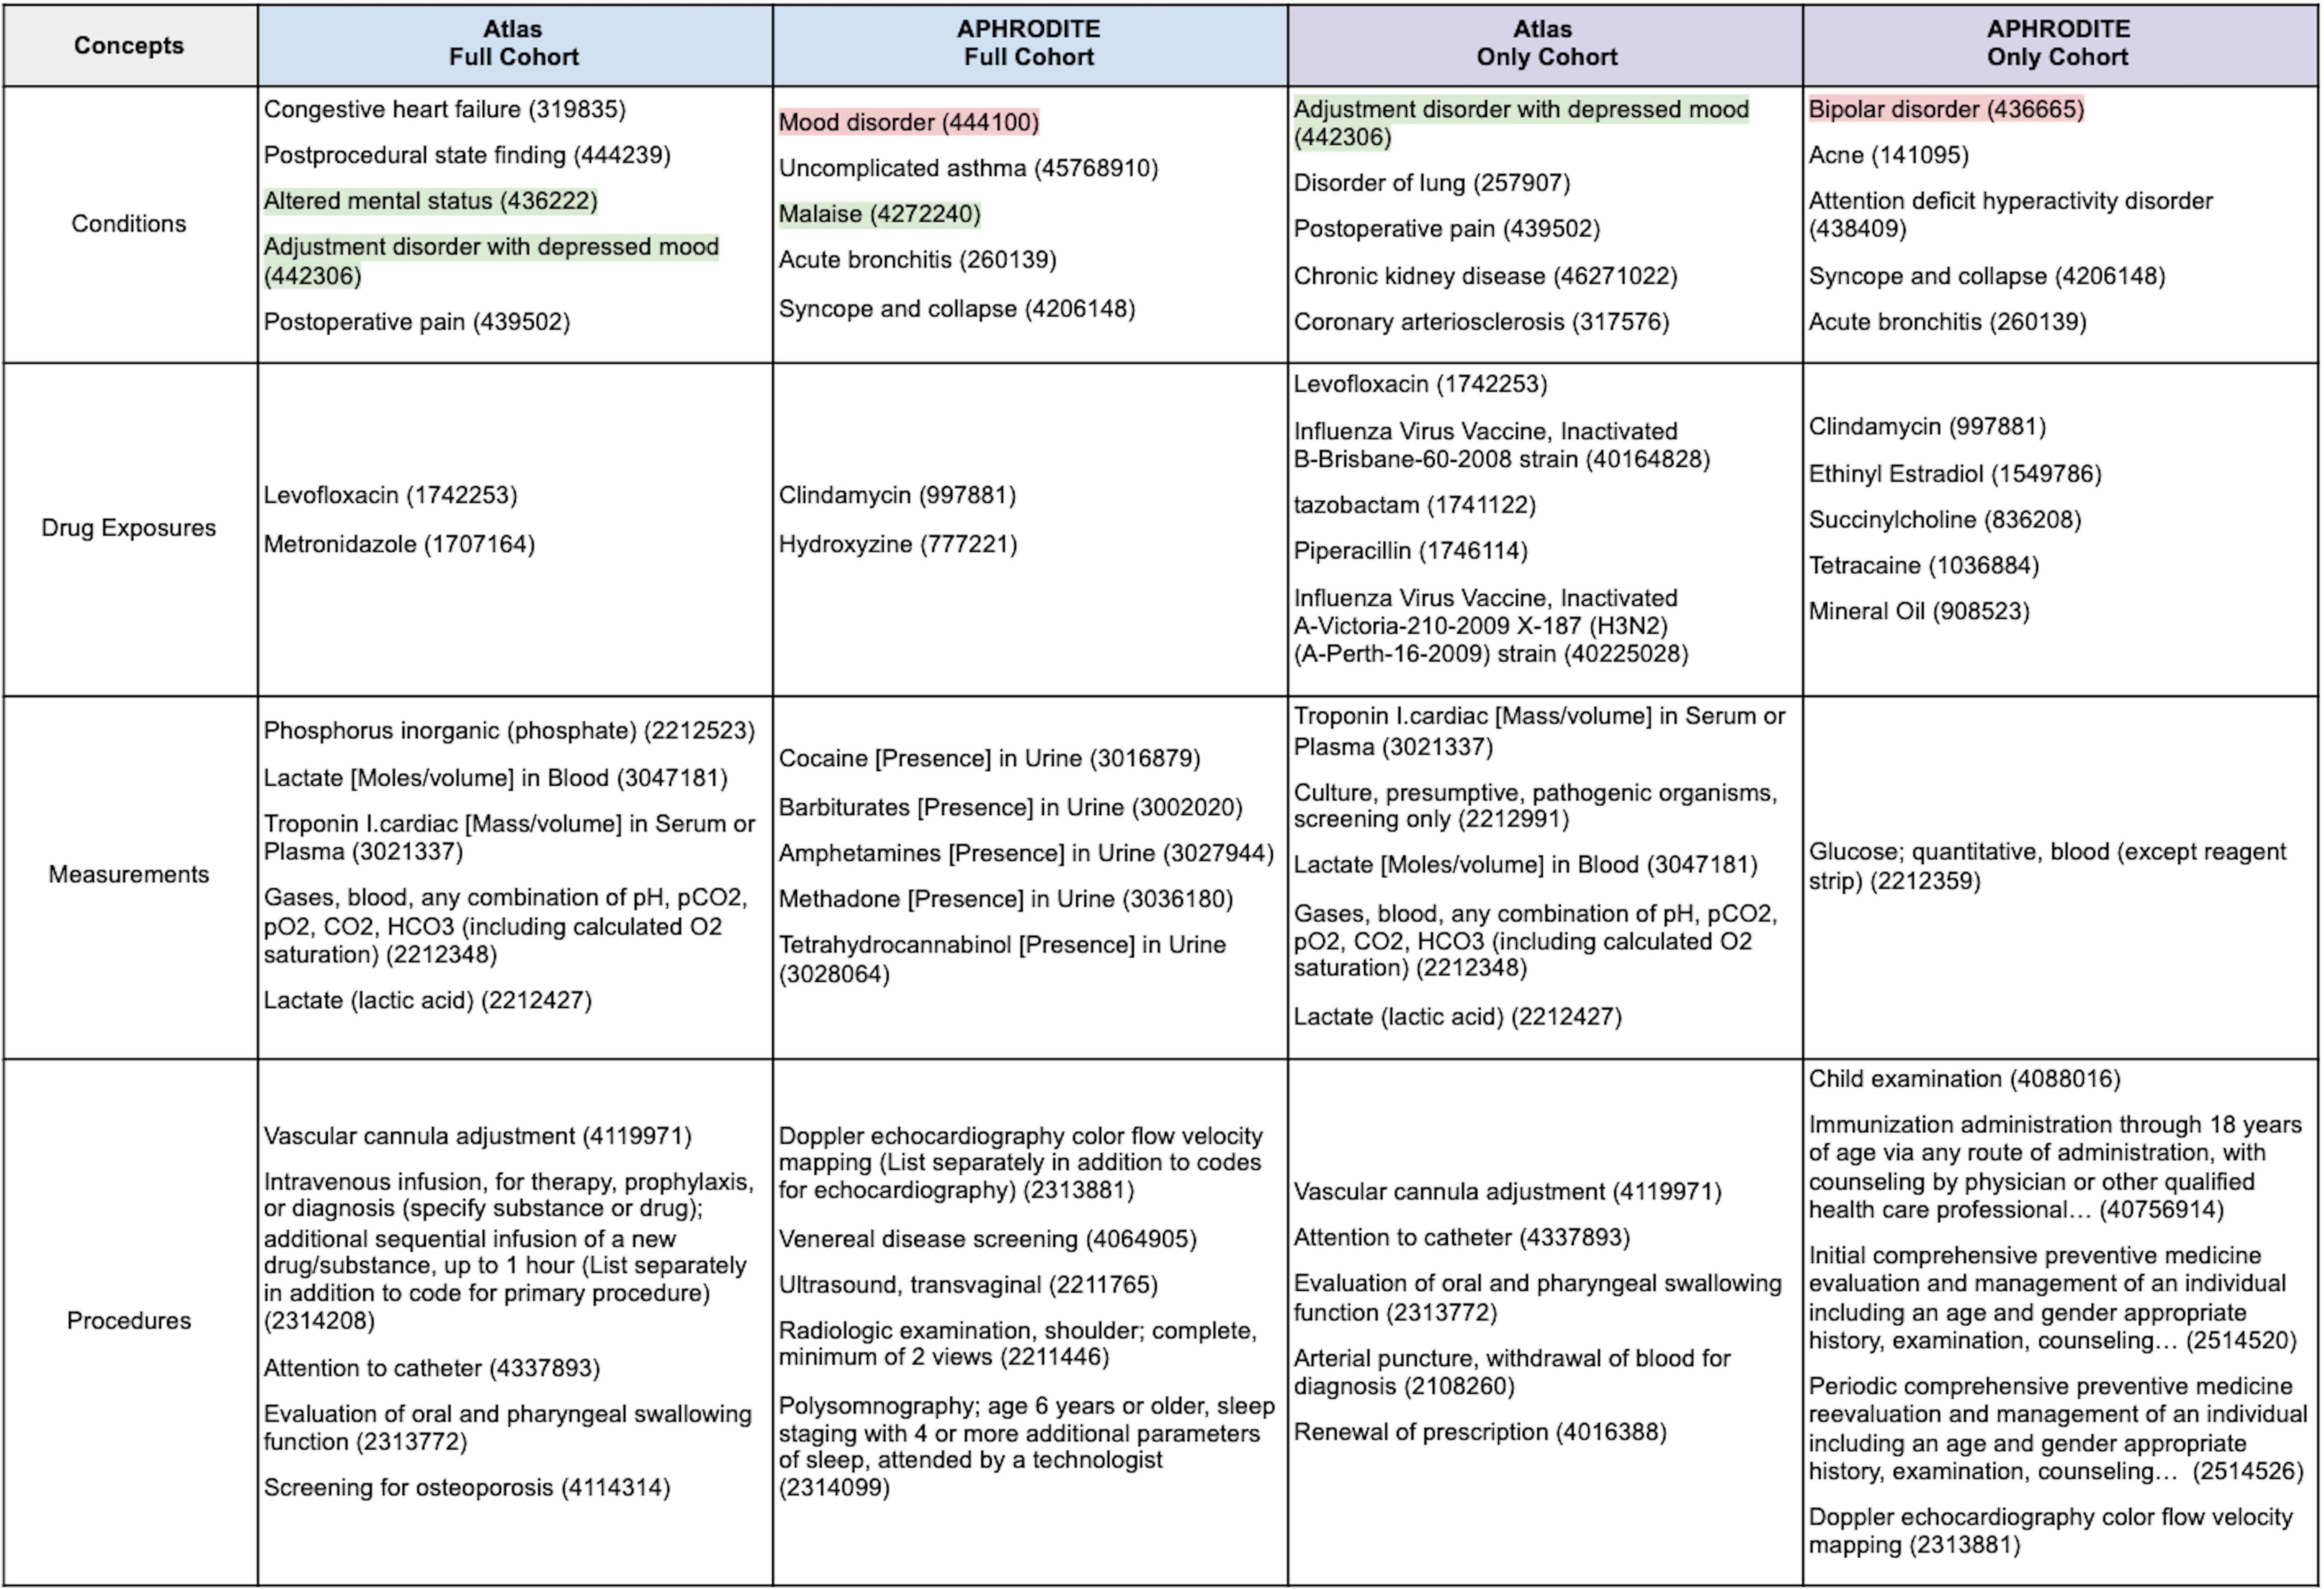
We also examined the concepts that were unique to each cohort (Table 2). Looking only at those clinical features that are common can make the identification of relevant and/or meaningful clinical patterns challenging. Additionally, identifying clinical features that are unique to each cohort could present potential avenues for deeper characterization and lead to the identification of differential diagnostic features (ideally).
Although we report the most frequent concepts by clinical domain in Table 2, for brevity we will focus specifically on interpreting what the condition features mean. The concepts highlighted in green (i.e., Altered mental status - 436222 and Adjustment disorder with depressed mood - 442306) are those that jump out immediately as being relevant to depression. What’s more interesting are the concepts that are not immediately obvious (unless you are an expert in this area). Some of these features are highlighted below:
Cardiovascular Disease
- Congestive heart failure (319835) – Identified in the
AtlasFull cohortPatients with congestive heart failure (CHF) have clinically significant depression at a rate 2- to 3-times higher than those of the general population, and depression creates barriers to successful CHF treatment (eg, more frequent adverse clinical events and hospitalizations, twice the risk of mortality). Depression increases the risk of CHF, particularly in those with risk factors for CHF, such as systolic hypertension (PMID:24392265).
- Coronary arteriosclerosis (317576) – Identified in the
AtlasOnly cohortBoth biological and behavioral mechanisms have been proposed to explain the link between depression and CHD. In comparison with nondepressed individuals, depressed patients with CHD frequently have higher levels of biomarkers found to predict cardiac events or promote atherosclerosis (Circulation, 2008).
Postoperative Complications
- Postprocedural state finding (444239) – Identified in the
AtlasFull cohortThe suppression of the immune system in depressive disorders may expose the patients to increased rates of postoperative infections and increased mortality from cancer (PMID:26830195).
- Postoperative pain (439502) – Identified in the
AtlasFull and Only cohortsDepression is commonly associated with cognitive impairment, which may be exacerbated postoperatively. There is evidence that acute postoperative pain causes depression and depression lowers the threshold for pain. Depression is also a strong predictor and correlate of chronic post-surgical pain (PMID:26830195).
Chronic Disease
- Disorder of lung (257907) – Identified in the
AtlasOnly cohortIn patients with chronic lung disease, symptoms of depression are inversely related to lung function. Moreover, depression is associated with a poor prognosis in patients with obstructive lung disease, conferring a greater risk of exacerbation and possibly death (PMID:30140153).
- Chronic kidney disease (46271022) – Identified in the
AtlasOnly cohortRecent studies have shown that patients with chronic kidney disease (CKD) who are not on dialysis have rates of depression up to 3 times higher than those in the general population (PMID:29318209).
- Uncomplicated asthma (45768910) – Identified in the
APHRODITEFull cohortDepression is one of the most prevalent psychological problems in allergic patients, though it is often regarded as a somewhat ‘natural reaction’ to the diagnosis of a significant illness such as asthma. However, while sadness and mild depression may be considered a fairly normal response to a diagnosis of chronic illness, more severe, chronic depression can lead to serious consequences for persons with asthma (PMID:16185365).
Psychiatric Disorders
- Attention deficit hyperactivity disorder (438409) – Identified in the
APHRODITEOnly cohortAs depression in the context of ADHD is often more severe and impairing, there is also evidence that this comorbidity complicates the treatment of both disorders (PMID:26089578).
Other Symptoms
- Syncope and collapse (4206148) – Identified in the
APHRODITEFull and Only cohortsSeveral studies have demonstrated that psychiatric disorders such as anxiety, depression and panic attack are associated with syncope, especially vasovagal and unexplained syncope (US) (PMID:23549800).
- Acne (141095) – Identified in the
APHRODITEOnly cohortForty-two studies were included. We found a significant association of acne vulgaris with depression (r = 0.22 [95% confidence interval 0.17-0.26, P < .00001]) and anxiety (r = 0.25 [95% confidence interval 0.19-0.31, P < .00001]). Subgroup analyses and comparisons showed moderating influences based on factors including age, study setting, and geographic region (PMID: 32088269).
Another advantage of looking at the features that are unique to each cohort is the potential to identify concepts that should be removed. One of the condition features identified in the APHRODITE cohorts was explicitly excluded from the Atlas cohorts (i.e., bipolar disorder 436665). Mood disorder (444100) is another concept that should be considered careful given how broad it is but might be useful for identifying other candidates that should be excluded.
Table 2. Top-Five Most Frequent Concepts Unique to each Cohort by Clinical Domain.
Cohort Evaluation
Model Results
To evaluate each cohort, we then trained and evaluated a random forest model for each cohort using an 80/20 split with 5-fold cross-validation. We matched the selected cases by both the Atlas cohort definition and the APHRODITE heuristic with controls in a 1:1 ratio, matching for age, gender, and length of the record. These controls are non-overlapping with any of the cohorts or between methods. The APHRODITE R package leverages the caret R package to incorporate a wide variety of machine learning models under a standardized set of calls, for this work we used a Random Forest model. The Random Forest results for each cohort are shown in Table 3 with additional information on the most important features for each model shown in Tables 4-5.
Table 3. Random Forest Performance Metrics.
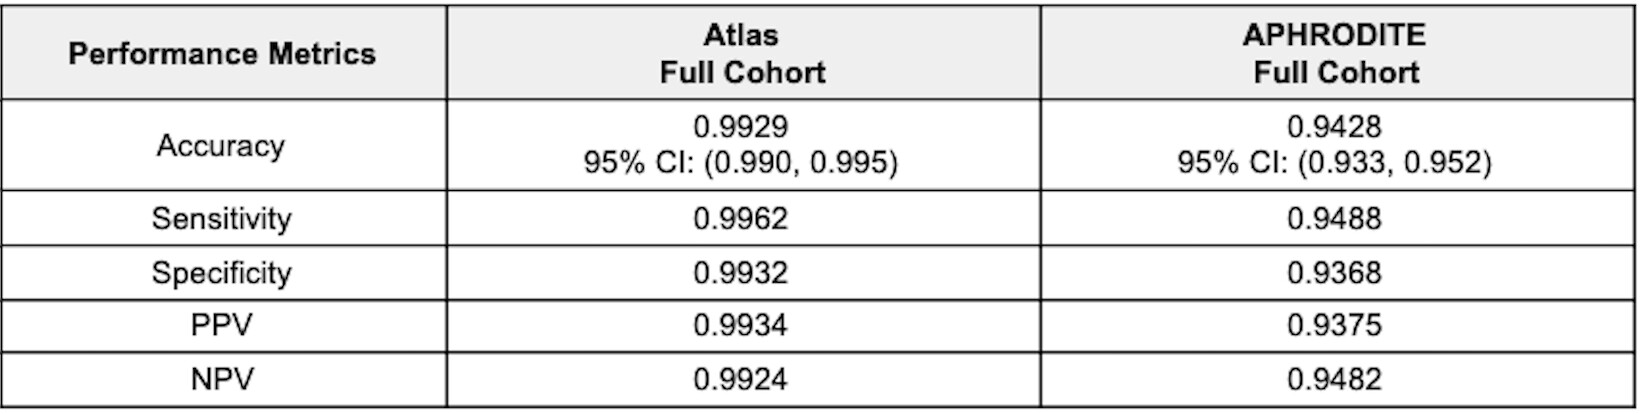
Atlas Cohort. For the full cohort, which included patients that overlapped with the APHRODITE cohort, the test classification accuracy of the random forest model was 99.3%. The model’s sensitivity was estimated to be 99.6% and the specificity to be 99.3%. The 3 most important features were depressive disorder (440383), Office or other outpatient visit for the evaluation and management of an established patient, which requires at least 2 of these 3 key components: A detailed history; A detailed examination; Medical decision making of moderate complexity. Counseling and/o (2414398), and Office or other outpatient visit for the evaluation and management of an established patient, which requires a medically appropriate history and/or examination and low level of medical decision making. When using time for code selection, 20-29 minutes (2414397).
APHRODITE Cohort. For the full cohort, which included patients that overlapped with the Atlas cohort, the test classification accuracy of the random forest model was 94.3%. The model’s sensitivity was estimated to be 94.9% and the specificity to be 93.7%. The 3 most important variables were single major depressive episode (432284), anxiety disorder (442077), and dysthymia (433440). It is important to note that the concept of depressive disorder (440383) was removed from the feature set as this concept was used as the initial cohort selecting heuristic (keyword).
Both models performed well, yielding both highly sensitive and specific cohorts. The model trained on the Atlas cohort yielded slightly better results across all measured metrics. Examining the utility of the models trained on the Full cohorts to classify patients in the opposite Only cohorts (i.e., using the model trained on the Full APHRODITE cohort to classify Atlas Only cohort patients and using the model trained on the Full Atlas cohort to classify APHRODITE Only cohort patients) resulted in some very interesting observations. Using the model trained on the Full APHRODITE cohort, we were able to classify 10,537 (51%), 15,164 (73.4%), and 17,138 (82.9%) Atlas Only cohort patients at 90%, 80%, and 70% certainty, respectively. These findings highlight how a model trained on a noisy cohort can be very good at identifying patients with a certain condition as defined in a rigid rule-based definition. This model can also be used as a means of external validity for an existing gold standard cohort by highlighting highly confident patients (at varying levels of certainty). Using the model trained on the Full Atlas cohort, we were able to classify 256 (1.3%), 777 (4.1%), and 976 (5.2%) APHRODITE Only cohort patients at 90%, 80%, and 70% certainty, respectively. These findings highlight how a model trained on a gold standard cohort, like those produced from Atlas can be applied to identify potentially missed cases by the rigid rule-based definition, and to leverage a ‘noisily defined’ cohort to identify additional relevant patients that would have otherwise been excluded.
Most Important Features
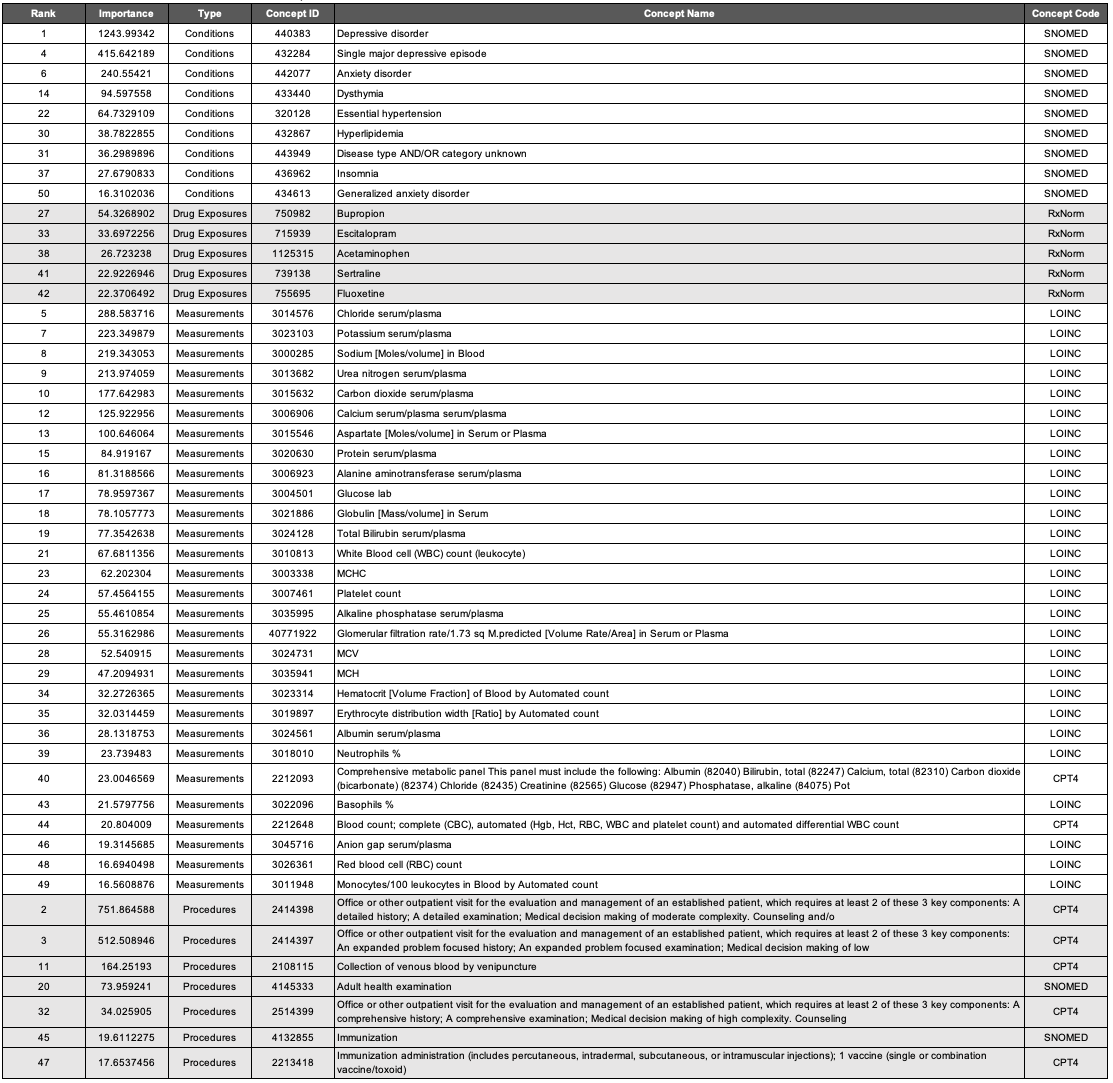
The most important variables for the APHRODITE and Atlas cohort’s models are shown in Table 4 and Table 5, respectively.
Condition Concepts. Comparing the top features of the models trained on the Full cohorts revealed that aside from the keyword heuristic of depressive disorder, the top-three most important features for conditions were the same (i.e., single major depressive disorder 432284, anxiety disorder 442077, and dysthymia 433440). Mood disorder (444100) was a condition concept that was only identified in the APHRODITE Full cohort feature set. Disease AND/OR category unknown (443949) was a condition concept that was only identified in the Atlas Full cohort feature set.
Drug Exposure Concepts. All of the most important features for drug exposures in the APHRODITE Full cohort were identified in the Atlas Full Cohort feature set (i.e., bupropion - 750982, escitalopram - 715939, and sertraline - 739138). Acetaminophen (1125315) and fluoxetine (755695) were two drug exposure concepts that were only identified in the Atlas Full cohort.
Measurement Concepts. There were four measurement concepts that were found in the APHRODITE Full cohort feature set that were not in the Atlas Full cohort (i.e., Thyrotropin [Units/volume] in Serum or Plasma - 3009201; Basophils [#/volume] in Blood by Manual count - 3027651; Hemoglobin - 3000963; and Eosinophils/100 leukocytes in Blood by Automated count - 3010457). There were six measurement concepts that were found in the Atlas Full cohort feature set that were not in the APHRODITE Full cohort (i.e., Erythrocyte distribution width [Ratio] by Automated count - 3019897; Neutrophils % - 3018010; Comprehensive metabolic panel This panel must include the following: Albumin (82040) Bilirubin, total (82247) Calcium, total (82310) Carbon dioxide (bicarbonate) (82374) Chloride (82435) Creatinine (82565) Glucose (82947) Phosphatase, alkaline (84075) Pot - 2212093; Blood count; complete (CBC), automated (Hgb, Hct, RBC, WBC and platelet count) and automated differential WBC count - 2212648; and Anion gap serum/plasma) - 3045716.
Procedure Concepts. All of the most important features for procedures in the Atlas Full cohort were identified in the APHRODITE Full Cohort feature set. 2514419, 4036803, 2414393, 2414392, and 2414394 were procedure concepts that were only identified in the APHRODITE Full cohort. These concepts were related to similar sets of CPT codes for outpatient patient management visits, consultations, and general exams.
Table 4. APHRODITE Full Cohort Random Forest Most Important Features.
Table 5. Atlas Full Cohort Random Forest Most Important Features.
Lessons Learned and Ideas for Future Work
The results, although preliminary, highlight the value of combining a heuristic-based approach (APHRODITE) with a rule-based approach (Atlas) for generating patient cohorts. Specifically, we demonstrated that a model trained on a noisy cohort (i.e., APHRODITE) could be used as a means for validating sets of gold standard patients identified in the Atlas cohort (with varying levels of certainty) as well as to identify potentially missed cases by the Atlas definition. We also demonstrated that a model trained on a gold standard cohort (i.e., Atlas) could be used to identify new plausible patient candidates from a noisy cohort (i.e., APHRODITE) that would have otherwise been excluded.
One obvious way one could leverage the results of these experiments would be to take what we learned from characterizing the cohorts (i.e., examining the most frequent unique concepts unique to each cohort method) to suggest modifications that could be made to the original LEGEND Atlas cohort definition. Although additional analyses are needed and this example will only focus on condition concepts, one concept that was not originally included in the Atlas cohorts was Malaise (4272240). Within the psychiatric literature exists the Malaise Theory of Depression, which proposes that …
the state or emotion of malaise should be considered the core symptom of depression, rather than sadness of mood (PMID:10790737).
This has been confirmed in other studies where malaise was identified as a key symptom for assessing and treating depression (Redirecting; PMID:30587173).
APHRODITE is a purely data-driven approach that allows for both model and ‘build recipe’ sharing between OHDSI network sites, enabling models to be portable and for their performance to be easily compared across network sites (PMID:32374408). This R package (GitHub - OHDSI/Aphrodite: [in development]) could leverage other OHDSI tools like PHOEBE (https://data.ohdsi.org/PHOEBE/) for the keyword-seeding, and Cohort Diagnostics (GitHub - OHDSI/CohortDiagnostics: An R package for performing various cohort diagnostics.) to provide characterizations of the weakly supervised cohorts obtained before model building. Additionally, there is functionally in APHRODITE to take existing Atlas cohorts and build predictive models providing a quick comparison between rule-based and probabilistic phenotypes in a few lines of code.
Limitations and Future Work
This analysis is not without limitations. The current experiments were performed on a single phenotype using only one cohort definition. As mentioned above, we utilized an existing cohort definition made available in Atlas and did not exhaustively explore the utility of the other cohort definitions. It would be both interesting and important to see if we could replicate the current findings on different Atlas definitions for depression. It would also be interesting to run these experiments on other phenotypes. Not only could this help us better understand the value of combining different cohort identification methods, but this exercise could also potentially serve as a means for identifying ways to improve each of the individual methods. We did not perform an extensive evaluation or comparison of the Only cohort patients produced by each method. Having a deeper understanding of how these patients differ could also provide invaluable insight into ways in which each method might be improved within the context of depression. Although not the focus of these experiments, it would also be useful to perform our evaluation using models other than random forest, although we don’t anticipate that this would produce significantly different findings. Finally, it would be both interesting and important to incorporate the use of other OHDSI tools into this workflow, like PHOEBE (specific ideas/use cases briefly mentioned above), which for APHRODITE, could potentially serve as another means for filtering the keyword-based concept sets.