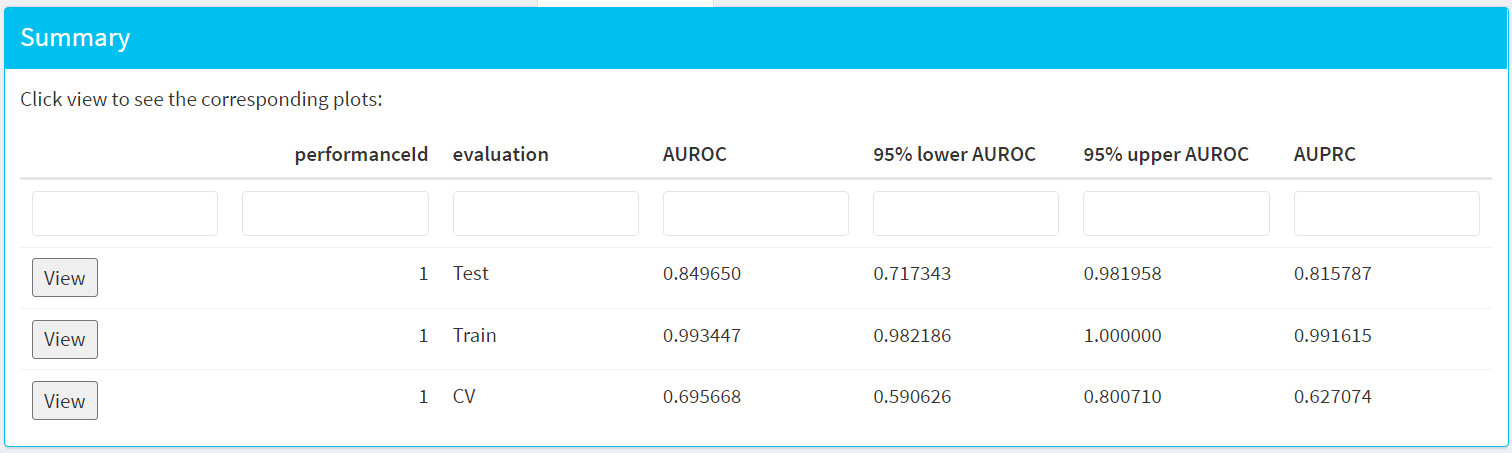
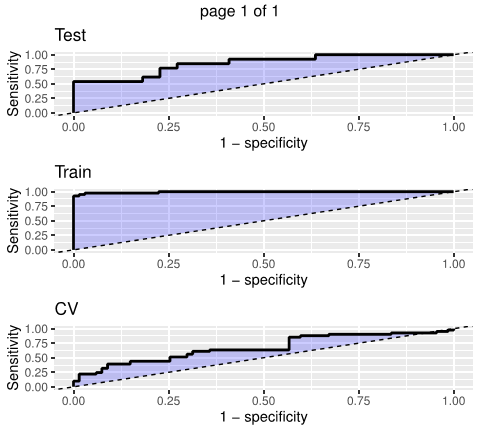
You should look at the test AUC. The CV performance will probably be to optimistic (at least on average) since the hyperparameters that maximise the CV performance are chosen for the final model.
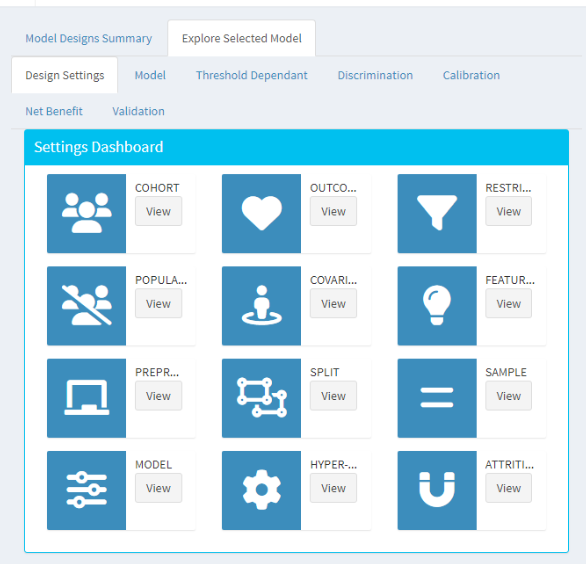
With regards to the hyperparameters, I’m not so familiar with the shiny app. I did have a look and looks like they should open when you click the view button on this picture next to the gear icon:
However when I open it nothing shows up for GBM models. I think there might be a bug so the hyperparameters for the gradient boosting machine are not coming through.
But in terms of R objects, if plpResults is the output of your run. They should be in:
@egillax Thanks for your help
I was able to check the hyperparameters on the object plpResults and with that perform a better performance analysis.
It would be useful to open an issue on Github because I can’t see the settings of my GBM model on the Shiny App. Please let me know when you do.
Alonso