we are implementing an oncology extension for a Multiple Myeloma dataset. Using the tutorials and the documentation, I believe we have been able to specify most of the mapping (thank you for all the documentation!).
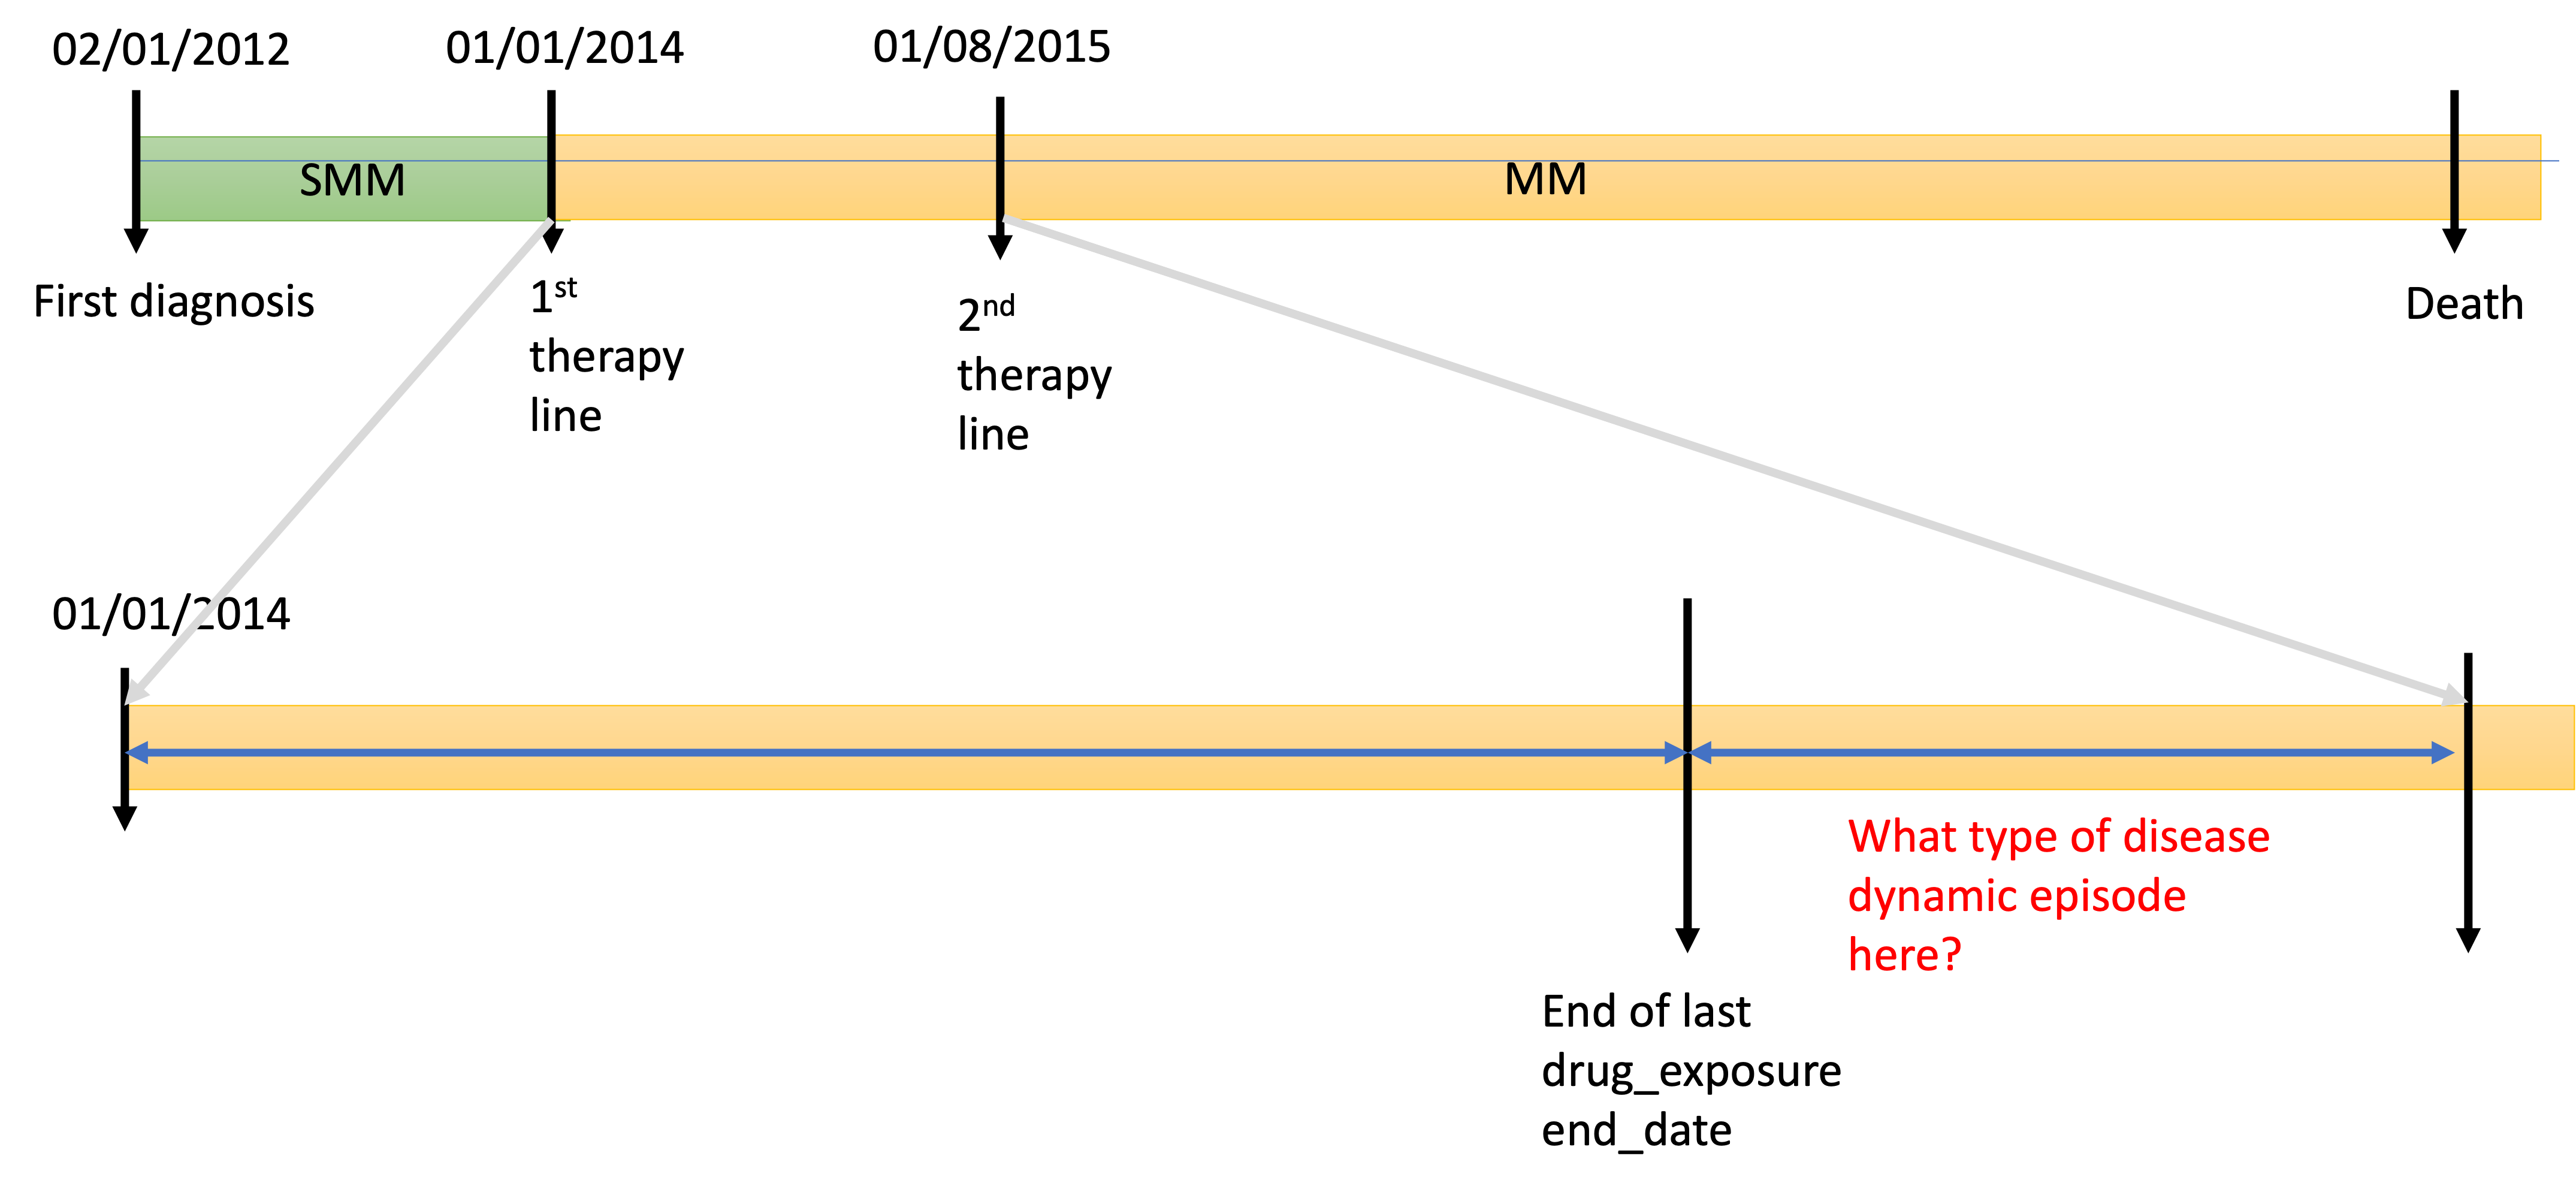
The question is specific to how to define the disease dynamic episode for the following:
the time between the end of the last treatment and the start of the next treatment. In this data, if a patient starts a new treatment, this indicates that the disease has progressed.
I made a graphical overview for an example patient.
The time between end of a treatment episode and beginning of the next is not necessarily filled by one episode, it could be one, two or more:
The episode after treatment that is characterized by shrinking tumor load (remission - may not happen in case of treatment failure)
The episode after treatment that is characterized by growing tumor load (progression - usually eventually leads to another treatment episode)
And there could be a third in between, when things don’t change (stable disease)
But you are putting the finger into the wound. Because we don’t have a standard solution to the problem of determining when these episodes are happening. This could be due to a myriad of different factors: tumor size in imaging, metastases, lymph nodes, complications.
In multiple myeloma, things may be a little easier though: if the plasma cells are normal you are in remission, if they are high but constant you are in stable disease, the moment they go above a threshold you are in progression. But sometimes you don’t see the plasma cells, but only the M-protein. We would love to work with you trying to come up with a pragmatic solution.