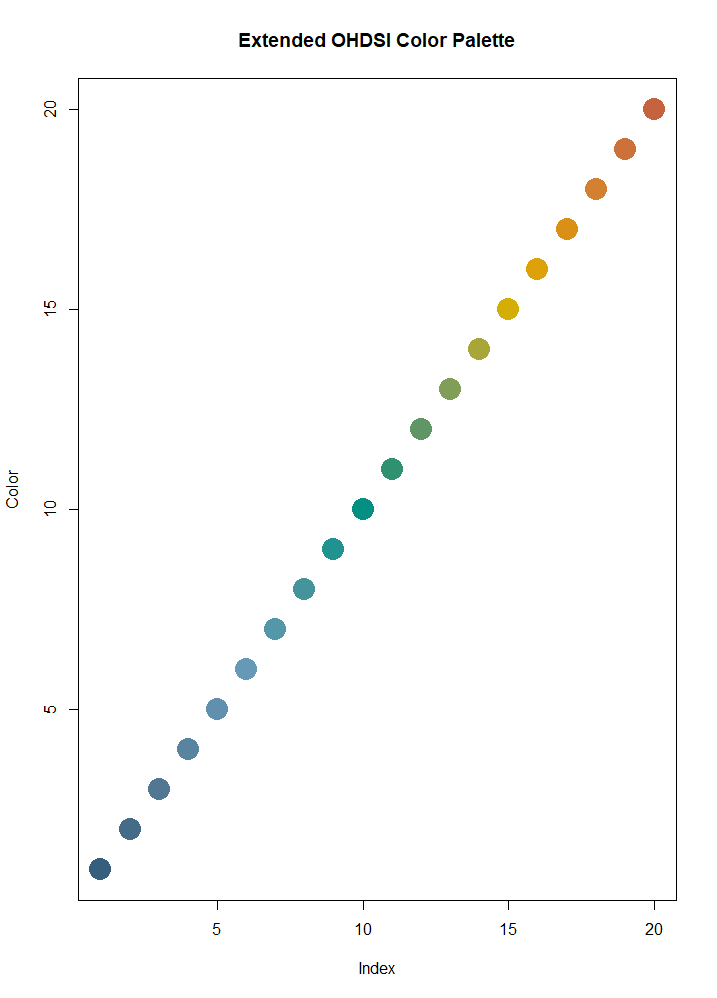
For those who care about such things: @msuchard and I created a 5-color palette for plots that should go well with the OHDSI logo colors. The palette has been checked for color blinded, but it is hard to do that conclusively so let me know if you have issues distinguishing the colors.
@Chris_Knoll: There are only so many colors a human can distinguish in a single visualization, so perhaps Cohort Pathway needs a different way to identify cohorts in the plot?
This tool allows you to inspect if your visualization works for different types of color-blindness. Might be good to try the Cohort Pathway output on that.
Pretty sure that number is greater than 5, lol. Maybe I could limit the max number of event cohorts to the number of colors available…I’ll think about it.
I was thinking more of using numbers in the plot (or some other marking like cohort name abbreviations) in addition to colors to identify cohorts. I would prefer not to limit the number of event cohorts.