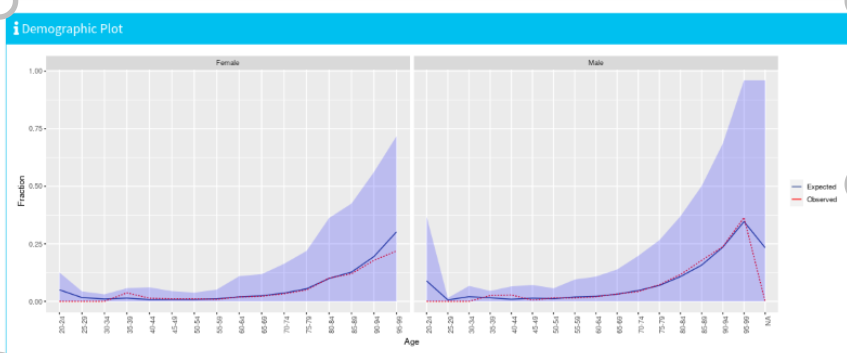
We have been experiencing Na’s on the x-axis of the Demographic Plot in the PLPViewer. It looks like the Na’s occur for patients above 99 years old.
I checked the source code and i looks like the age categories has been pre-specified to not contain people above 99 years. This is seen in the function called " plotDemographicSummary".
Hi Julie - sorry for the slow reply (I forget to check the forums). I just released a new version of PatientLevelPrediction with some major changes to the code. In the new version, age/gender are calculated per patient in the cohort rather than relying on the user specifying a covariate with age in 5 year buckets and gender (i.e., plpData$cohorts now has age and gender in the columns). The demographic plot now uses the age/gender in the plpData$cohorts rather than the plpData$covariates, so the problem you highlighted should be solved :). If you have any other issues with the code (especially ones that are urgent) - posting on the GitHub issues will send me an email so I will hopefully answer a lot quicker (for some reason the forum tags don’t notify me).