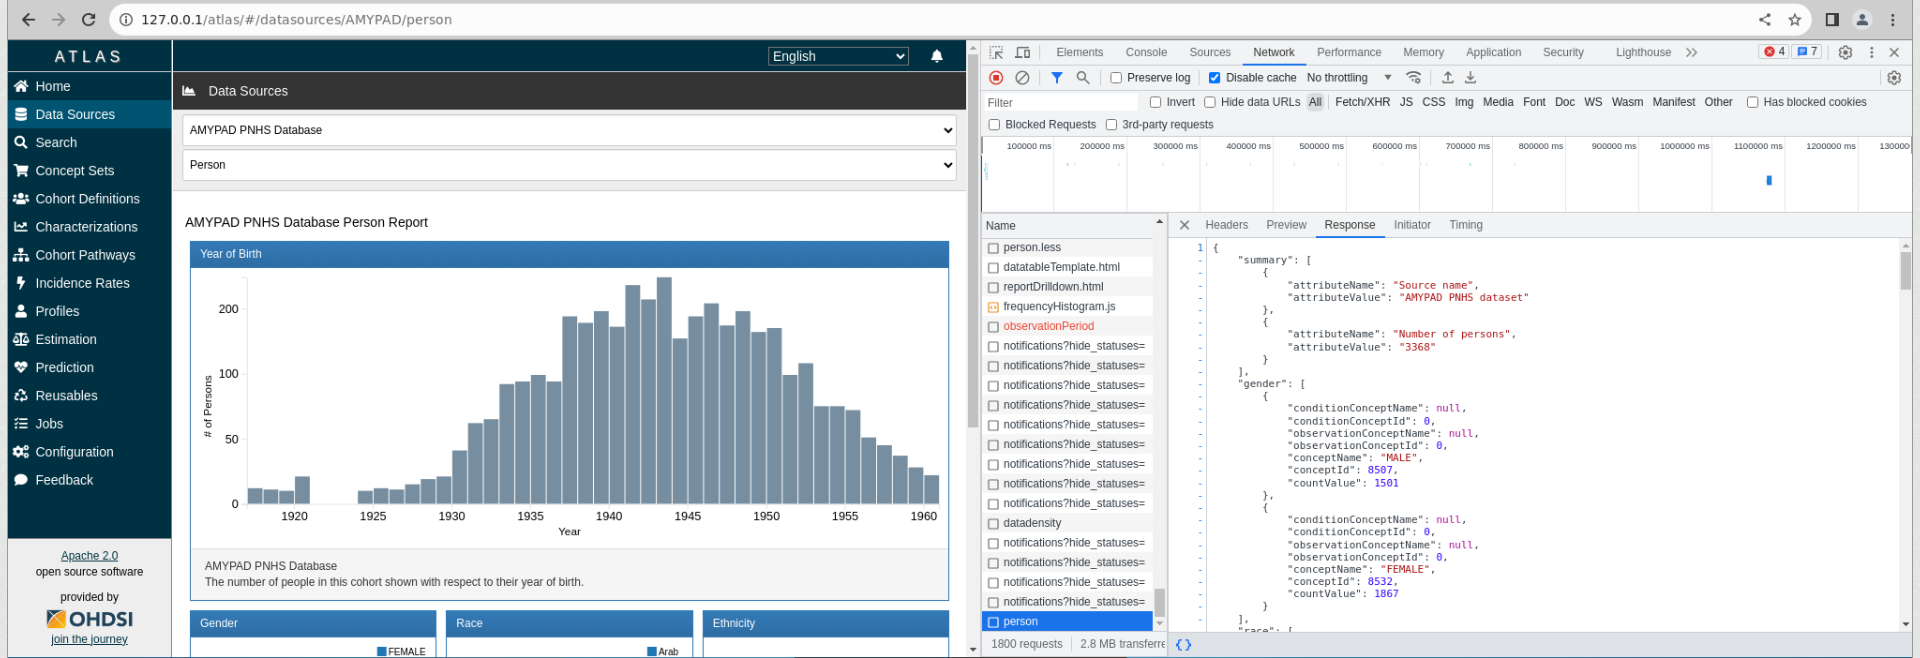
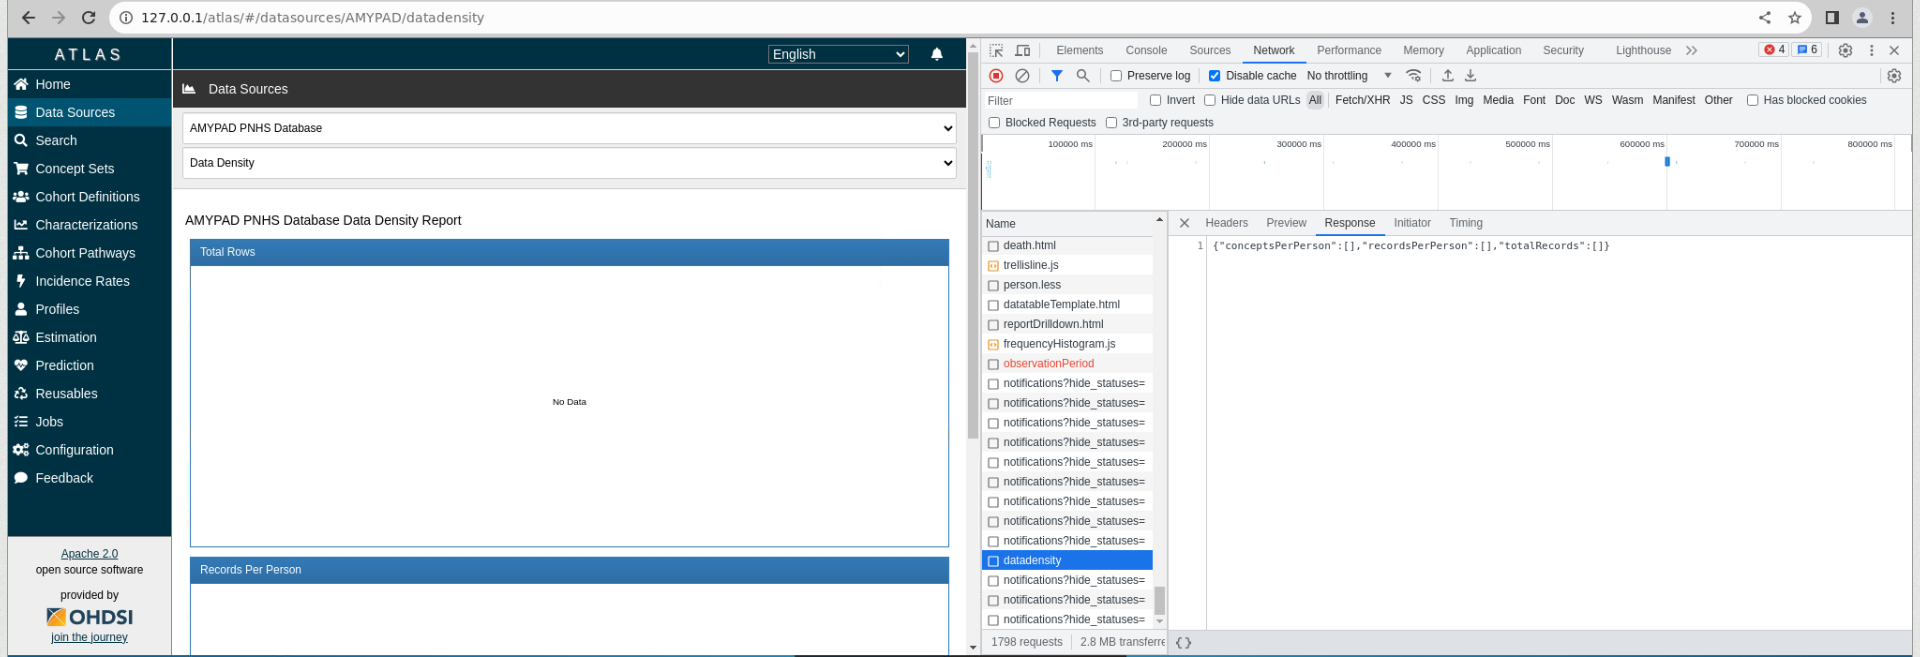
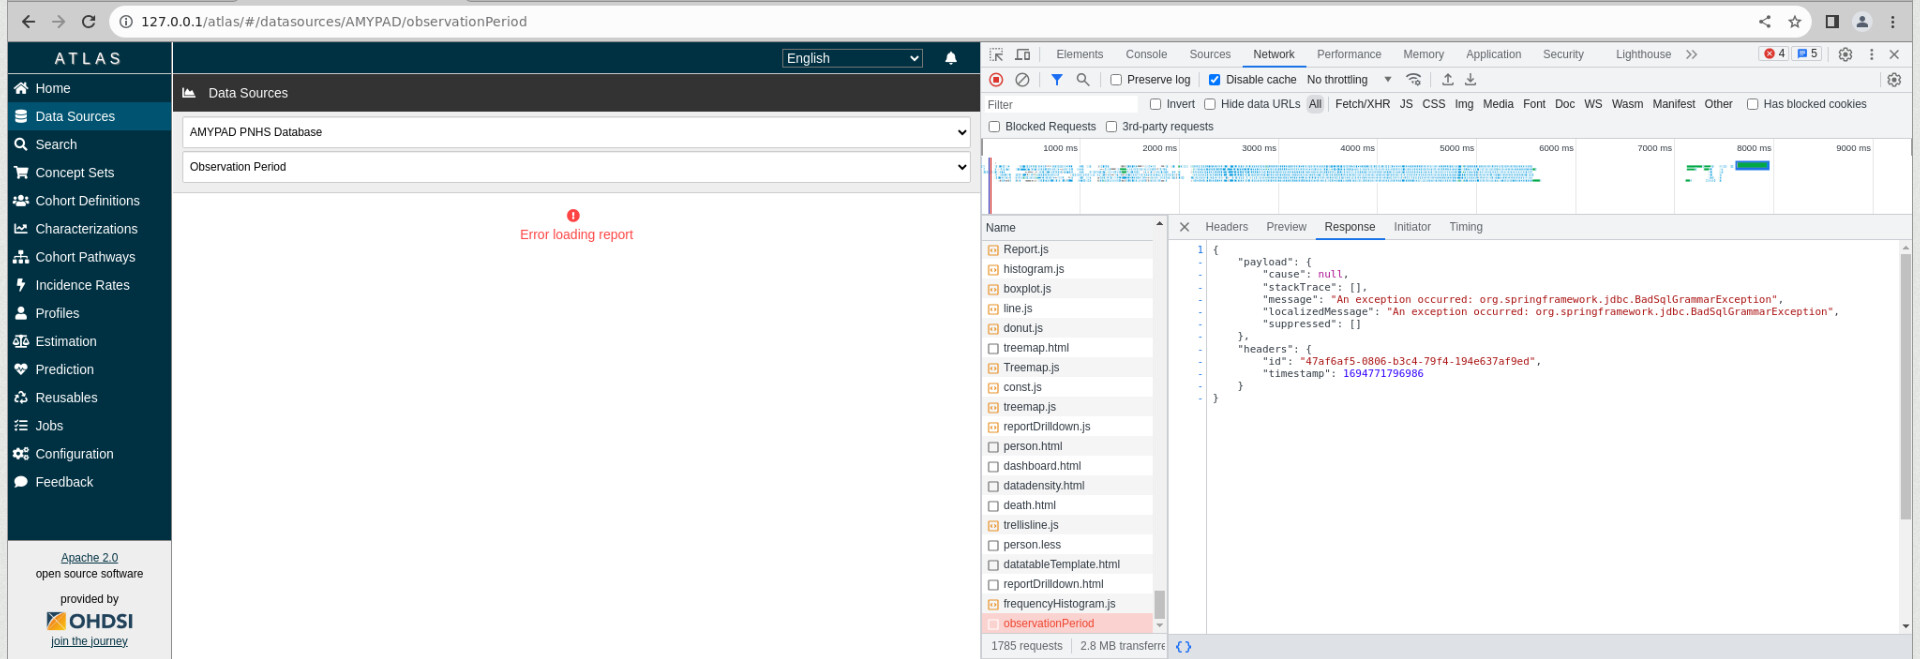
After quite a bit of a struggle I finally have Atlas / WebAPI talking to my CDM . However, only part of a few reports (Dashboard, Person) show data. The rest of the reports show ‘No data’, and Observation Period shows an ‘Error loading report’ (see attached screenshots). Any idea what could be the cause of this?
I noticed in some of your screenshots, you have requests that failed (in red). If the request resulted in an HTTP 500 error, you should be able to see the error message in your WebAPI logs.
If you could confirm your version of WebAPI you are running, that would be helpful.
Hello @Chris_Knoll, I am using Broadsea v3.0.0, which I installed few weeks ago, so I assume the WebAPI version is fairly recent. I am not sure what I am looking for in the logs (attached). There seem to be a lot of “bad SQL grammar” errors …
Caused by: org.postgresql.util.PSQLException: ERROR: permission denied for relation achilles_results

ERROR: relation "results.achilles_result_concept_count" does not exist

Resource not found: /resources/cdmresults/sql/report/visits/treemap.sql

Resource not found: /resources/cdmresults/sql/report/observation_period/treemap.sql
Some of this is environmnt problem that you can fix, others are code issues we need to fix:
For the permission error, you need to make sure you granted permission to the achilles_results table.
For the achilles_result_concept_count eror, you didn’t create that table. There are instructions elsewhere in the forums on that, I believe.
The resource not found errors are a software problem (and I’m surprised we haven’t seen this sooner) but I don’t think there’s a treemap for ObservationPeriod, and for the one for visits, the path to the file should be ‘visit’ not ‘visits’, so there’s a bug in a call somewhere but we will fix that for next release.
@Ajit_Londhe , I’ve scoured the codebase (multiple times) and I can’t figure out how the path to load the visits treemap is resolving to a ‘visits’ path when the report name is ‘visit’ in the UI and that gets passed along to the service. Is broadsea doing something special?
I also don’t know why observation_period is calling treemap, there is no treemap in the observation period report.
I fixed the permissions on achilles_results and generated the achilles_result_concept_count table. Now I get the following error message:
2023-09-15 16:56:42.413 ERROR taskExecutor-1 org.ohdsi.webapi.cdmresults.service.CDMCacheService - [] - Failed to warm cache AMYPAD. Exception: PreparedStatementCallback; bad SQL grammar [select cc.concept_id, record_count, descendant_record_count, person_count, descendant_person_count
from results.achilles_result_concept_count cc
join cdmdatabaseschema.concept c on cc.concept_id = c.concept_id
WHERE cc.concept_id >= ? and cc.concept_id <= ?]; nested exception is org.postgresql.util.PSQLException: ERROR: operator does not exist: character varying = integer
Hint: No operator matches the given name and argument type(s). You might need to add explicit type casts.
Position: 196
Ok, so in the above query, there’s some kind of mismatch between the left side of = and right side. Looking above, we see there’s a join on result_concept_count.concept_id and concept.concept_id. That’s the only thing, so one of those things is a varchar. But that can’t be because the DDL for both those tables would make concept_id an integer field.
What is the column type of concept_id in each of those tables?
The type of concept_id in the achilles_result_concept_count was varchar. I changed it to integer. Now I get a complaint that the column person_count doesn’t exist in the achilles_result_concept_count table …
So person_count in that table is a bit of a newer, optional addition. In the endpoint “/WebAPI/ddl/achilles”, you’ll find the table create and query for rebuilding the table with it included.
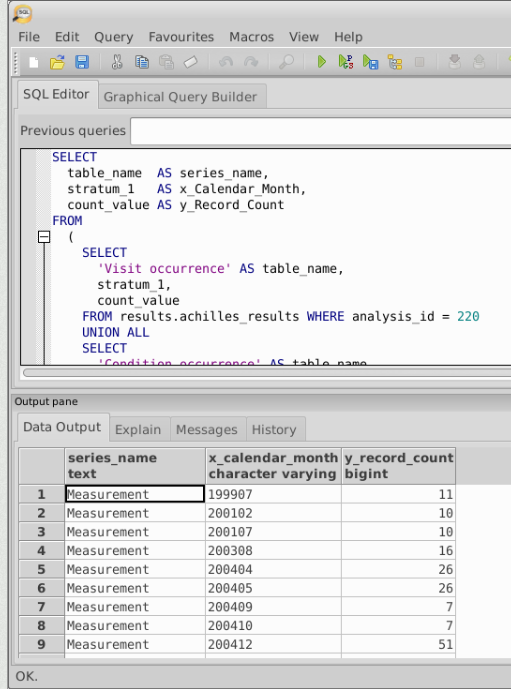
I have generated the achilles_result_concept_count table now and said error message has disappeared from the logs. However, still most reports in Atlas are empty (or rather show “No data”). I was expecting at least for instance the “Data density” report to show me something. If I run the query WebAPI/src/main/resources/resources/cdmresults/sql/report/datadensity/totalrecords.sql at master · OHDSI/WebAPI · GitHub against my db, it does return results. So, why are these not shown in the UI?
Likely the cache has messed with it. You can find the source_id in the source table of the webapi schema, then use that to identify which caches to clear from the achilles_cache table in the webapi schema.
@Ajit_Londhe No, unfortunately clearing the cache and deleting cookies doesn’t change things.
Just FYI, these are the only reports / panels that currently show data:
Dashboard - CDM Summary, Population by Gender
Person - Year of Birth, Gender, Race
Observation Period - All panels
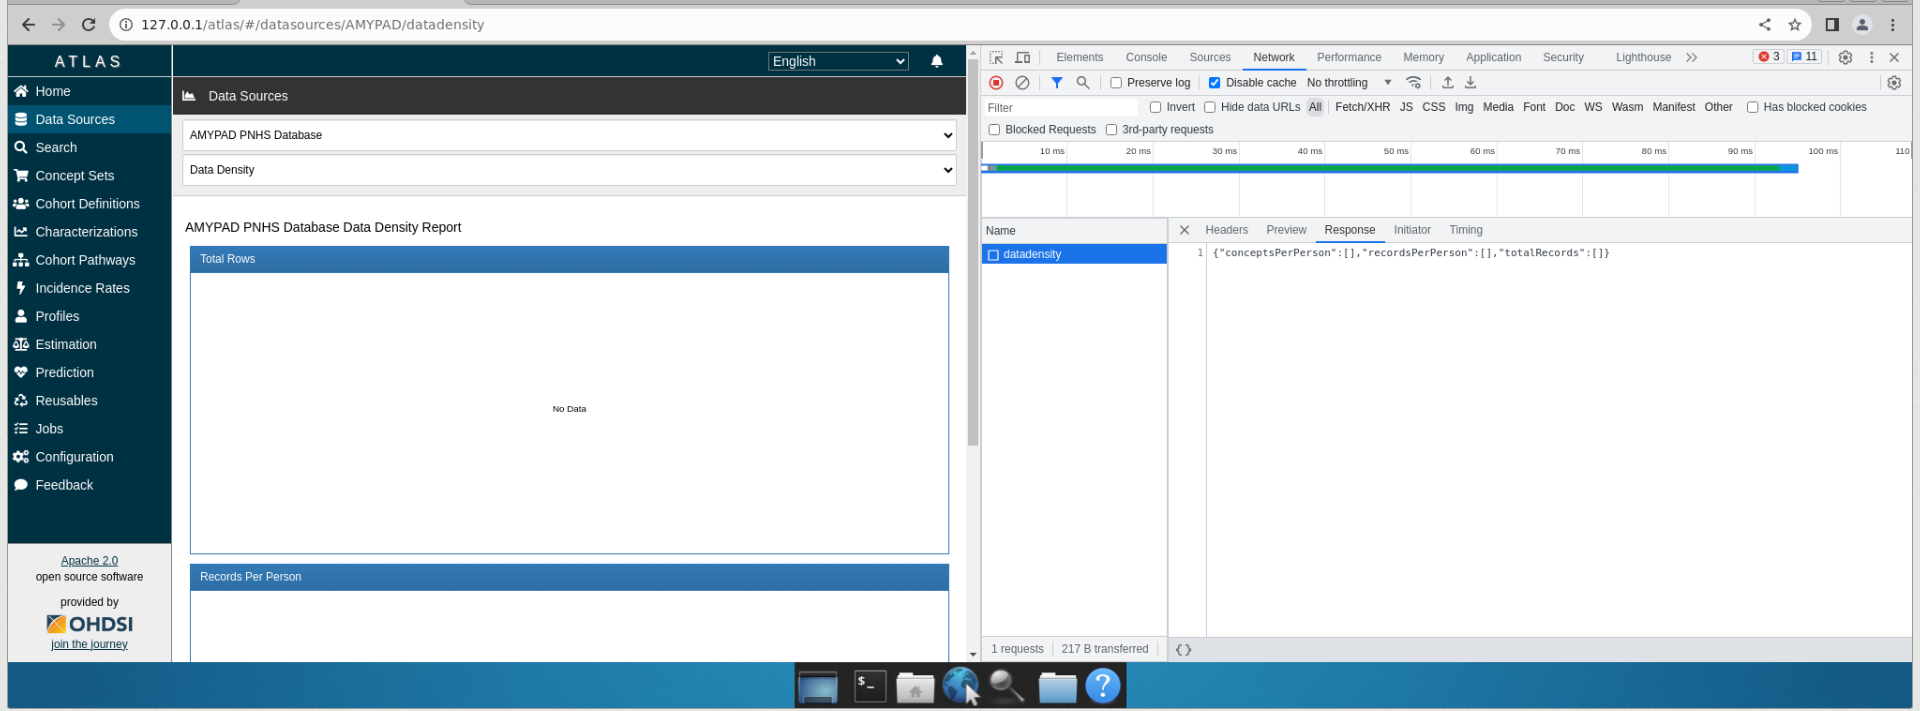
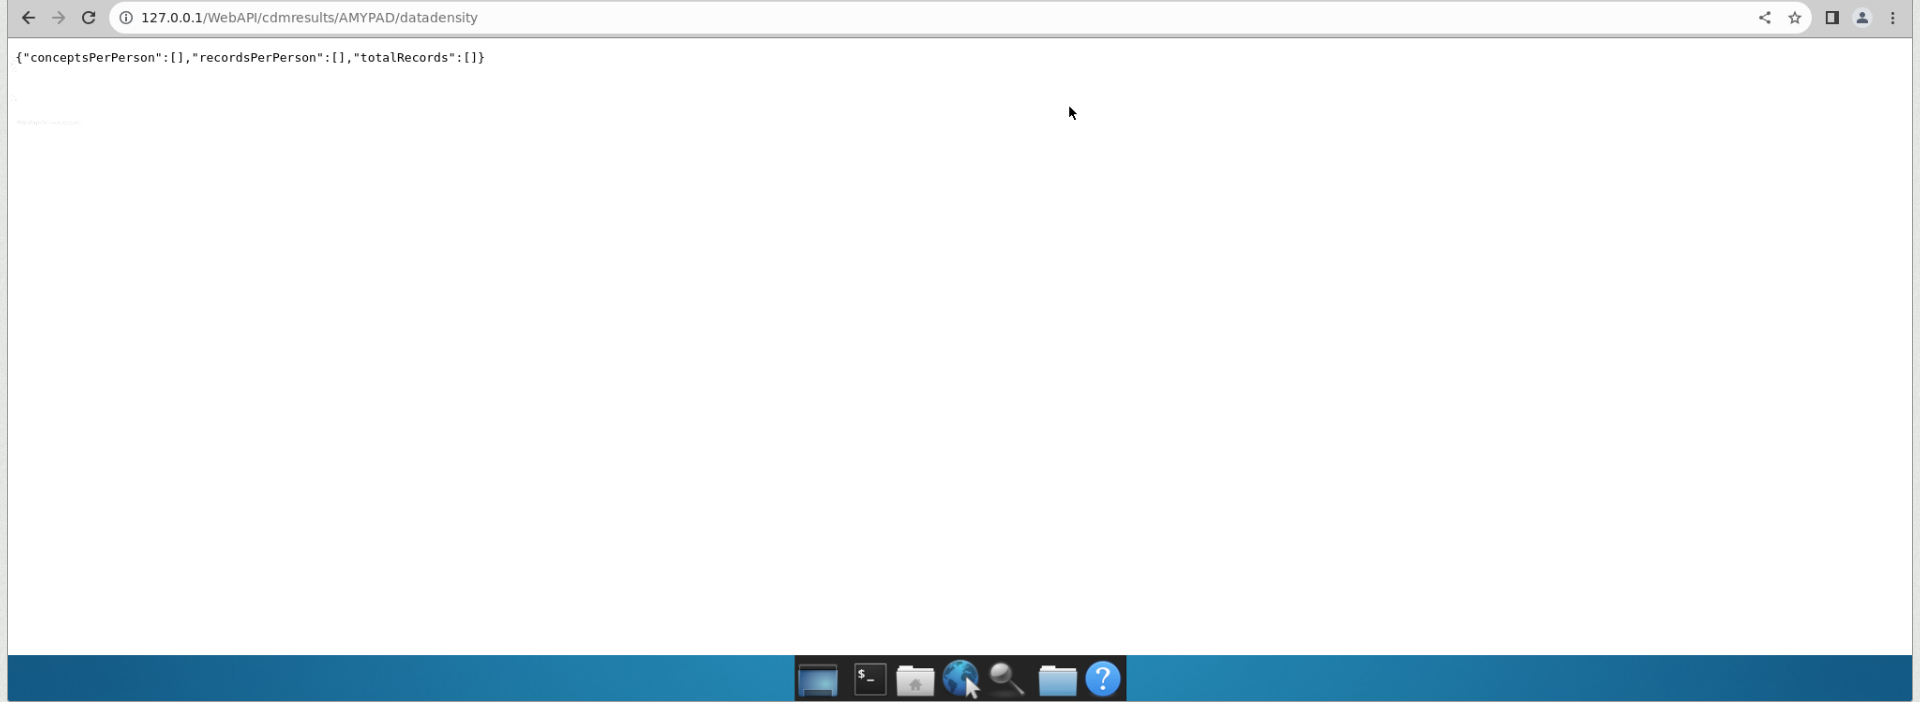
When I for instance look at the Data Density report, I can see that no data is returned at all. Same when I query the WebAPI directly. But, as I showed above, when I for example run the totalrecords.sql code directly against my db, it does return data …
Seems a little light on analysis ids. 62 out of 194 default analyses. You may want to go back to your Achilles execution and confirm all of the necessary analyses executed.
In R, you can see the default analyses using: Achilles::getAnalysisDetails() |> dplyr::filter(IS_DEFAULT == 1)
That query gives 194 rows back. Is this the list of analyses that HAVE BEEN executed or the analyses that CAN BE executed? If the latter, how do I confirm which analyses have been executed? Or how do I make sure all of them are executed? Apologies for all the naive questions …
In fact, looking at my log_achilles.txt, all 194 analyses seem to have been done.