The American Thyroid Association sponsors Thyroid Awareness Month and has prepared a nice website that provides useful information about the disease and how you can get involved. I don’t know about the rest of you, but the thyroid is not a gland I spend much time thinking about. I learned that the lifetime prevalence of thyroid diseases in the US is estimated at more than 12%, with the most common condition being hypothyroidism. Women are at higher risk of developing hypothyroidism than men, according to the ATA Guidelines for Hypothyroidism. Interestingly, despite hypothyroidism being extremely prevalent and levothyroxine being one of the most commonly used chronic medications in the world, there is relatively little real world evidence about the long-term clinical effects of levothyroxine exposure. @Frank has started some exciting work in this area, and its something that I expect our community could meaningfully contribute to if there’s shared interest.
One thyroid disorder that I hadn’t ever given much notice about was thyroid cancer, until I read this article in the Annals of Internal Medicine article, “Scrutiny-Dependent Cancer and Self-fulfilling Risk Factors” The general premise: prostate, breast, and thyroid cancers are examples of diseases whose incidence may be largely driven by the veracity of our detection methods, moreso than any inherent trait to the disease itself.
Their claim on thyroid cancer was: “One of the most prominent risk factors for this disease is sex. According to the SEER (Surveillance, Epidemiology, and End Results) database, women are approximately 3 times more likely than men to be diagnosed with thyroid cancer. However, this risk factor may be more apparent than real, because thyroid cancer mortality in men and women is approximately identical in the United States. Women may simply be more likely to connect with the health care system; are thus more likely to have thyroid nodules detected and evaluated; and—given the substantial disease reservoir—are more likely to have cases of small papillary thyroid cancer diagnosed.”
The assertion of detection bias seems to be supported by a 2016 BMJ study that looked at the association of screening and thyroid cancer in South Korea using a national cancer registry, which found that the 6-fold increase in disease incidence from 1999 to 2008 could be explained by the proportional increase in detection of small tumors.
The Annals authors’ conclusion particularly caught my attention: “risk factor epidemiology must shift from diagnosis to “harder” outcomes—those more directly related to the disease process. Although late-stage and metastatic disease are potential candidates, death from cancer is the most meaningful and least ambiguous outcome. As cancer diagnosis becomes increasingly sensitive to observer scrutiny, we hope that those investigating the risk for this disease focus on risk factors for death from cancer, not cancer diagnosis.”
So, what’s the general problem? I think there are a few aspects to this:
- We would like to be able to reliably estimate the incidence and prevalence of disease within populations of interest and across time periods. Observational healthcare data, like what we have across the OHDSI community, should be a useful source to perform this task, subject to our ability to reliably identify cases of the disease and properly define the underlying population at-risk for the disease.
- We want to compare an incidence or prevalence estimate between populations (e.g. risk of thyroid cancer in women vs. men) or between time periods (risk of thyroid cancer in 2000 vs. 2010). When we do, we are tempted to draw some sort of inference from the comparison (e.g. females have higher risk than men).
- When some researchers observe a difference in the disease risk between population strata, they’ll use the term ‘risk factor’ to describe that the stratification definition has a non-null association with the disease (e.g. being female is a ‘risk factor’ for thyroid cancer if a larger proportion of women are observed to have the disease than the proportion of men who are observed to have the disease).
- The term ‘risk factor’ is inconsistently defined and applied across the community, but I think it’s generally understood that ‘risk factor’ represents correlation, but not necessarily causation. A bivariate association between two attributes: 1) gender = Female: Yes or No, and 2) Thyroid cancer status: Yes or No; can be categorized into a 2x2 contingency table and statistically evaluated to examine the strength of association. Sometimes, multivariate modeling is used to explore the strength of association for a candidate risk factor, conditioned on some set of other baseline covariates.
- When a ‘risk factor’ isn’t a causal effect, it can be misleading to report the bivariate association because the risk factor may be misinterpreted as an effect modifier.
(One of the areas where I hope the Patient-Level Prediction workgroup and the Population-Level Estimation workgroup can collaborate to lead our community is toward a best practice is to define ‘risk factor’, to determine if it’s a practically useful pursuit to find them, and to establish the appropriate methods to yield reliable estimates.)
So me knowing absolutely nothing about thyroid cancer, but intrigued by this idea that gender could be a ‘misleading risk factor’, I figured I’d use some time this month to investigate how I could use our OHDSI tools to see how our observational data could contribute to this health story.
Where was my initial starting point? The same place it is for all of my research: ACHILLES.
ACHILLES was the first open-source analytics tool developed and released by the OHDSI community, and it still holds up as a remarkable resource, one which I still use on a daily basis. Its beauty is in its simplicity: we wanted to provide basic descriptive statistics to summarize what data were contained within a OMOP CDM-compliant database. So, we plodded along the OMOP CDM, table by table, field by field, concept by concept, to create a laundry list of basic statistics that we thought would be useful for to characterize a dataset. The ACHILLES tool is actually two-step process: 1) you run an R package that calls a large SQL script to populate two tables of summary statistics (counts and distributions), effectively pre-computing a large set of summaries against your CDM that you may want to explore in the future; and 2) you can access the ACHILLES summary statistics through one of two web-based interfaces, either as a stand-alone HTML5 app (ACHILLES web) or within the ATLAS platform (under the ‘Data Sources’ function). You want to know how many people are in a database? Go to ACHILLES. Wanna breakdown of the population by gender, or by year of birth? Go to ACHILLES. What years are covered in the database? Go to ACHILLES. What drugs are observed in the database? Which condition concepts? Which procedures? ACHILLES, ACHILLES, ACHILLES. Is data quality your single point of weakness? (with thanks to @Vojtech_Huser) …check for your ACHILLES Heel!
(For those who haven’t yet played with ACHILLES, here’s a link to the wiki about it).
The starting point in ACHILLES is a high-level dashboard. For a nice example, you can go here: http://www.ohdsi.org/web/achilles
On the top right-hand corner, you’ll see you can select any of the datasets that you’ve got within your own data network as well as a series of reports that are available for exploration within each source. On the public OHDSI website we have summary information from the US CMS SynPUF data and sample data from @rwpark and our friends at Ajou.
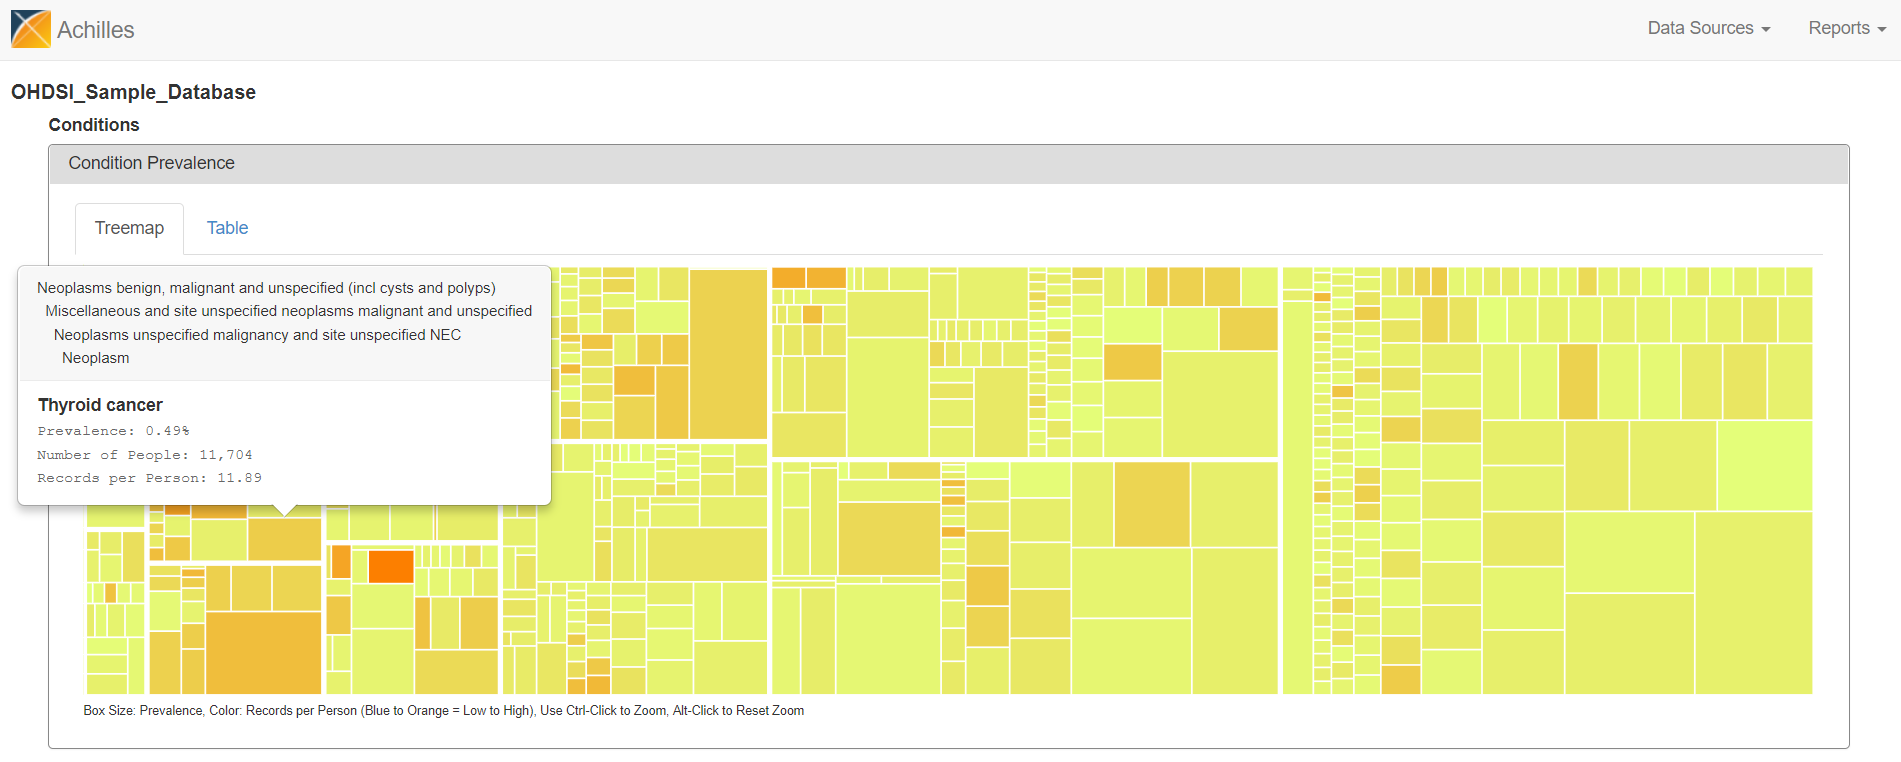
I went to the Condition report on the sample data, and looked for thyroid conditions: http://www.ohdsi.org/web/achilles/#/OHDSI_Sample_Database/conditions
There are two views to explore the summary statistics from the CONDITION_OCCURRENCE table. The treemap view shows all condition concepts, organized by the MedDRA hierarchy, sized by the proportion of persons in the database with at least one occurrence of the condition concept, and colored by the average number of records that are observed amongst those patients with the condition concept. You can hoverover the boxes to see the summary info pop up, see ‘Thyroid cancer’ below.
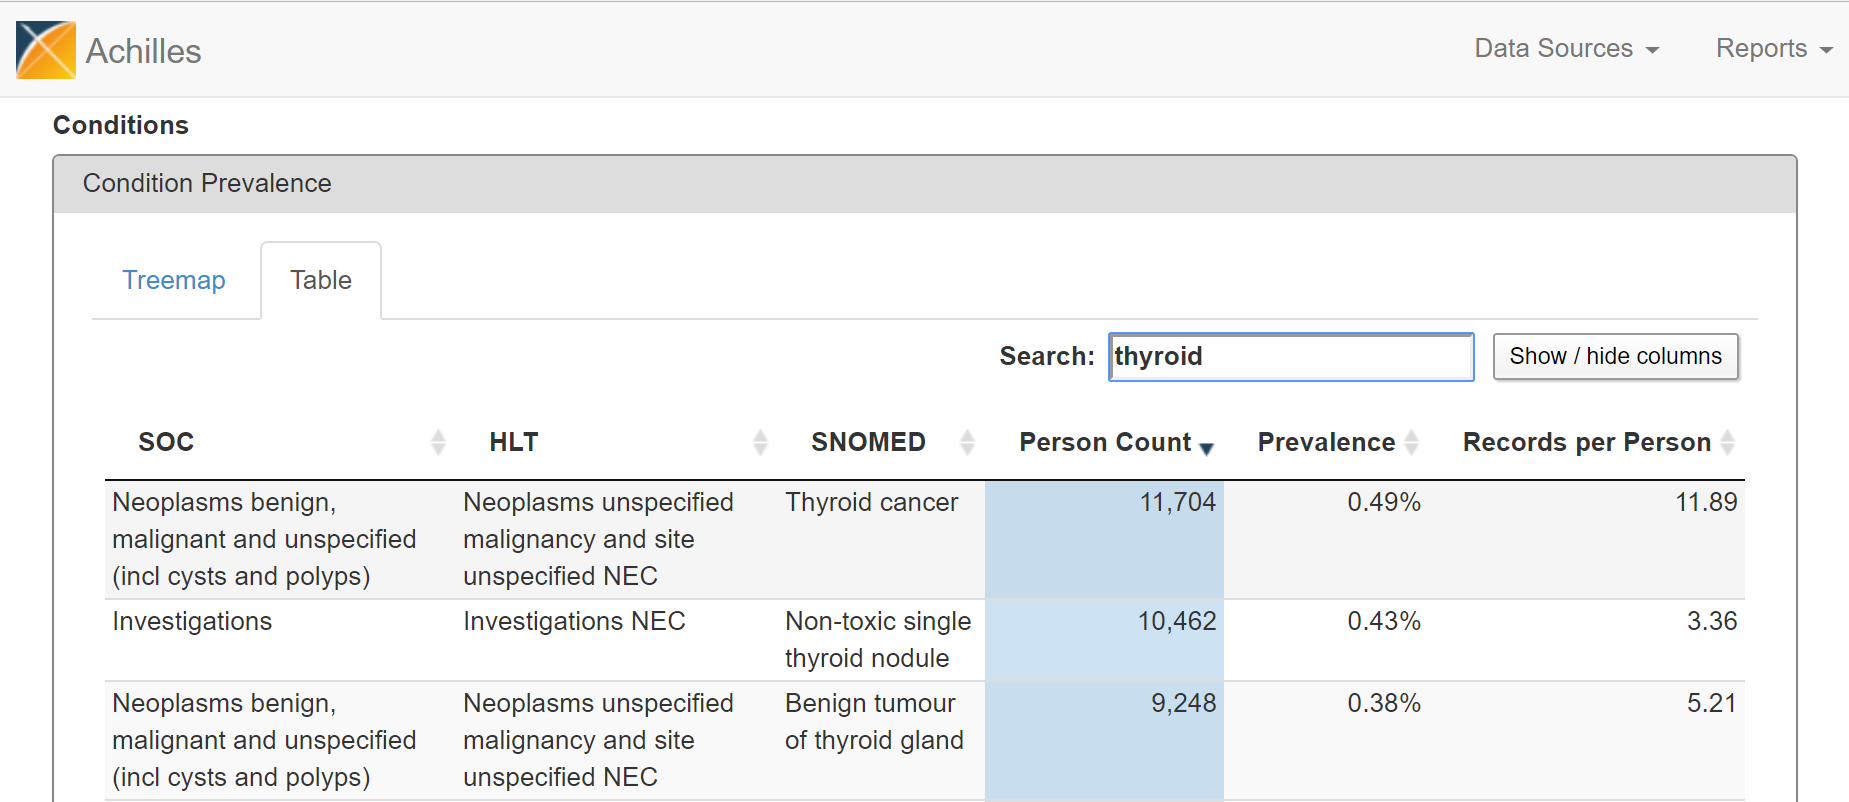
Alternatively, you can flip over to the ‘Table’ view and search for ‘thyroid cancer’…
From either the Treemap or Table view, the cool feature in ACHILLES is that you can ‘drilldown’ on any concept to get additional summary information about that particular concept. So, for example, selecting ‘Thyroid Cancer’ shows the plot below, which shows the proportion of persons with the condition concept for ‘thyroid cancer’, stratified by year (the x-axis), age (the trellis), and gender (the series: orange = female, blue = male).
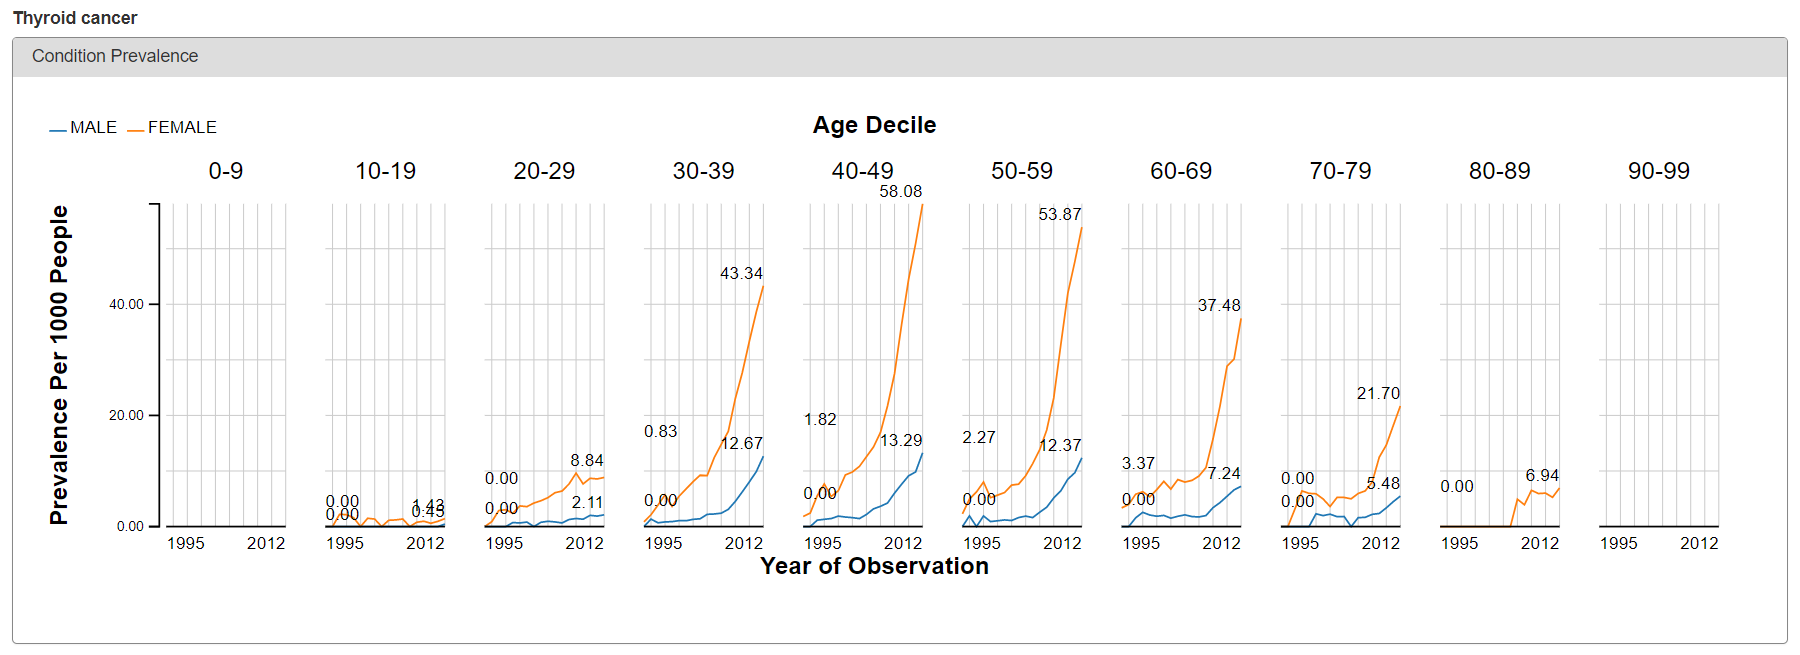
What do we see? Based on the crude occurrence of the ‘thyroid cancer’ concept in the sample data, we see what was reported in the BMJ paper: an apparent ‘thyroid cancer epidemic’ on our hands😊 The proportion of persons with a condition concept record of ‘thyroid cancer’ is observed to have a substantial rise from 1995 to 2012. We also see that, across all age strata and in all years, the proportion is much higher in females than males. So, gender must be a risk factor, right? Not so fast…
At this point, I should reinforce that ACHILLES provides basic summary statistics, but it should not be used to directly answer epidemiological questions as it is not providing the formal statistics you’d want or expect. ACHILLES is telling you about the patterns is use of concepts in the data over time and within patient sub-populations (by age and gender). But ACHILLES is not providing a proper estimate of either incidence or prevalence; doing so requires 1) creating a proper phenotype for finding the persons with the onset of disease (which may require use of one or more different concepts and may also be accompanied by additional logic, such as whether the code must be observed in an inpatient setting or have multiple codes over time or see some diagnostic or therapeutic intervention to corroborate the diagnosis); and 2) need to define an appropriate denominator to represent the population at-risk for observing the disease onset. What ACHILLES does do, however, is show you which concepts may be contained within the source which warrant further investigation, and can reveal patterns in the code utilization that stimulate hypotheses that you can explore with other OHDSI tools. And wouldn’t you agree it worked here: surely, you must be like me in being at least a little bit interested in why we’re seeing the thyroid cancer code jump off the chart…
To go a little further, I decided to look into one of the large US databases that I have access to in-house. It’s a database that contains de-identified records from medical and drug insurance claims from a population of patients that include active employees, early retirees, COBRA continuers, and their dependents insured by employer-sponsored plans. The population is 49% male, 51% female, and primarily represents a population aged 0 to 65. The database contains inpatient admission records, outpatient services, prescription drugs, populations, eligibility status, and costs of services. The database was reviewed by the New England Institutional Review Board (IRB) and was determined to be exempt from broad IRB approval.
To corroborate what we see on the public OHDSI instance of ACHILLES and the BMJ paper, I looked at the ACHILLES Condition report to see if I could observe an increase in thyroid cancer over time. Below is the screenshot for the condition concept of ‘primary malignant neoplasm of thyroid gland’, revealing a similarly startling pattern. Thyroid cancer is rising, and its more pronounced in women.

But ACHILLES doesn’t just show us patterns in condition concepts, it shows us patterns for all concepts in all domains. The argument of the Annals paper was that we may be seeing thyroid cancer more simply because we’re doing more diagnostic procedures. Easy enough, I just toggled over the Procedure report and searched for ‘thyroid’. There’s a CPT4 code (76536) that is used for reimbursement of services for a ultrasound of the head and neck. It’s on these ultrasounds where a clinician could pick up a nodule or see small tumours that could ultimately be worked up to become a thyroid cancer diagnosis. So, what’s the pattern of use of this procedure in the same US claims database? See below:
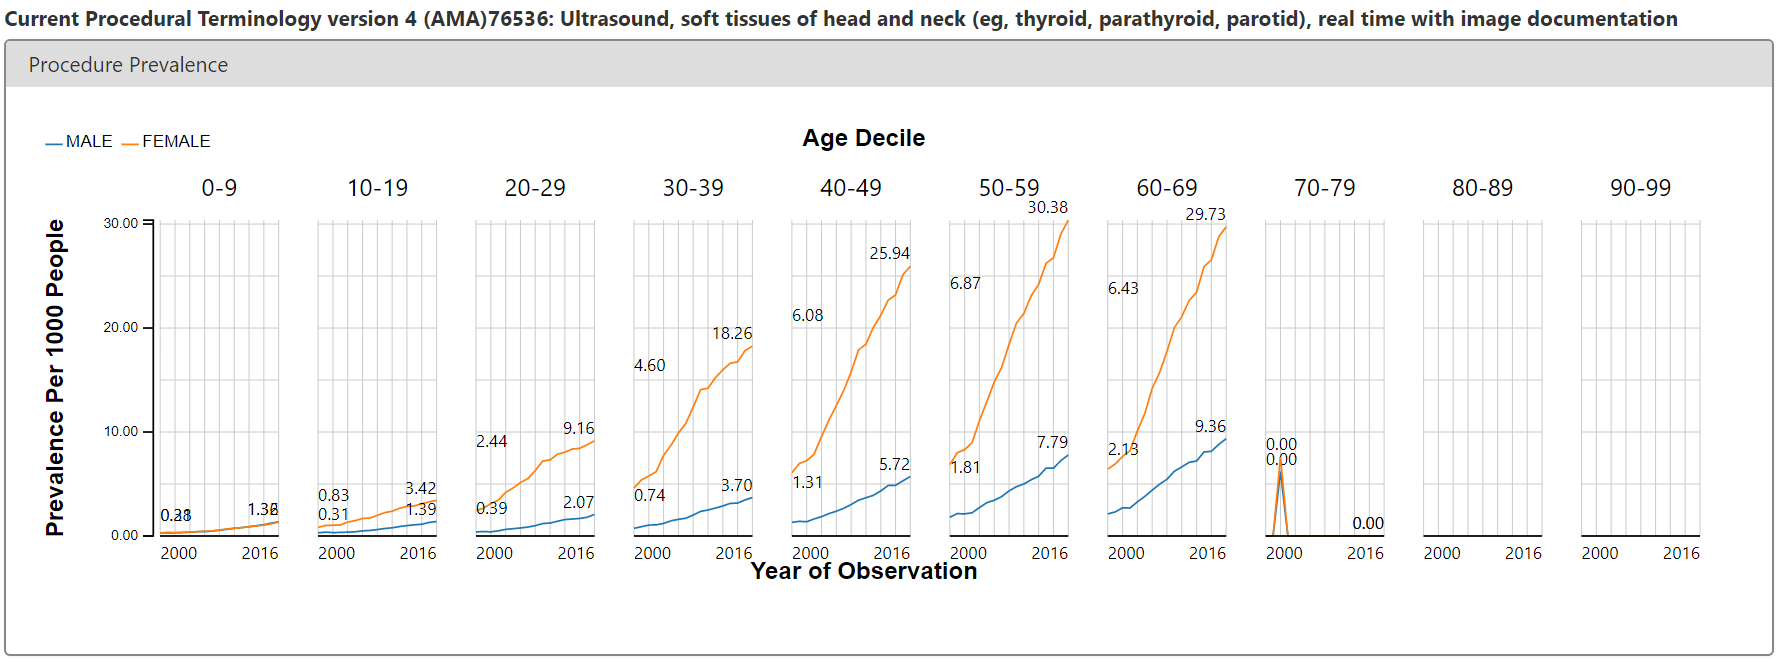
Eerily similar pattern to the condition concept. Steady increase over time, notable difference between females and males.
So what have we learned at this point? Nothing really definitive, but certainly there’s enough of an intriguing pattern and association that it’s worth formalizing this a little further. Time to pull out some other OHDSI tools…
First, let’s lay out the hypothesis we want to examine, and what information we want to see to support or refute the hypothesis:
• Thyroid cancer is observed more in females than males.
• Thyroid ultrasounds are performed more in females than males.
• If gender is a risk factor that is “more apparent than real”, then the association between gender and thyroid cancer should be attenuated if conditioned by thyroid cancer detection
A very simplistic directed acyclic graph of this phenomenon might look like this:
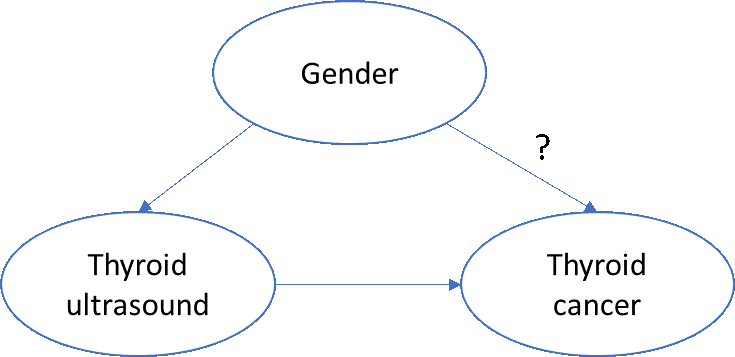
To assess the biologic impact of gender on thyroid cancer, we’d want to account for any non-biologic effects of thyroid cancer, such as the increased propensity for women to seek additional care and be provided more services, including diagnostic or screening procedures.
One simple approach: ‘block’ on ‘thyroid ultrasound’. More specifically, if we restrict ourselves to patients who have a thyroid ultrasound, then we can examine the effect of gender on incidence of thyroid cancer, without concern that women have more ultrasounds than men.
So, what do we need to do?
• Build a ‘target’ cohort of patients who have had their first thyroid ultrasound and have no prior thyroid cancer diagnosis.
• Build an ‘outcome’ cohort of patients who have incident diagnosis of thyroid cancer.
• For both the ‘target’ and ‘outcome’ cohort, provide a descriptive summary of the populations using baseline covariates, such as demographics, conditions, drugs, procedures, etc.
• Estimate the incidence of ‘outcome’ in the ‘target’ population within a defined time-at-risk, and stratified by the candidate risk factors of interest.
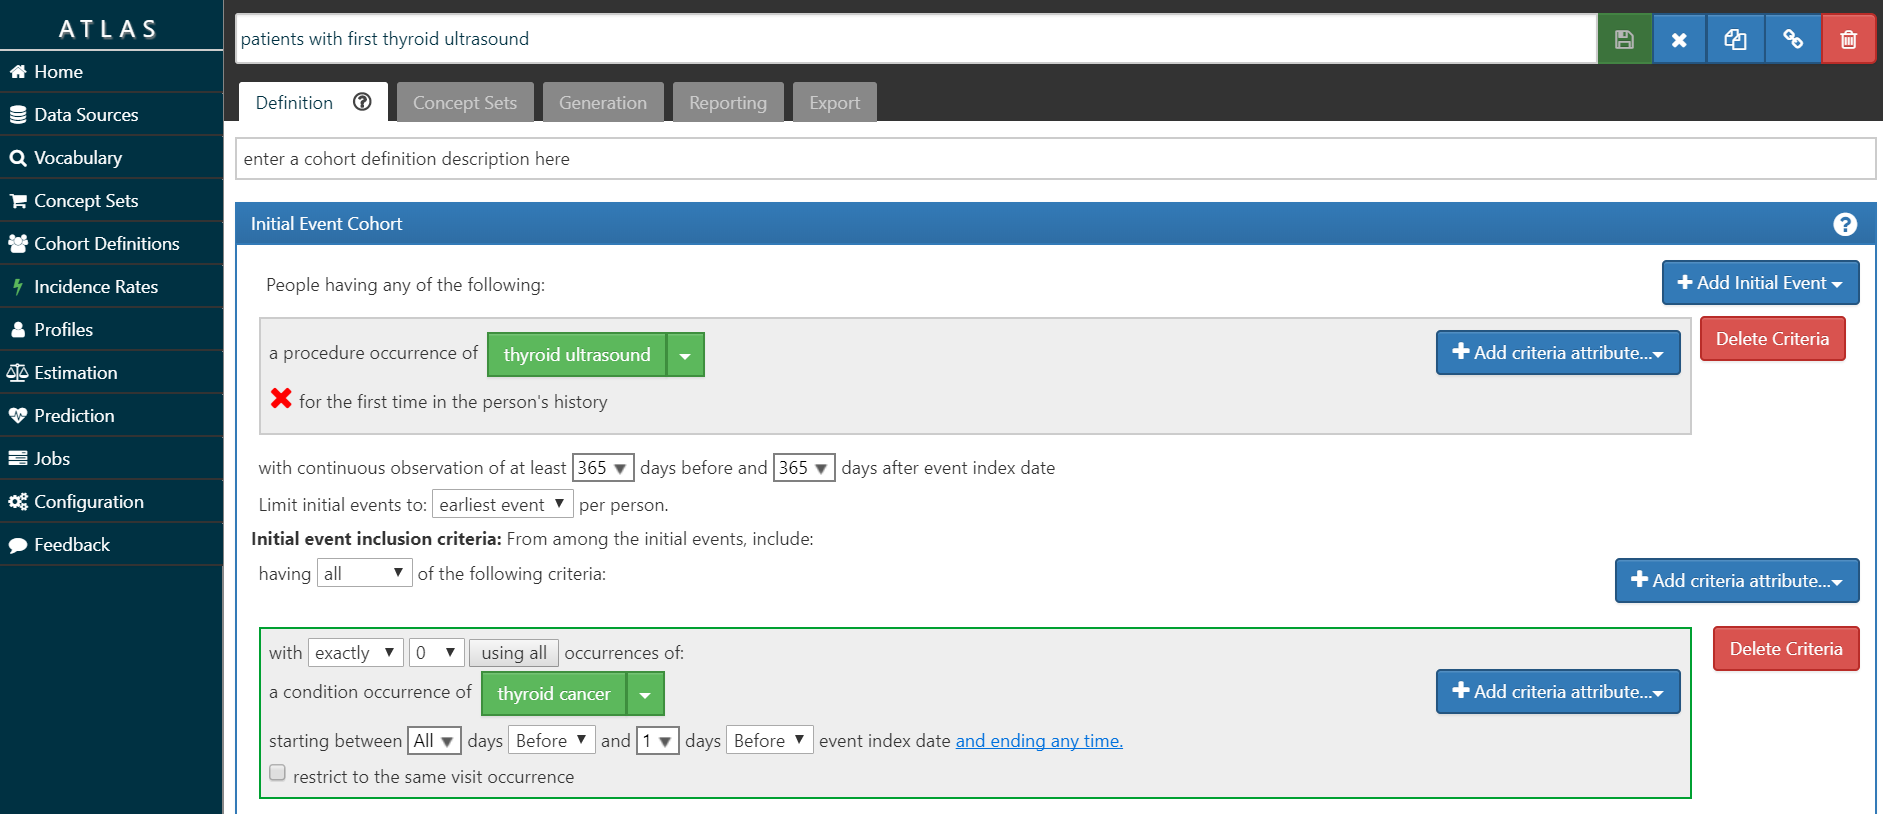
My ‘T’ is screenshot below and also posted in the OHDSI instance of ATLAS here. I look for the first occurrence of the CPT4 code for ultrasound of the head or neck, requiring at least 1 year of prior observation before the imaging and at least 1 year of follow-up after the imaging. I required that the patients did not have a thyroid cancer diagnosis prior to the procedure, to ensure the procedure was not part of follow-up care. In our database, we had over 926,000 persons meeting this cohort definition.
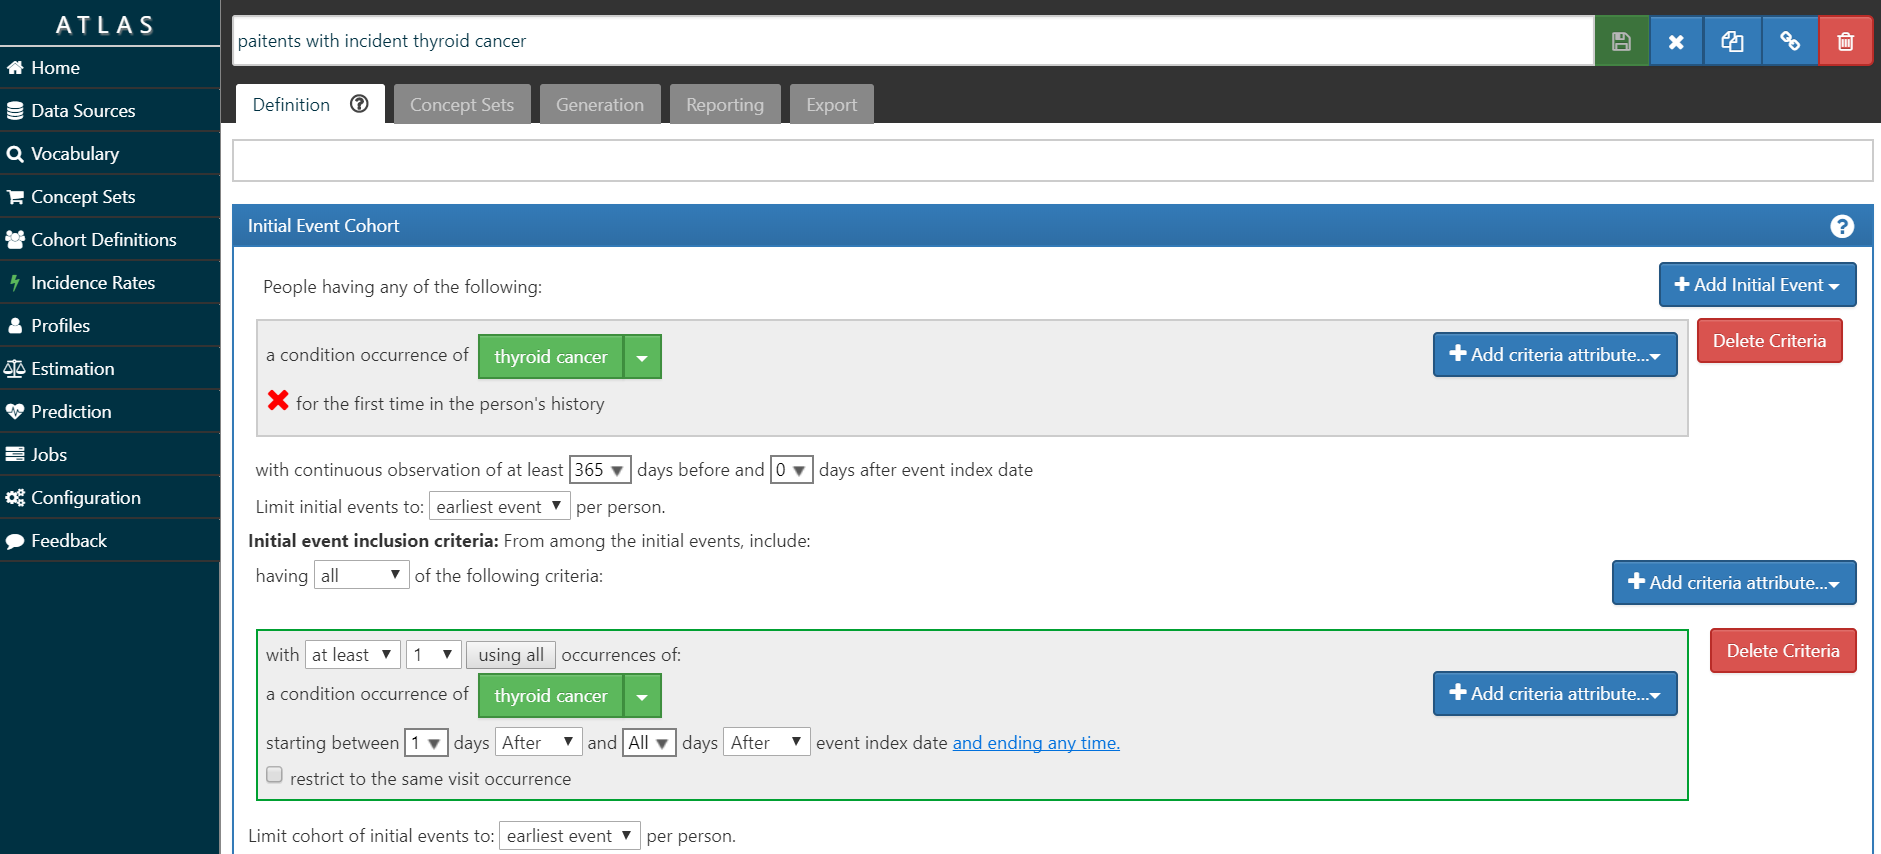
My ‘O’ is screenshot here and the cohort definition is here. I’m requiring at least 1 year of prior observation before the first diagnosis, and also requiring a second diagnosis on a different date to further confirm the diagnosis. I didn’t do any validation on this phenotype, so I don’t know what the sensitivity/specificity tradeoff represents.
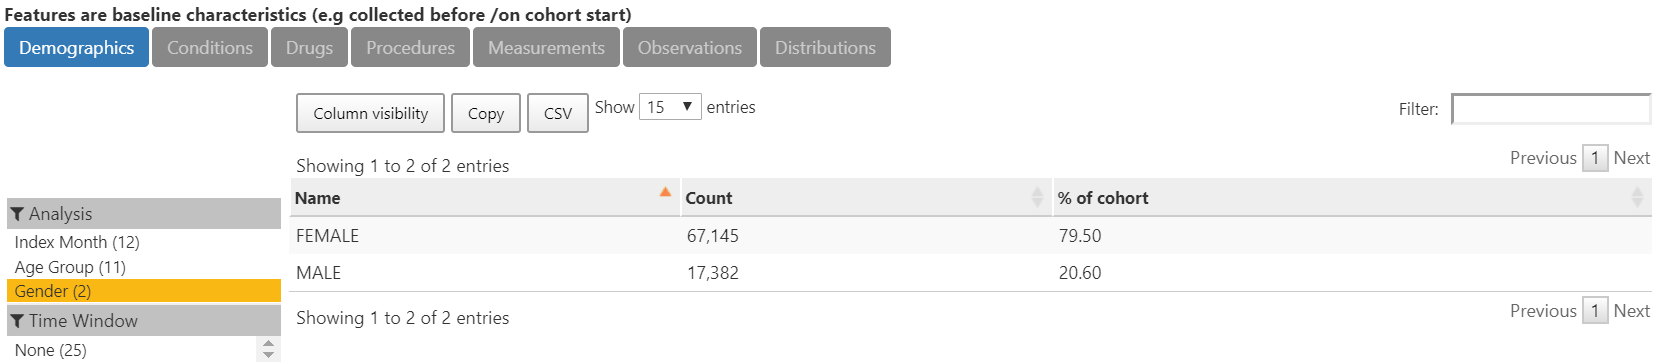
The characterization of O below shows that indeed, 80% of the more than 84,000 thyroid cancer cases are female.
With those cohorts in place, we can use the “Incidence” feature in ATLAS.
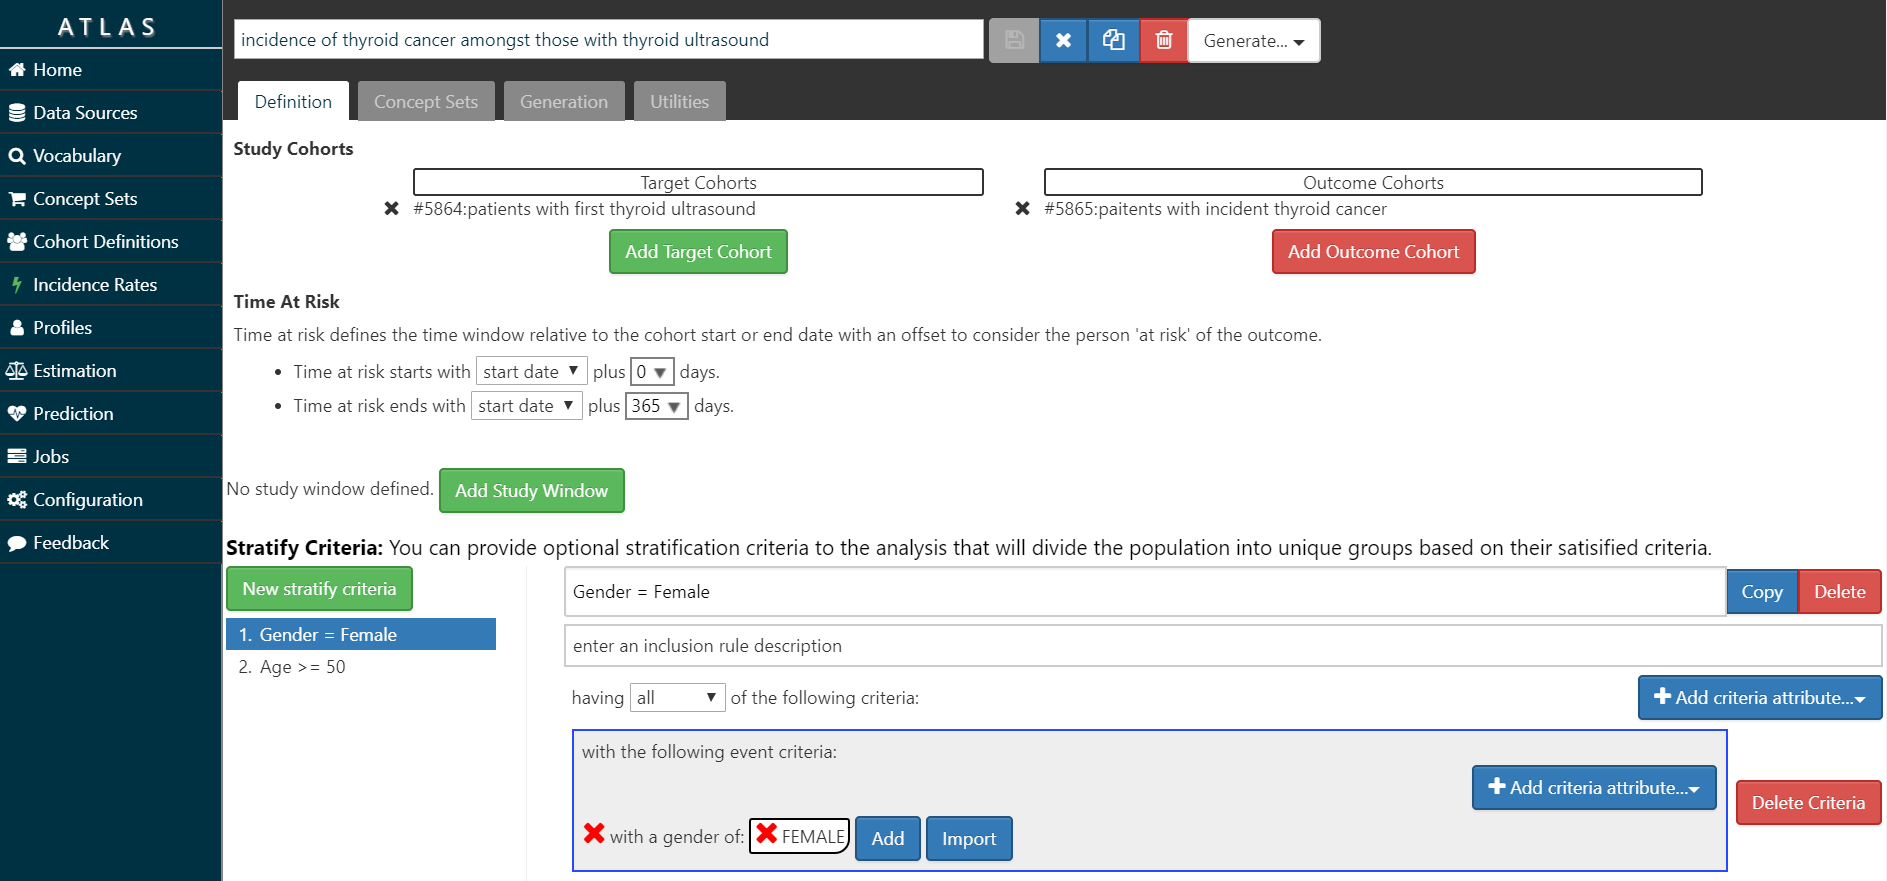
The screenshot below shows my setup: Amongst T= ‘patients with thyroid ultrasound’, we will estimate the incidence of O=’patients with thyroid cancer’ during the time-at-risk from 0 days after T cohort start (the date of the ultrasound) until 365 days after T cohort start (so, looking at 1-year incidence). I set up 2 stratification criteria: 1) Gender = Female, and 2) Age >= 50. So, with this specification, we’ll end up looking at the overall incidence rate and proportion, as well as 1-way and 2-way strata by age and gender.
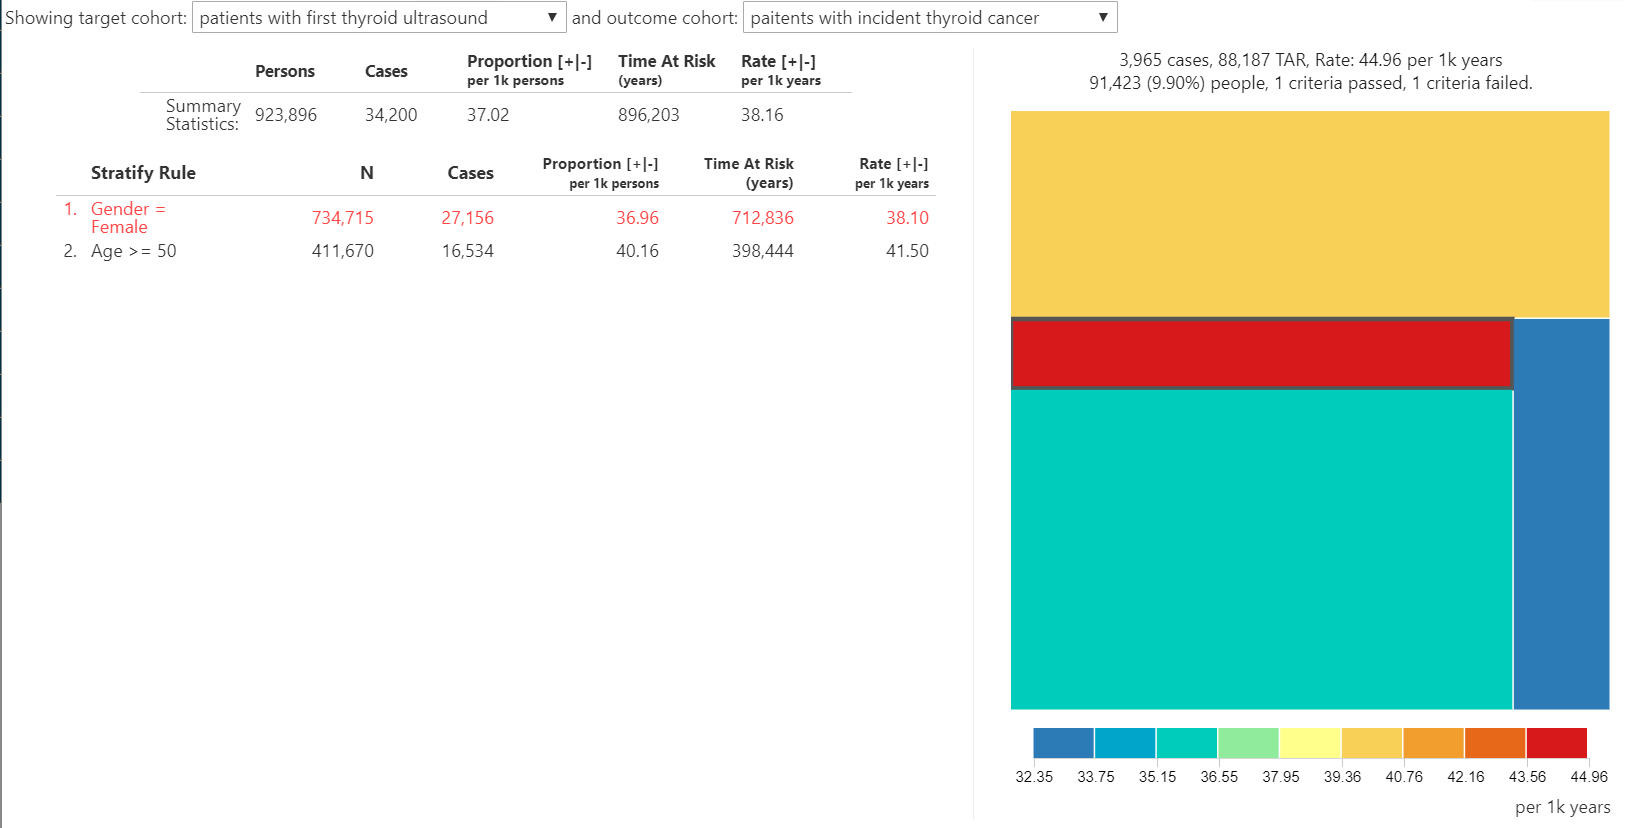
So what did our incidence summary show? The overall 1-year incidence proportion of thyroid cancer in patients with thyroid ultrasound is 3.7%. And the 1-year incidence proportion of thyroid cancer in patients with thyroid ultrasound who are female? 3.7%. That’s right, when we restrict to patients with the ultrasound, we see no difference in the incidence of thyroid cancer between men and women. Is age a ‘risk factor’? Well, 1-year incidence proportion of thyroid cancer in patients with thyroid ultrasound who are age >= 50 is 4.0%. The treemap summary shows the range of incidence rate across the 4 agegender strata only varies between 3.2% and 4.5%. Amongst patients with a thyroid ultrasound, the subpopulation at highest risk for thyroid cancer in one year is men older than 50, even though that subpopulation accounts for the smallest fraction (9.9%) of overall thyroid ultrasound cohort amongst the 4 agegender strata. But nowhere in the population of patients with the thyroid ultrasound are you see the pronounced differences by gender that were observed earlier.
So what did I learn in January?
• Thyroid disorders are pretty common, and yet evidence about the real-world effectiveness of treatments is pretty sparse. Seems like an unmet evidence need that OHDSI could satisfy.
• Thyroid cancer detection, diagnosis, and treatment is rapidly transforming around the world. Increased identification of asymptomatic disease and small-sized tumors is introducing challenging questions about whether the current practice of medical intervention is appropriate and yields better clinical outcomes versus watchful watching, and how, when or if screening should be advocated for? This also seems an area ripe for further observational study.
• It’s unclear what is the purpose or value in declaring a ‘risk factor’, but the current approach to ‘risk factor epidemiology’ may be generating information that is misleading or can be misinterpreted. Females do have more thyroid cancer than men, but does that make gender a ‘risk factor’? Amongst patients undergoing the diagnostic procedure, that incidence of thyroid cancer is no different between men and women, so is gender not a ‘risk factor’? It seems OHDSI could help establish best practices in this space to help clear up this type of confusion whenever the natural history of a disease, like thyroid cancer, is characterized.
• OHDSI tools made it easy for me to go from ‘idea’ to ‘insight’ in a stepwise fashion: ACHILLES is a good start to point you in the right direction, but isn’t sufficient for any particular research question need. ATLAS let me take it further to define cohorts, characterize baseline features, and then estimate and compare incidence within sub-populations of interest. While I could have taken this further into population-level effect estimation or patient-level prediction, it turned out that these ‘basic’ clinical characterization tools were sufficient for me to test my hypothesis and reconcile the conjectures of the key opinion leaders in the literature with some real world data.