Hi all,
I wondering about Atlas Cohort Generation Tab.
There is one line 'short results’ and ‘Inclusion Report’ tab.
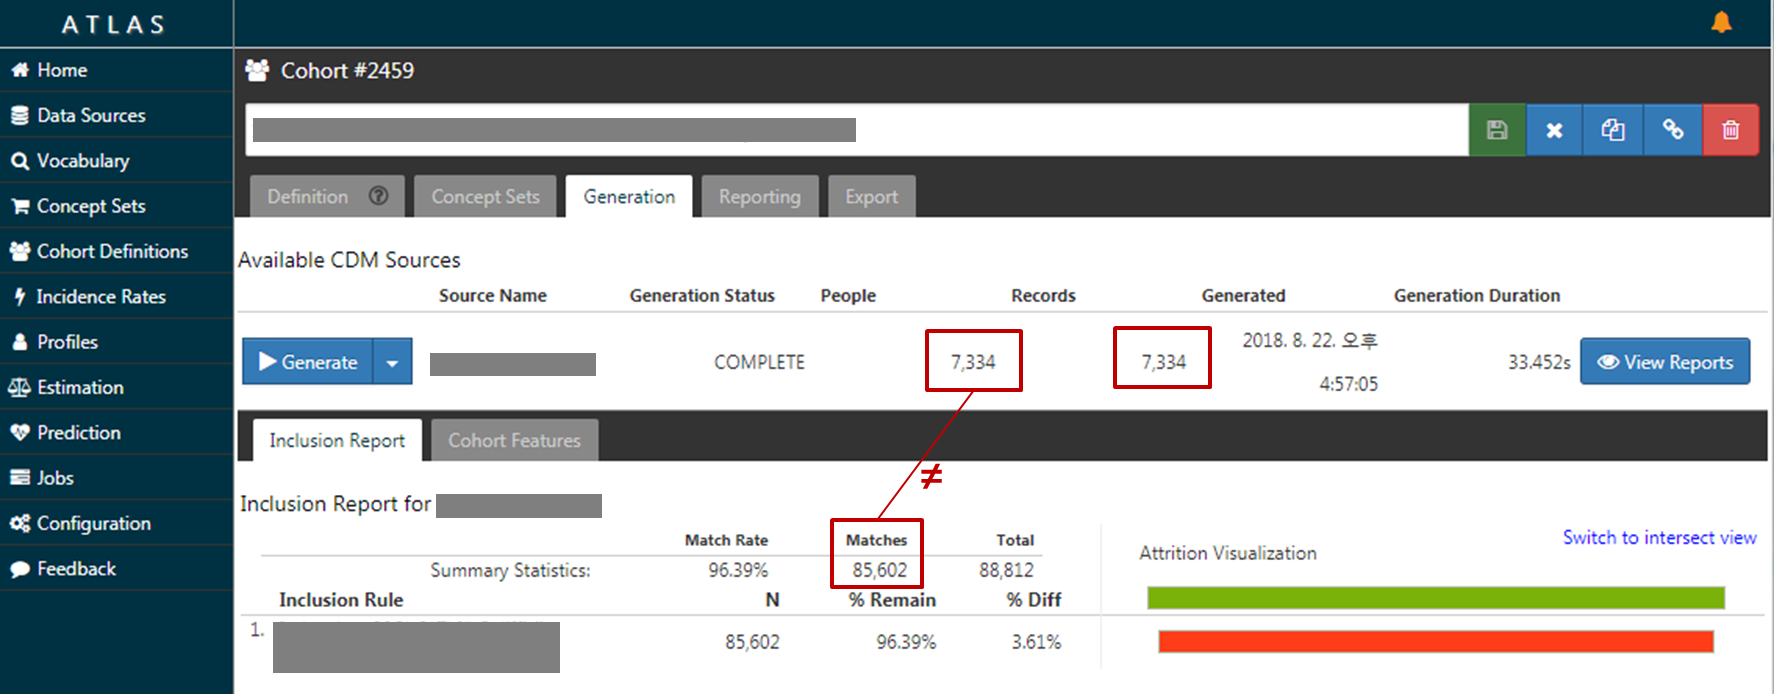
In one line 'short results’, there’s Records(People) value. And in ‘Inclusion Report’ Tab, there’s ‘Matches’ value.
That two value is not same value. Is that normal(right) outcome?
(maybe Records(People) value is count of ‘COHORT’ table, and Matches value is column value of ‘COHORT_INCLUSION_RESULT’ table)
1 Like
The Inclusion Report shows the impact of your Inclusion Rules against your Initial Events. This report is saying that you started with 88,812 initial events (note, there could be multiple events per person here), and after all inclusion rules were applied, you were left with 85,602 events. Those 85,602 events were used to construct 7,334 episodes (the ‘Records’ column at the top) for 7,334 people (the ‘People’ column), showing that each person has exactly 1 episode.
Without seeing your Definition from your screenshot, I can deduce the following:
- You selected ‘all events per person’ for your Inital events.
- You did not specify any Exit specification, so all your initial events start at the event start date, and ends at the observation period end date that contains the event.
Conclusion: due to no Exit specification, all events will collapse down to 1 episode per person, starting with the earliest event per person and ending with the observation period end date.
As an experiment with this cohort definition, try setting the Exit to a fixed number of days after the event start date: 30d. What this will do is cause each event to have a fixed time duration of 30d, and any events found within 30d of each other will be ‘grouped’ together, and any events that are spaced more than 30d apart will create separate episodes. What you should see in your Inclusion Report is the same number of events being processed, but you will get different numbers of ‘Records’ (aka: episodes) because you are specifying that an initial event now has an end.
3 Likes
Hi Chris_Knoll,
thanks for your explanation.
I noticed that in the newest version of OHDSI atlas, we have two sub-tabs (by events and by person) under Inclusion Report. Could you kindly explain what is the difference between the numbers within these two sub-tabs?
thanks
Ziran
Glad you asked!
Prior to this change, the report was always using the individual ‘cohort entry events’ in the reports. This led to some confusion when you allow multiple events for a single person, making it hard to understand 'how many people actually qualified for each inclusion rule in my cohort? It is less confusing when you specify ‘Earliest event per person’ because that restricts the events to a single event per person, letting you interpret the numbers as ‘people’.
The limitation here is that you might want to allow multiple events per person to be evaluated for cohort inclusion, but that makes the report look like the counts are higher than actual people (which is described in the original post).
So, the change was to select the ‘best’ event per person; the ‘best’ event is the event which matches the greatest number of inclusion criteria. So, you may have a person with 5 events, and 1 of the events meets 3 of 5 criteria, and another event meets 5 of 5 criteria. On the ‘person’ tab, we’ve selected the best event per person, so that you can see the counts that represents ‘people’ instead of ‘events’. The numbers under the ‘person’ tab are where you have exactly 1 event per person, and it gives you the statistics for the ‘best case scenerio’ across all people. With this change, you will find that the ‘Matches’ value in the Inclusion result will match the count in the ‘People’ column of the summary table at the top, while the Event report will only match the summary table IF you specified the cohort definition should limit to one event per person.
Hope this makes sense? I’m happy to add any clarifications if you have additional questions.
@Eunsil_YOON, it would be interesting if you could provide a screenshot of your cohort results using the 2.6 version, so that we can see the difference between the ‘event-level’ and ‘person-level’ inclusion reports.
Thanks so much, Chris_Knoll
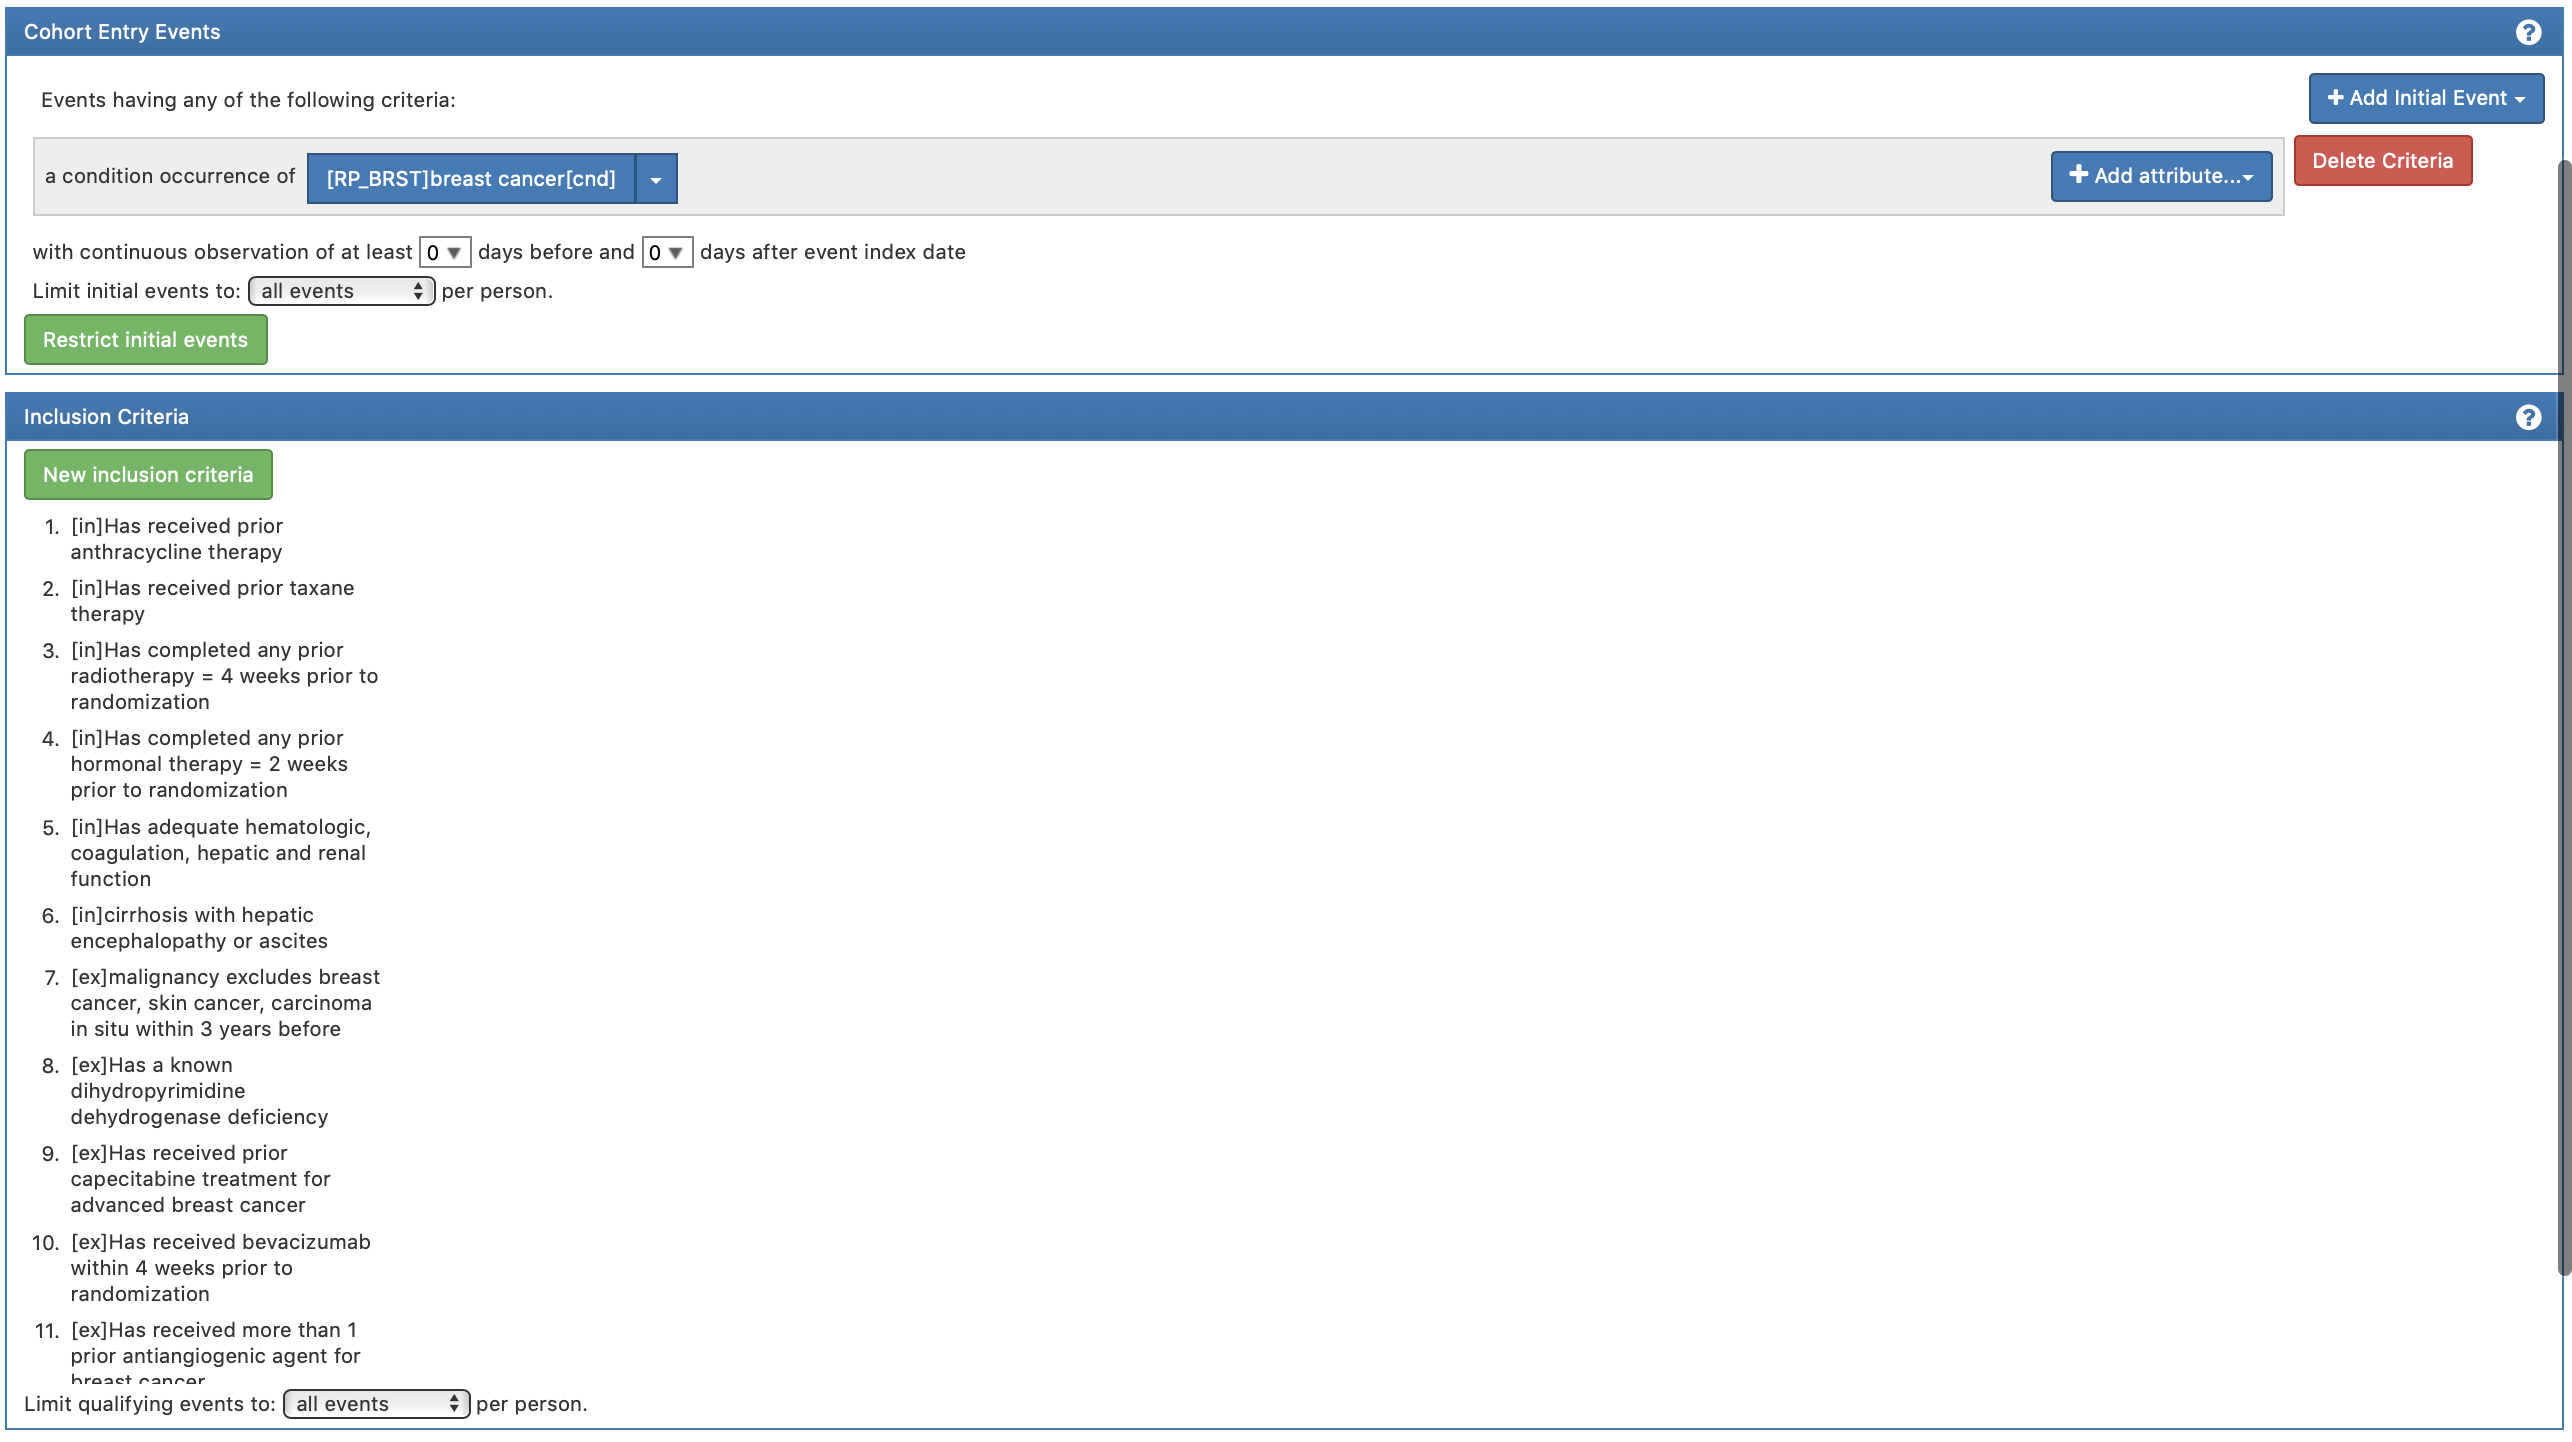
In my research, I’m trying to identify a cohort against a set of eligibility criteria of a clinical trial during a specific time period. I allow multiple initial events for a single person, but I’m interested in the number of eligible patients rather than events. I do not set any censoring event for cohort exit
you said “a person with 5 events, and 1 of the events meet 3 of 5 criteria, and another event meets 5 of 5 criteria.” I’m a little bit confused that every identified person in the result must have at least one initial event that meets all of the criteria (5 of 5 in your example), right?
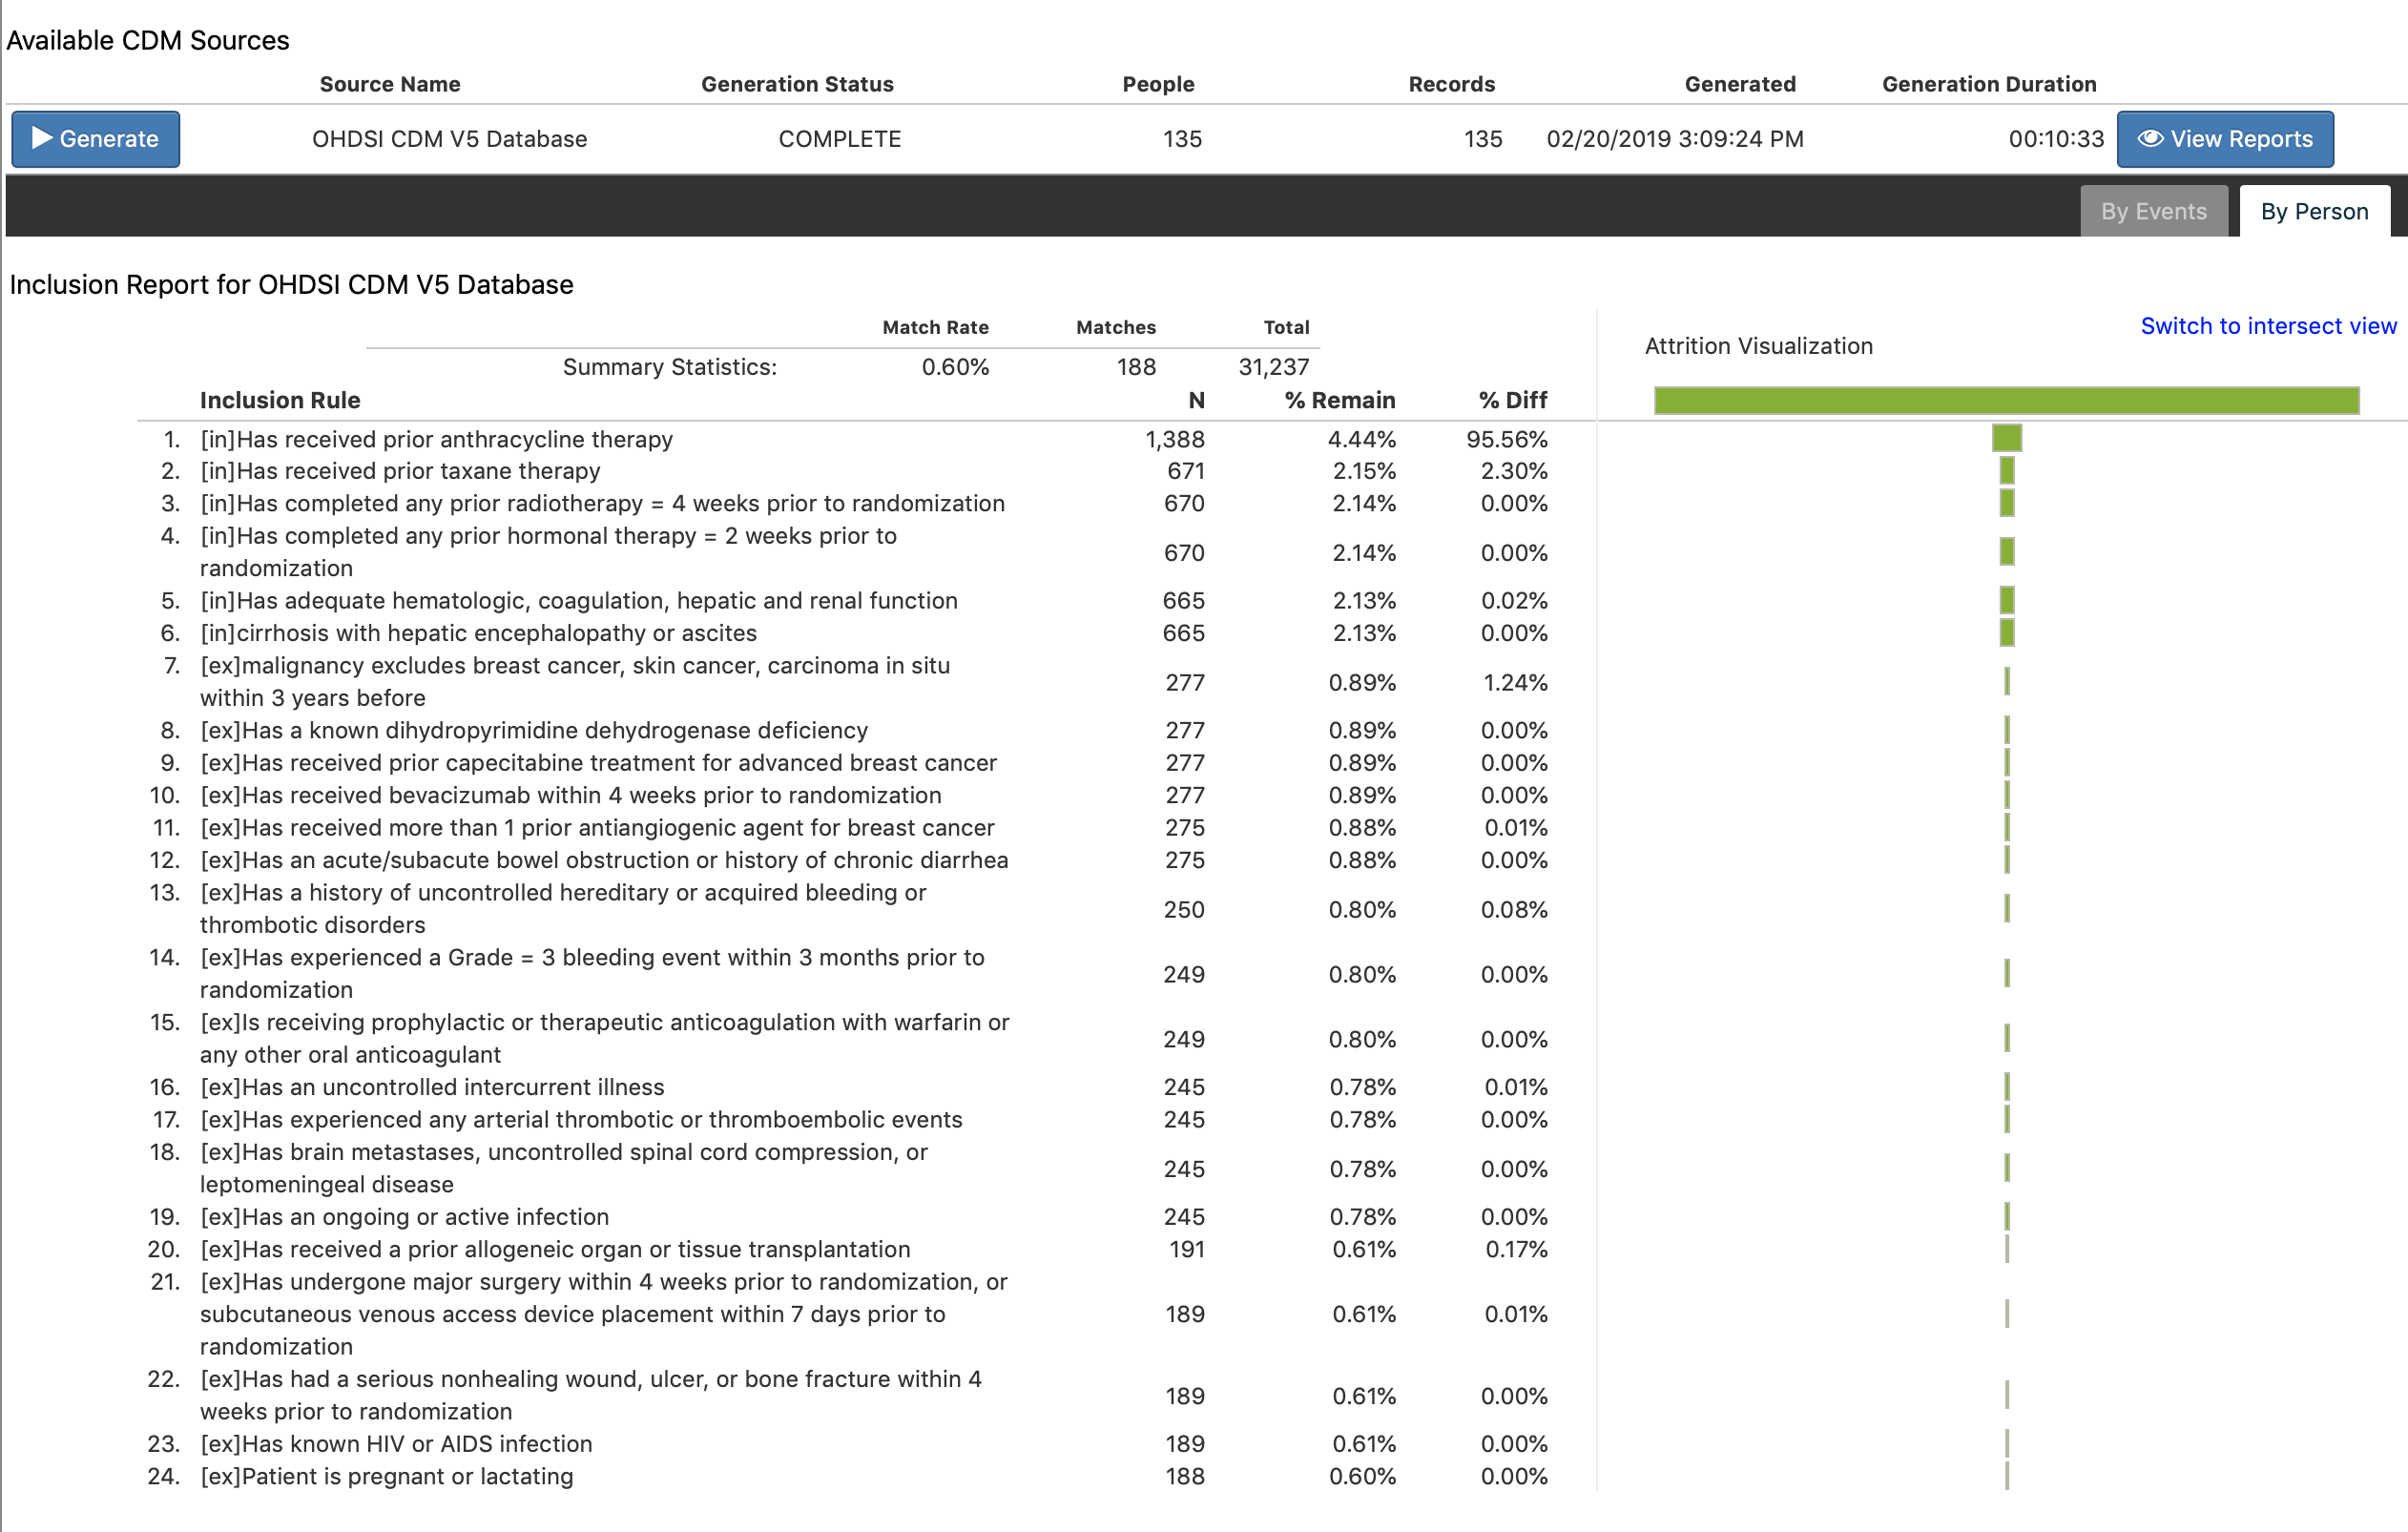
in my result, the number of matches (188) in the Summary Statistics is larger than the number of people (135) and the number of records (135) in the overall result. according to your last post, this means the 188 “best” events were used to construct 135 episodes for 135 people, right?

Thanks so much for your patience and response!
Ziran
Hi, thanks for including screenshots, since this will be much easier to explain. The only extra thing I’d ask for is a screenshot of the ‘By Event’ tab so we can see the differnce between Events vs. Person.
But, to your questions:
I’m sorry I wasn’t clear here: My point was that you could identify a person with an entry event satisfying 3/5 criteria, and a separate event that satisfies 5/5 criteria. On the ‘By Event’ tab, this person would contribute 2 ‘counts’ to the ‘Total’, while on the ‘By Person’ report, this person would only contribute 1 count (using the event that matched 5/5 criteria).
Your statement: “I’m a little bit confused that every identified person in the result must have at least one initial event that meets all of the criteria (5 of 5 in your example)”…if ‘the result’ you mean the ‘Matches’ count, then yes, this person contributes to the ‘Matches’ count because they matched 5/5 criteria and contributes to the ‘Total’ count because they were found in the ‘Cohort Entry Events’. If the ‘best’ event was only 3/5, then the person would not contribute to the ‘Matches’ count, but would contribute to the ‘Total’ count because they were identified in the ‘Cohort Entry Events’. I hope i’m understanding what you mean by ‘the result’
The key here is that on the person report, a person is counted exactly once via their ‘best’ event from the ‘Cohort Entry Events’. Note: there may be a person that matched 0/5 criteria, but they were initially identified by the Cohort Entry Events, but then didn’t make it to the final total due to failing to meet all criteria.
You have it right, but you have a special setting in your cohort definition for ‘left censoring’ and ‘right censoring’! Let me explain this:
According to the Inclusion Report (by Person), you see 31,237 total people (that’s the distinct people that were identified in the Cohort Entry Events). After all inclusion criteria were applied, only 188 people were found to satisfy all inclusion criteria. Why does the main cohort only have 135??
Well, you also specified a left censor of 2011-08-17 and a right censor of 2013-02-05? This means that anyone who started before 2011-08-17 will have their cohort start date re-set to 2011-08-17. Likewise with right censoring, anyone whose cohort end date ended after 2013-02-05 will have their cohort end date reset to 2013-02-05.
But, what about those people who’s cohort era completely preceded or completely followed the period 2013-02-05 → 2013-02-05? They didn’t appear during the censor window, so those people are dropped! By the way, the number of people dropped is not reported anywhere on this report, however that statistic will be reported in an upcoming release.
But, since you know that 188 people matched all the inclusion criteria but 135 made it into the final cohort, then there were 53 people who fell out side of your left/right censor window! Mystery solved! To confirm this, if you remove your left/right censoring from your cohort definition and re-run, you should see 188 people in your cohort.
Out of curiosity, could you post your ‘By Events’ report so we can see the difference between the ‘By Event’ and ‘By Person’? It would be educational.
Very clear explanation! thanks
I set left / right censor time because I want to simulate the recruitment process of clinical trial in OHDSI and the trial was conducted in this time period.
Here is the “By Events” report.
and interpreted as: we identified 668,837 Cohort Entry Events in total and of which 2,971 events meet all inclusion criteria. These 2,971 events belong to 188 patients before trimmed to 135 by left/right censor time. correct?
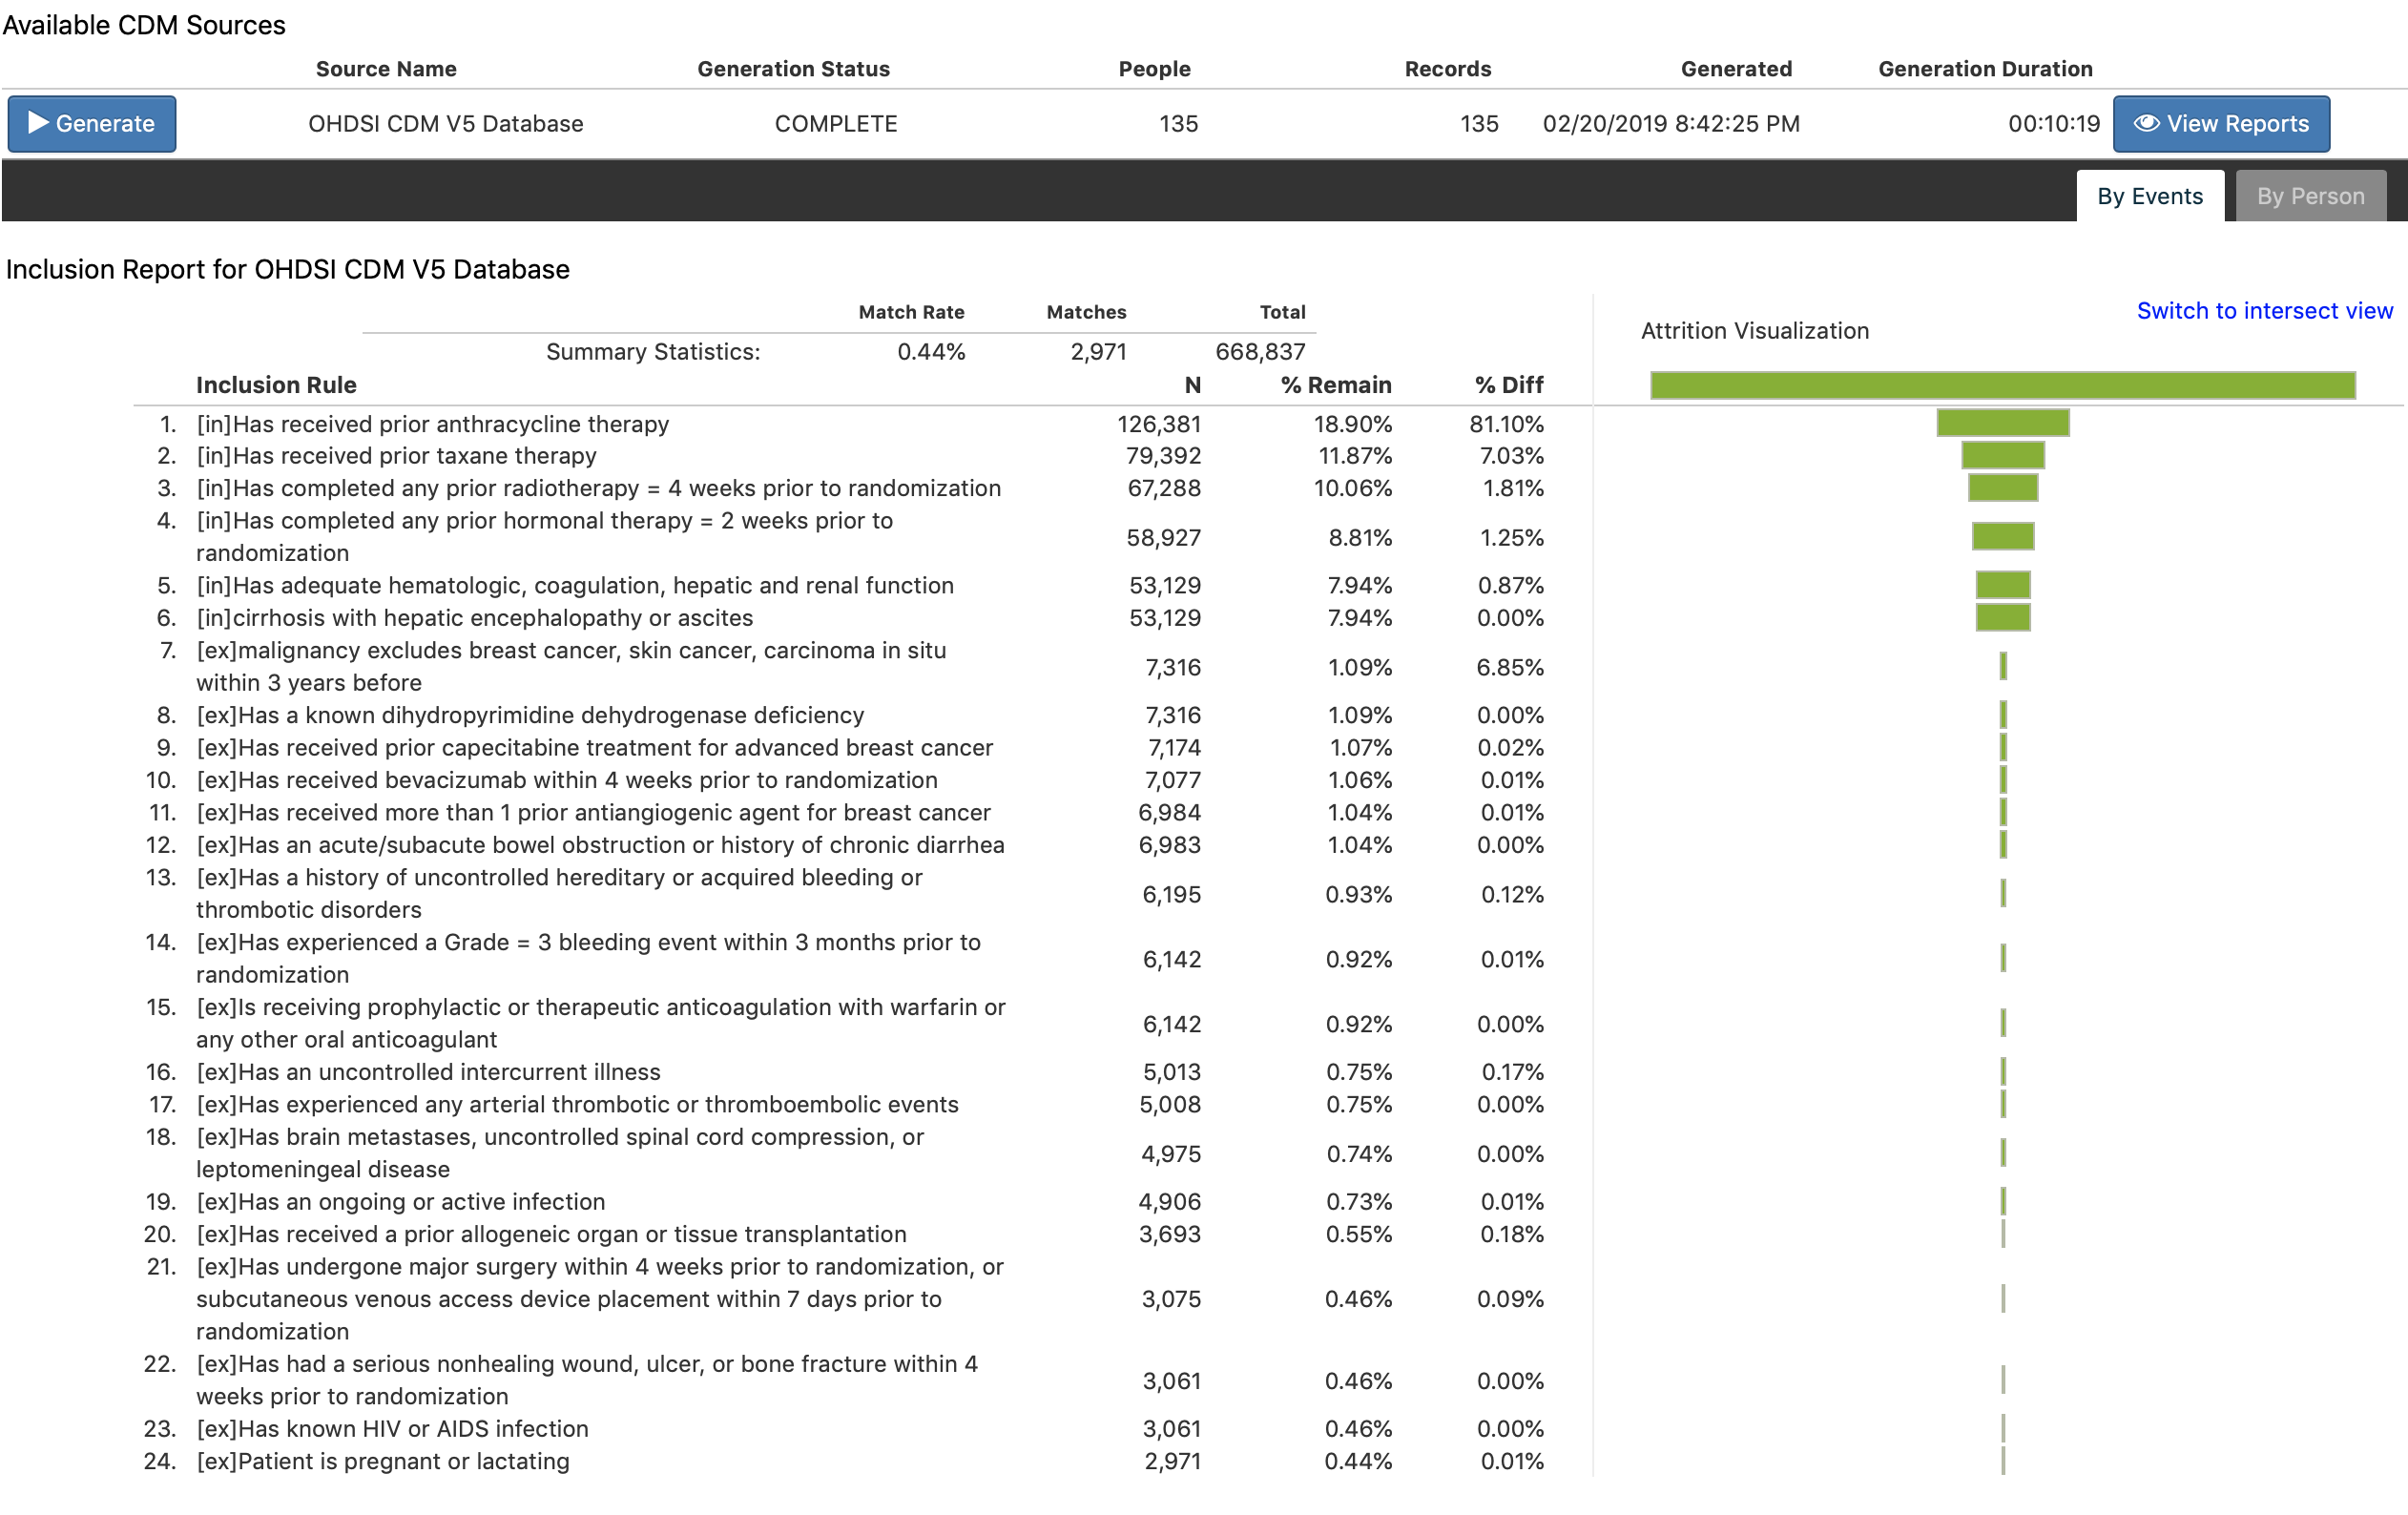
Yes, you got it perfectly! I will just add, tho, the last statement was not deduced directly from the ‘By Events’ report: you used the Matches from the ‘By Events’ and compared it to the ‘By Person’ report to understand how the 2971 events became 188 patients. And then you compared the 188 patients from the ‘By Person’ report, and the 135 people from the final cohort count to determine you lost 53 people due to censoring. In the next release of Atlas, if there were people lost to censoring, you will see an additional column to the right of the ‘Total’ showing ‘Lost from censoring’ so you do not need to do the math.