Hi Everybody,
I’ve set up a study that intends to look at: is there a difference between vaccination rates in homeless patients v non-homeless patients.
I’ve got my cohorts defined for Homeless, Not Homeless and Vaccinated.
I’ve run Strategus using the attached nachc-covid-homeless_CG_CM.json file. This file includes just the following two moduleSpecifications:
- CohortGeneratorModule
- CohortMethodModule
nachc-covid-homeless_CG_CM.json.txt (146.5 KB)
Strategus runs and generates data (attached zip). The data for CohortMethod seem to be populated (11kb cm_analysis.csv, 9kb cm_covariate.csv, 19kb cm_likelihood_profile.csv, etc).
CohortMethodModule_2.zip.txt (25.1 KB)
I’ve created a Shiny app.R file that uses the attached config.json. This includes only the following:
- About
- Datasources
- cohortGenerator
- cohortMethod
appForCovid.R.txt (927 Bytes)
config-for-covid.json.txt (1.6 KB)
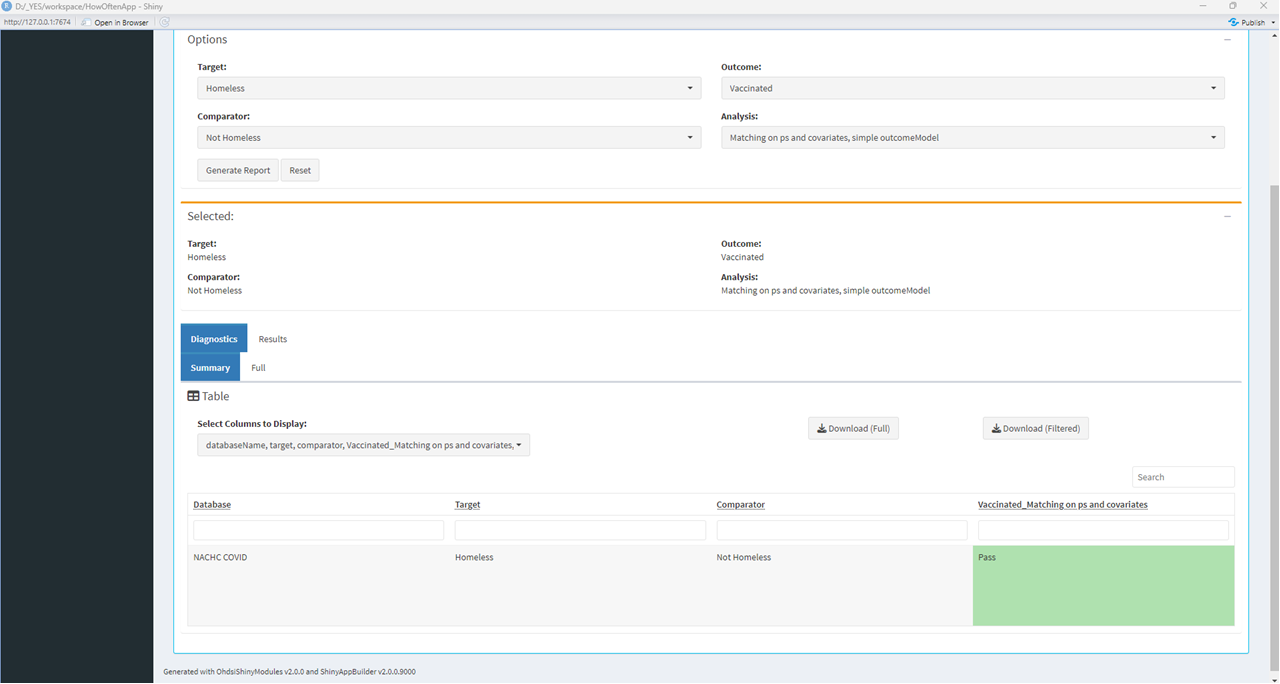
The Shiny app doesn’t really show any analysis (screen shot below).
What do I need to add in to get the types of tables, graphs, etc. a data scientist would be most interested in? I had thought that this was part of the CohortMethodModule but either I thought wrong or I’m not configuring the Shiny app or something else correctly.