Hey everyone,
I’ve since had some progress with this. I missed the part where I had to add the OpenSourceSubProtocolOverride to the source connection string and now it works.
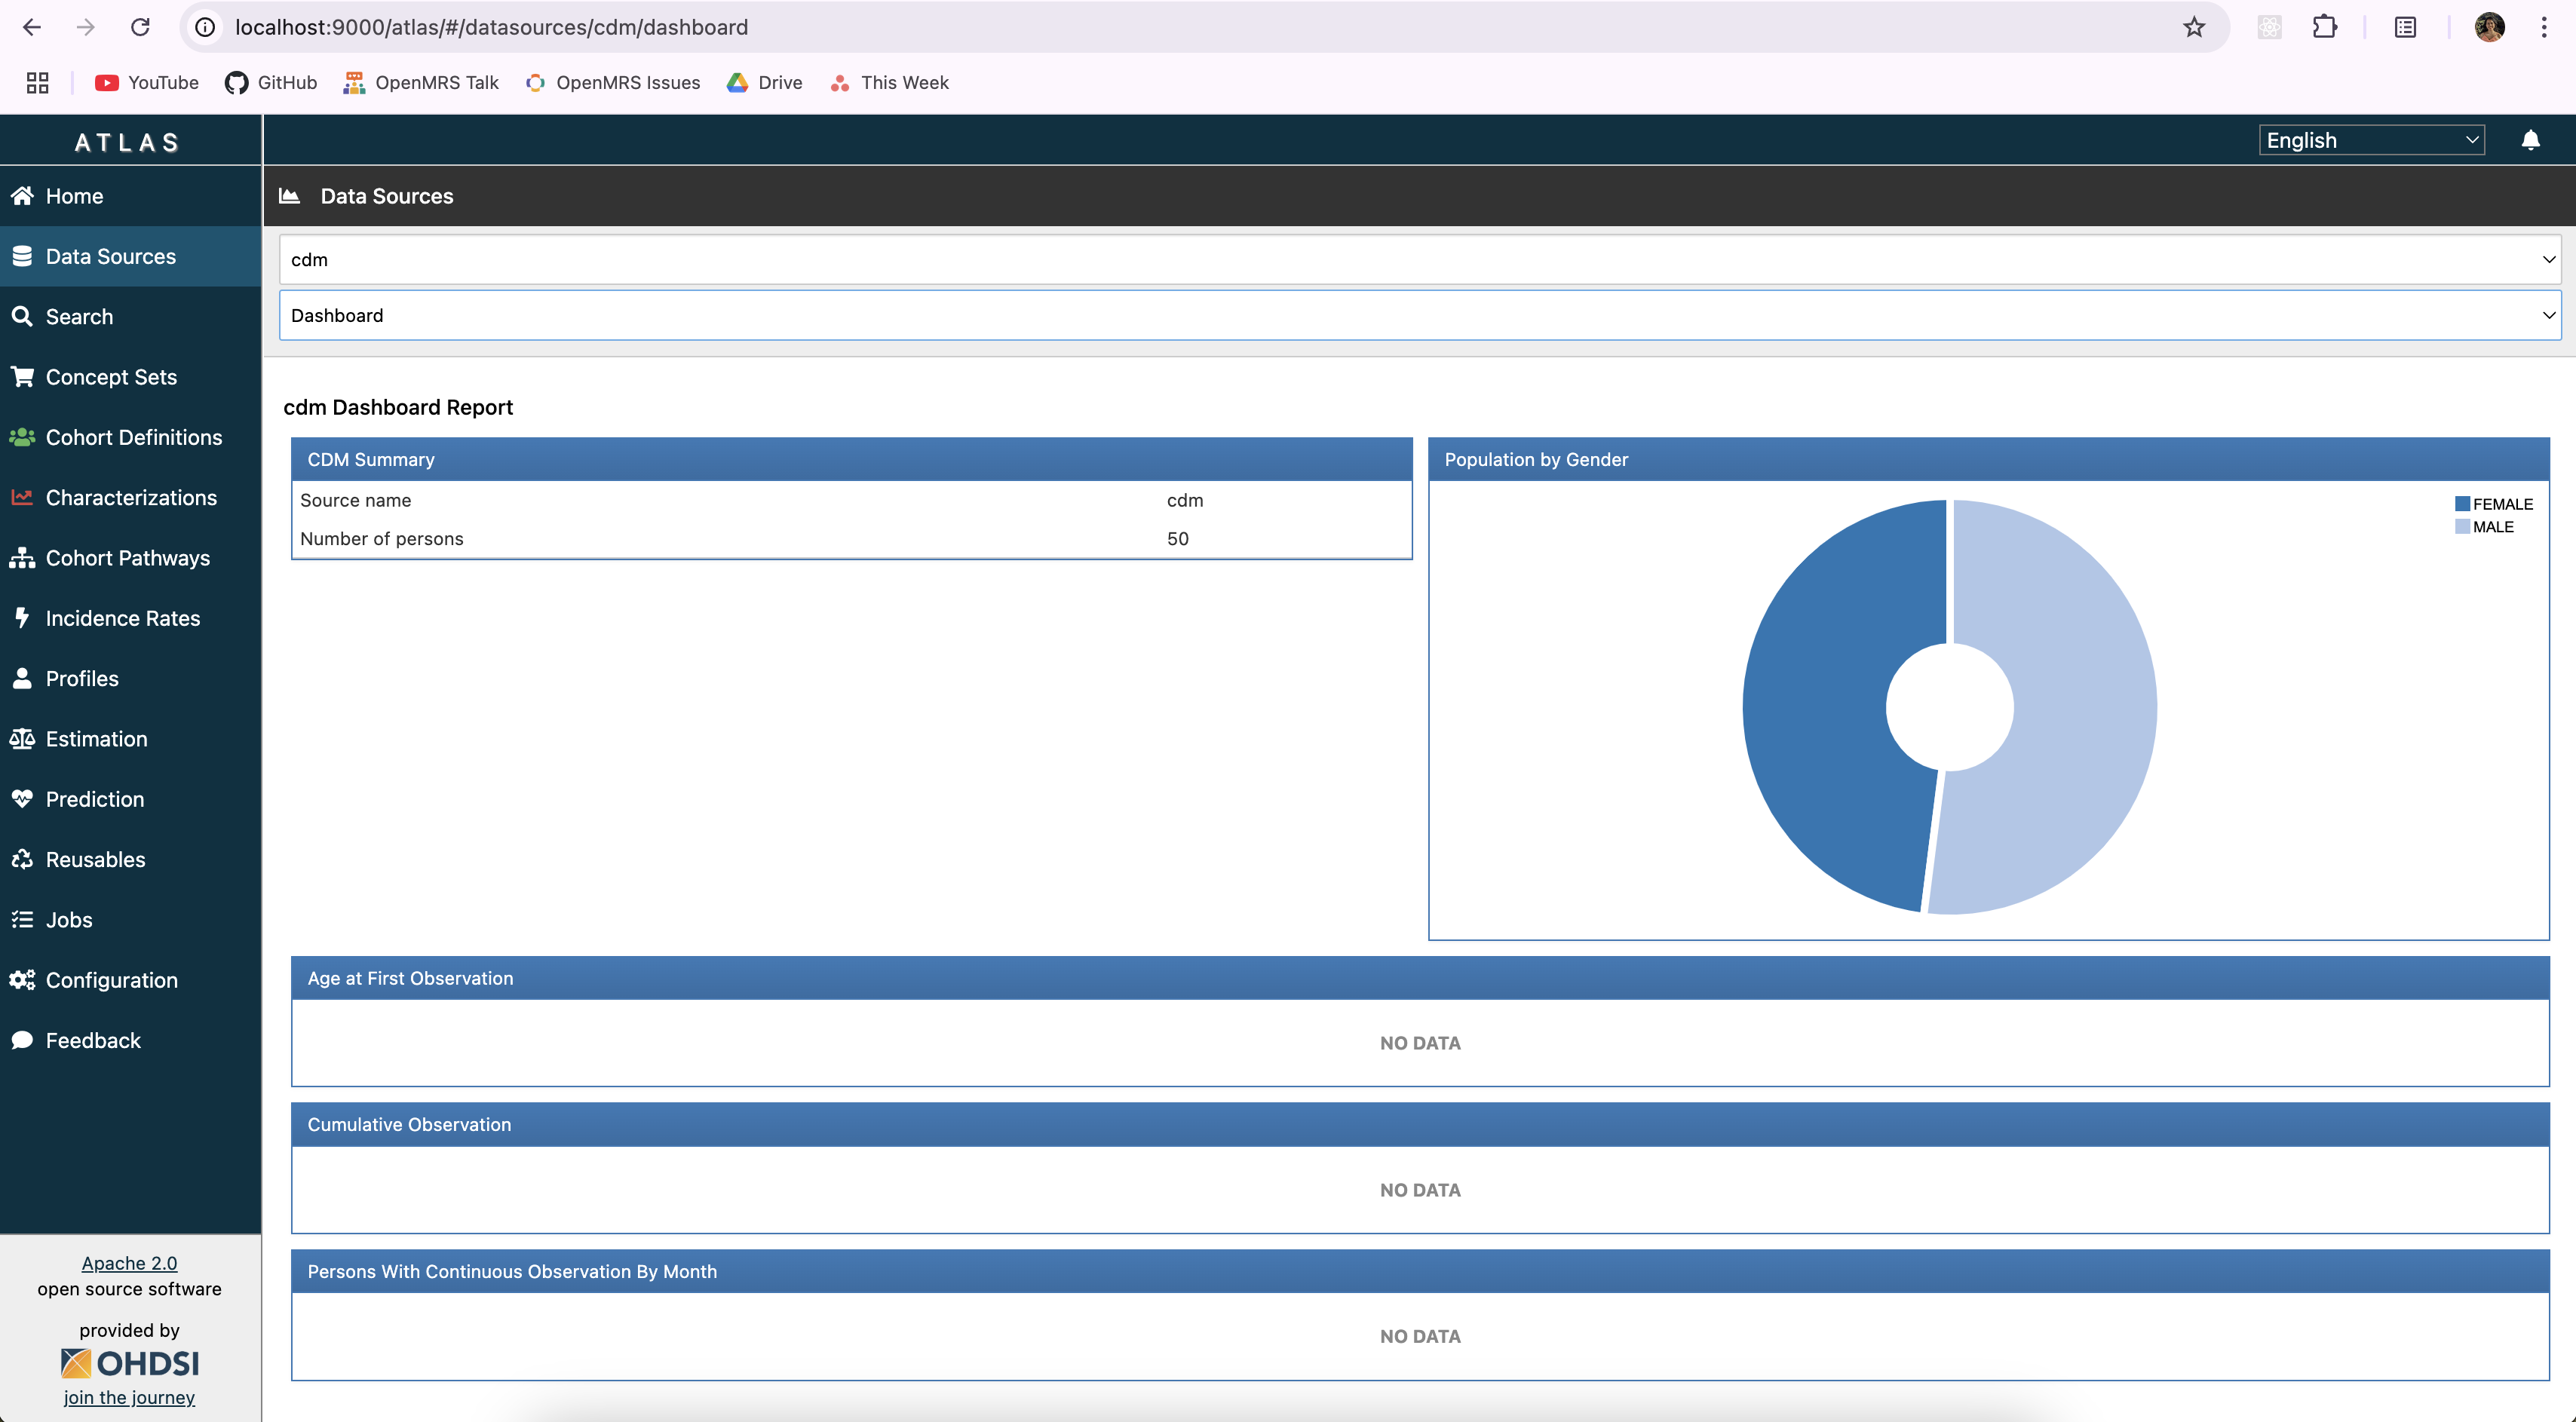
Right now I have about 50 people in the person data. I’ve only populated the person, visit_occurence, and location (in addition to the concept, vocabulary, domain, relationship, drug_strength, concept_ancestor, concept_class, concept_relationship, concept_synonym). I have run achilles on my cdm database.
When I look at the dashboard, the chart is rendered correctly.
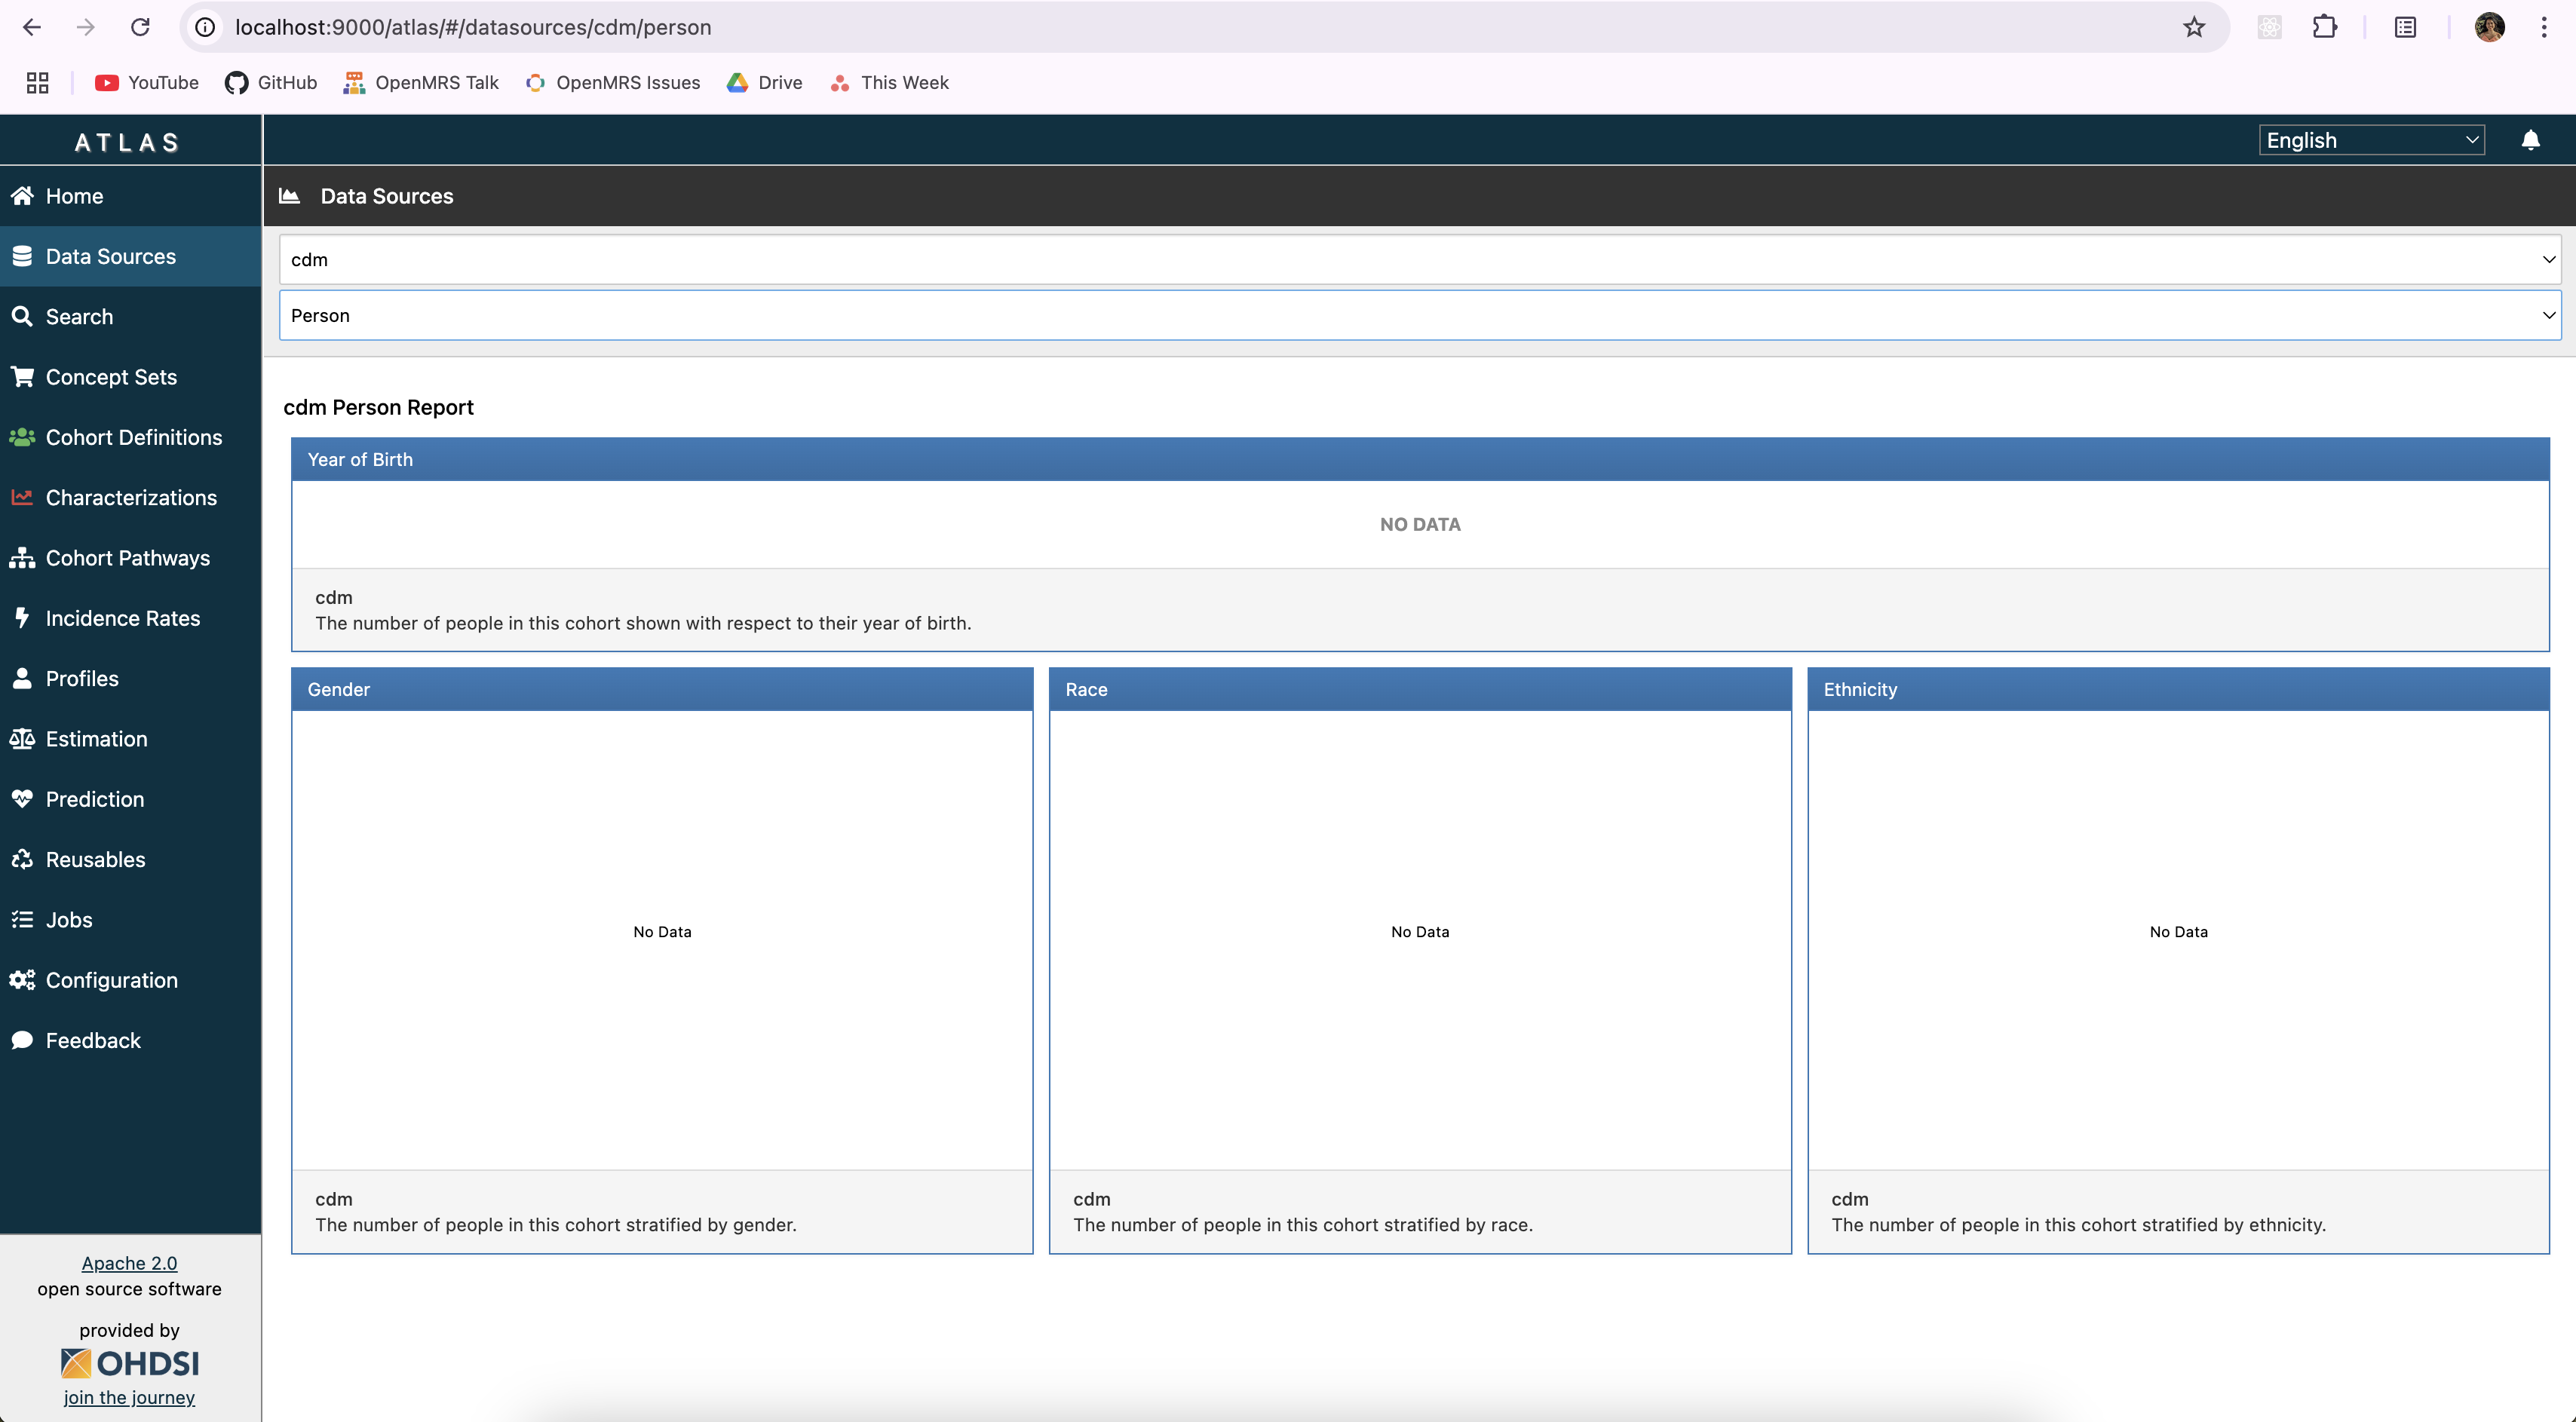
But when I look at
person, it appears to be empty. Shouldn’t the number of people per gender be rendered? Am I missing something? Is there an extra step that I should do to get the visualizations that fall under the person option?