Help with visualizing data in Atlas

Hi there!

I’ve set up WebAPI 2.14.0 and it is running on Tomcat (port 9000). I created a OMOP CDM database schema using the CommonDataModel R package to use a database called omop_cdm (different from the database that the WebAPI uses) and updated the source and source_daimon table in the webapi schema.
This is the record in the webapi.source table:

source_id source_name source_key source_connection source_dialect username password krb_auth_method keytab_name krb_keytab krb_admin_server deleted_date created_by_id created_date modified_by_id modified_date is_cache_enabled
4 omopcdm omopcdm jdbc:postgresql://server:5433/omop_cdm postgresql ohdsi_admin_user admin1 PASSWORD false

These are the records in the webapi.source_daimon table:

source_daimon_id source_id daimon_type table_qualifier priority
2 4 0 cdm 0
4 4 2 results 1
5 4 5 temp 0

This is the result from /WebAPI/source/sources:

[
  {
    "sourceId": 4,
    "sourceName": "omopcdm",
    "sourceDialect": "postgresql",
    "sourceKey": "omopcdm",
    "daimons": [
      {
        "sourceDaimonId": 2,
        "daimonType": "CDM",
        "tableQualifier": "cdm",
        "priority": 0
      },
      {
        "sourceDaimonId": 4,
        "daimonType": "Results",
        "tableQualifier": "results",
        "priority": 1
      },
      {
        "sourceDaimonId": 5,
        "daimonType": "Temp",
        "tableQualifier": "temp",
        "priority": 0
      }
    ]
  }
]

I downloaded the vocabulary from Athena, and loaded the data into the relevant tables with the scripts from here in to the schema cdm in the database omop_cdm. But I think something has gone wrong, I’m not sure what. When I go to the url /WebAPI/vocabulary/vocabularies, I get the error:

{
  "payload": {
    "cause": null,
    "stackTrace": [],
    "message": "An exception occurred: javax.ws.rs.WebApplicationException",
    "localizedMessage": "An exception occurred: javax.ws.rs.WebApplicationException",
    "suppressed": []
  },
  "headers": {
    "id": "5ef45795-78e5-cb5f-7526-06a8c08b72fc",
    "timestamp": 1742479969484
  }
}

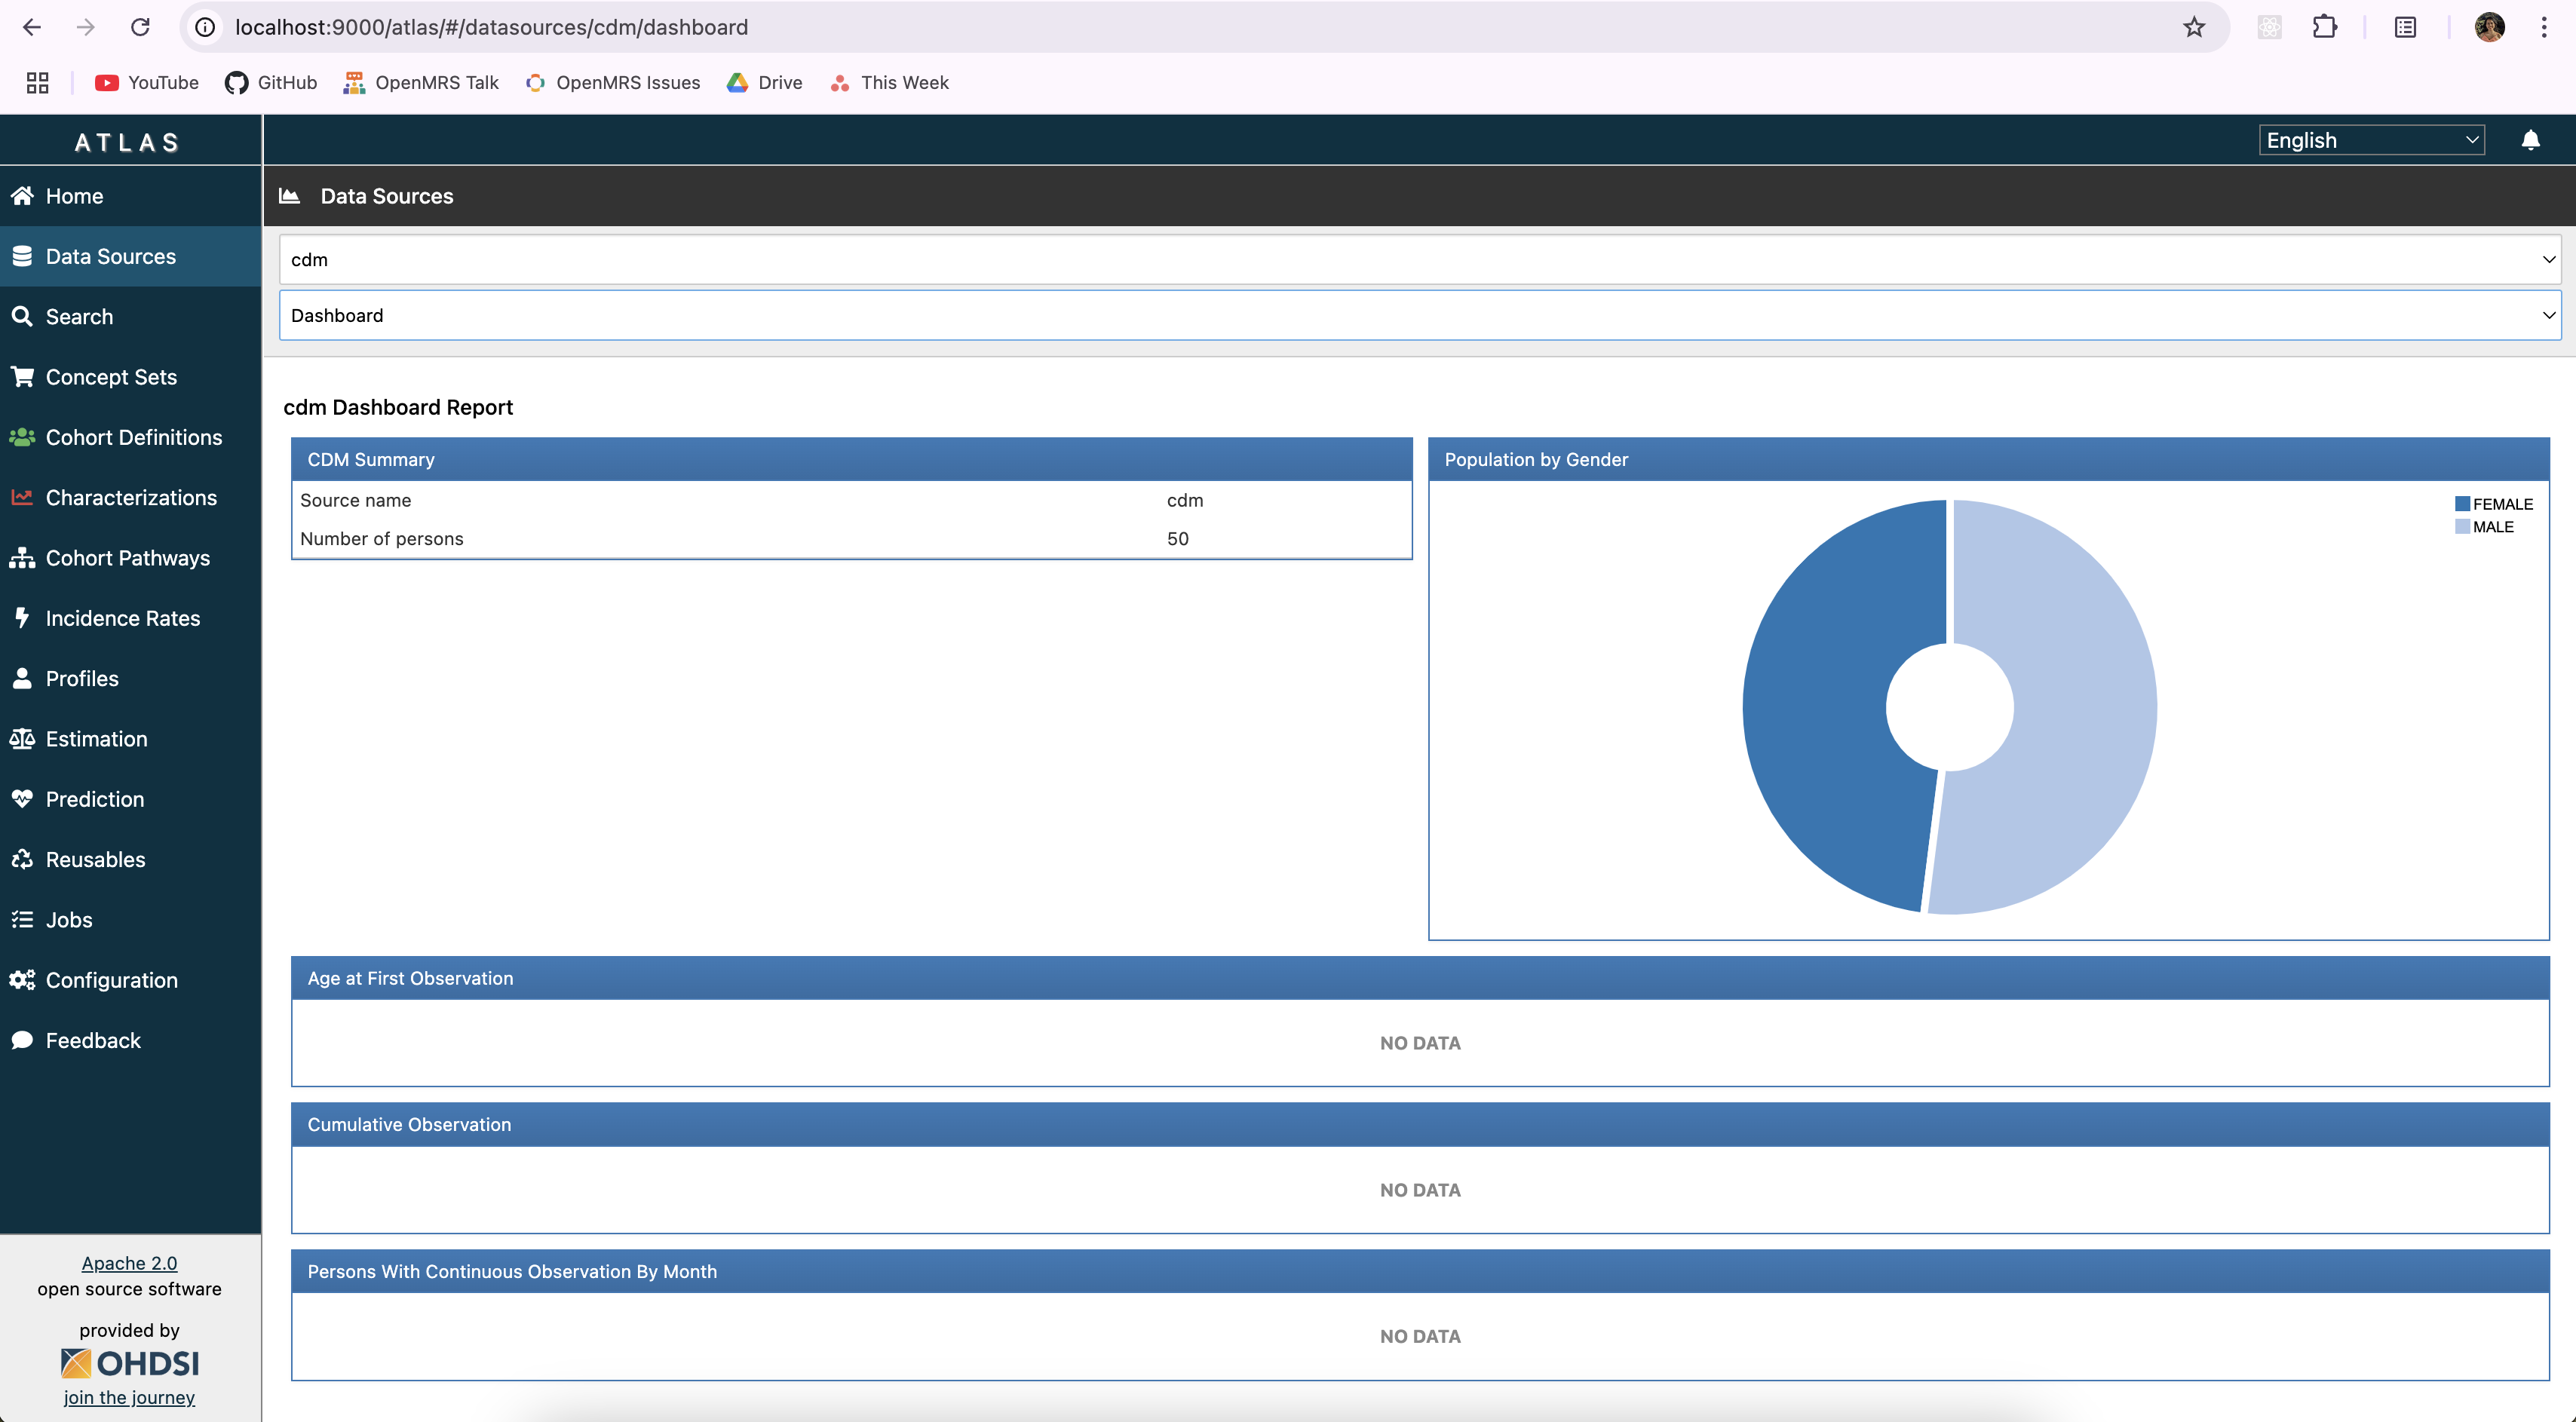
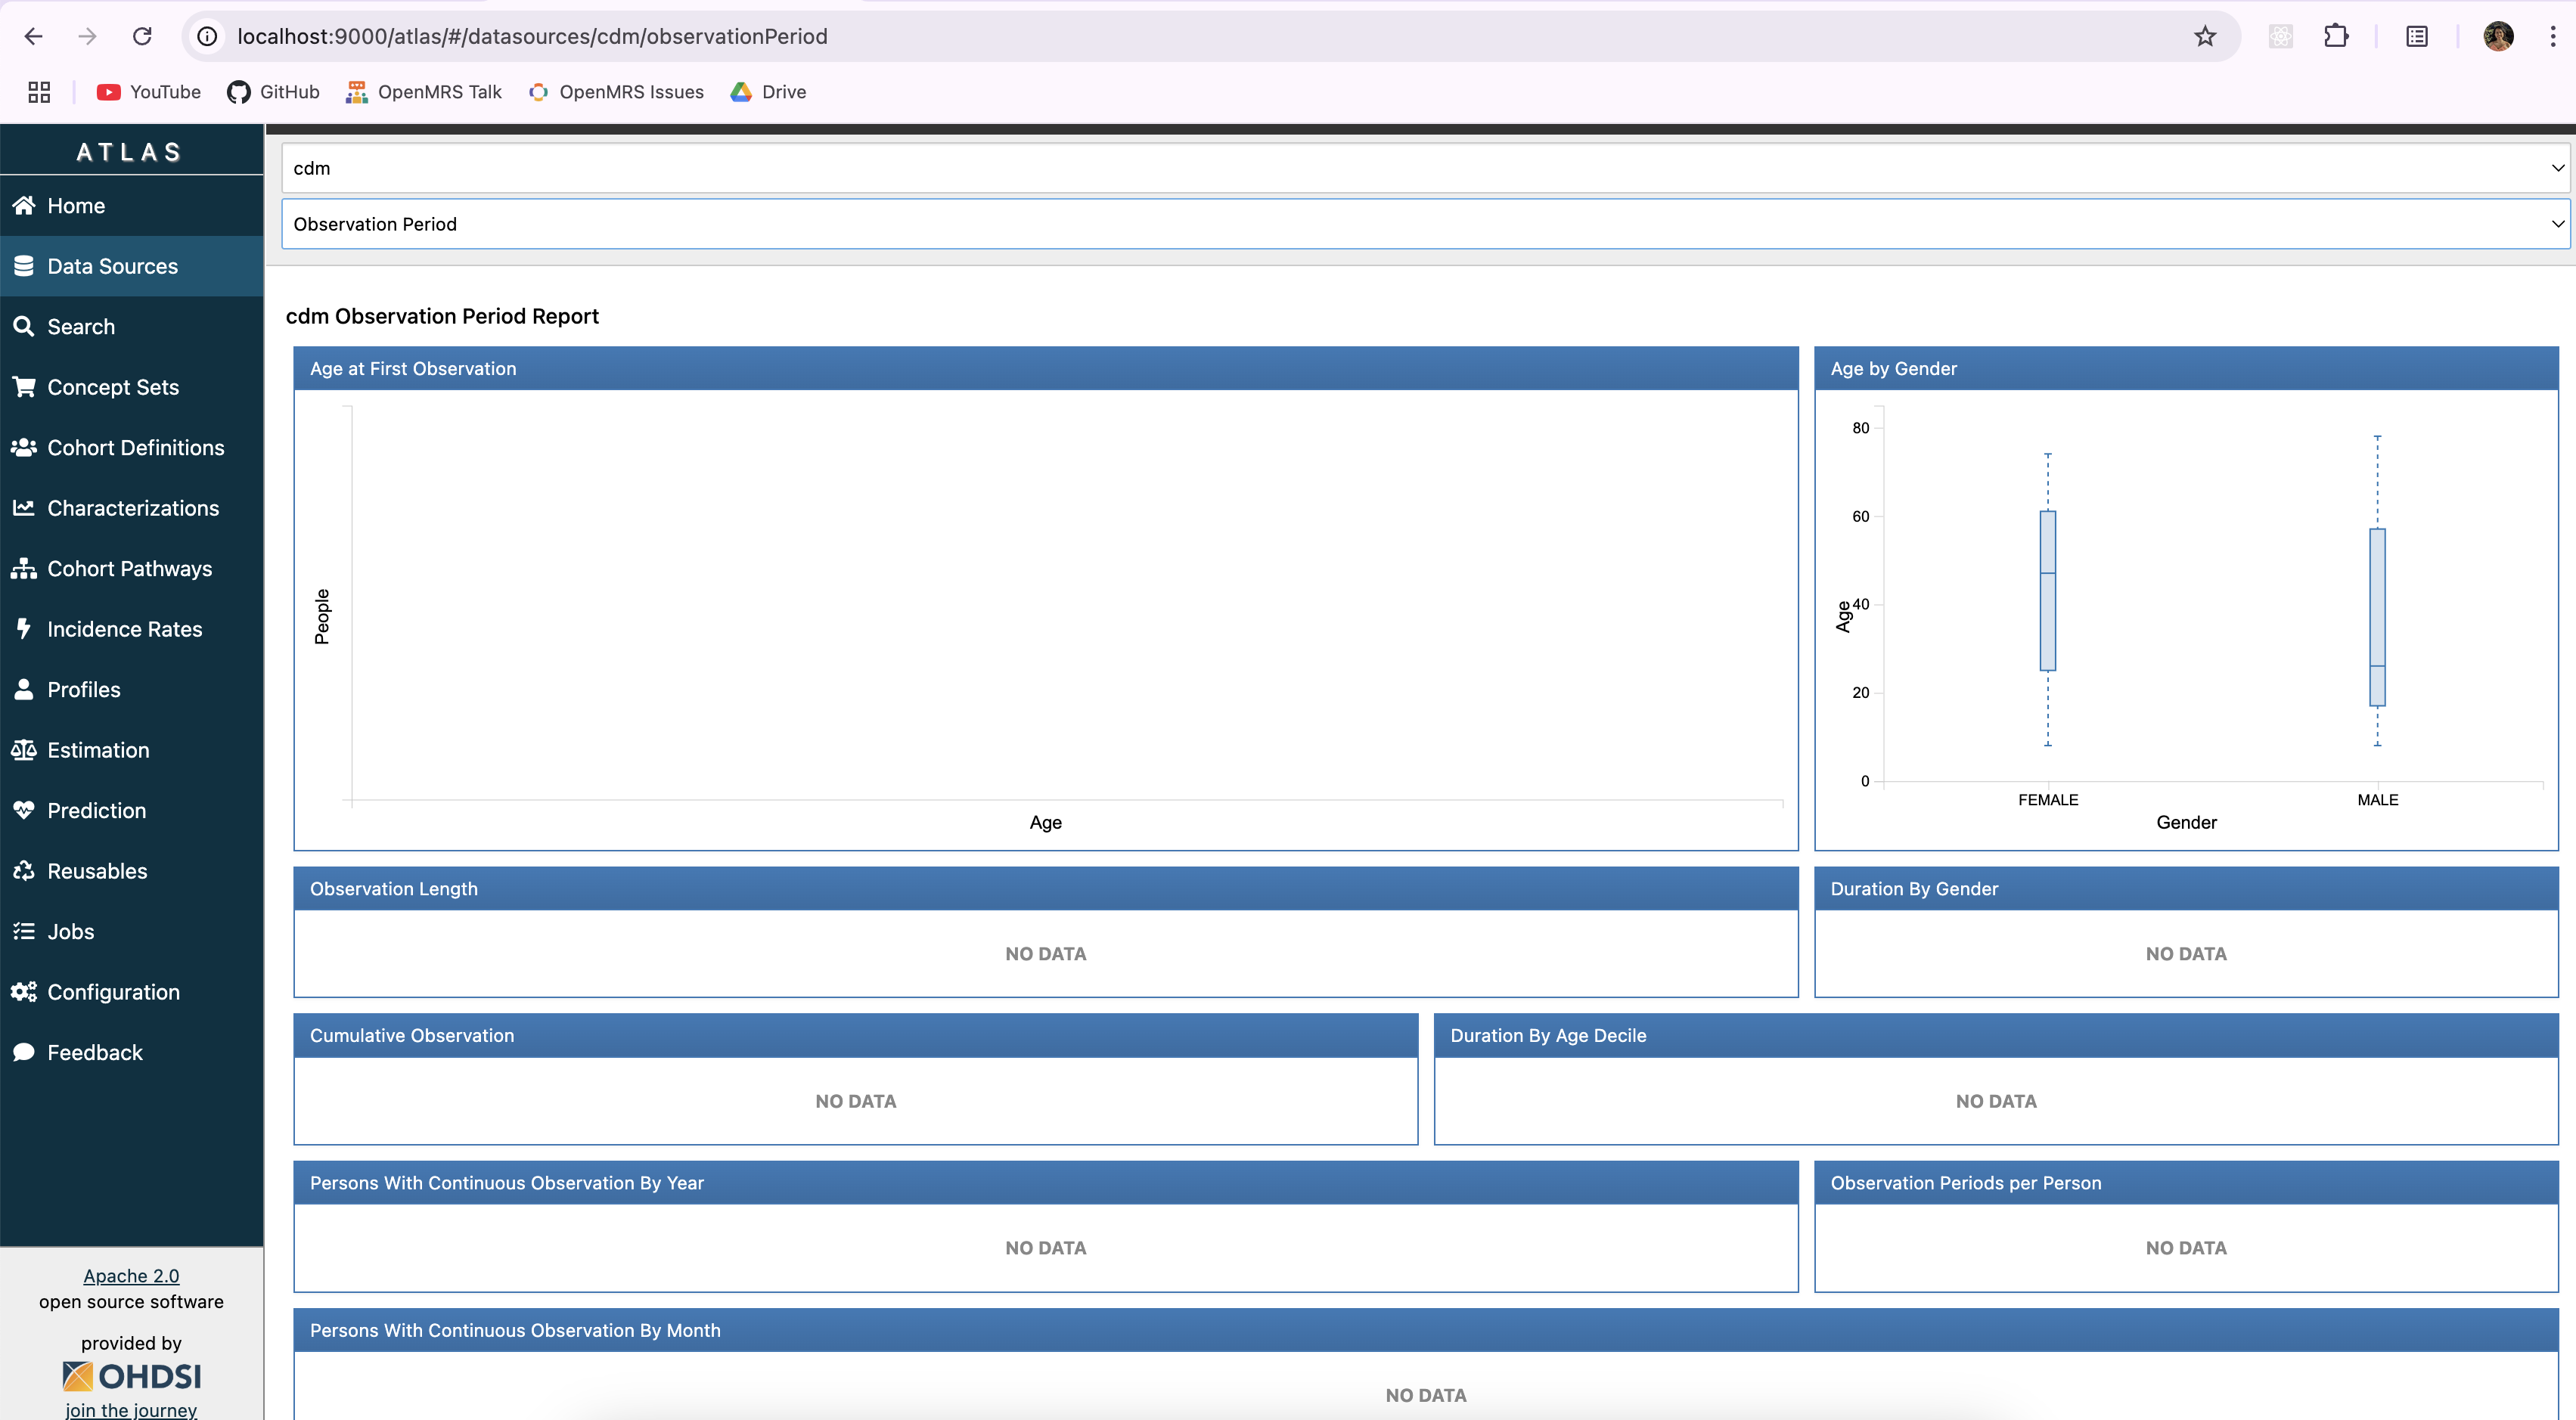
I don’t see a vocabulary version for the source on Atlas either:


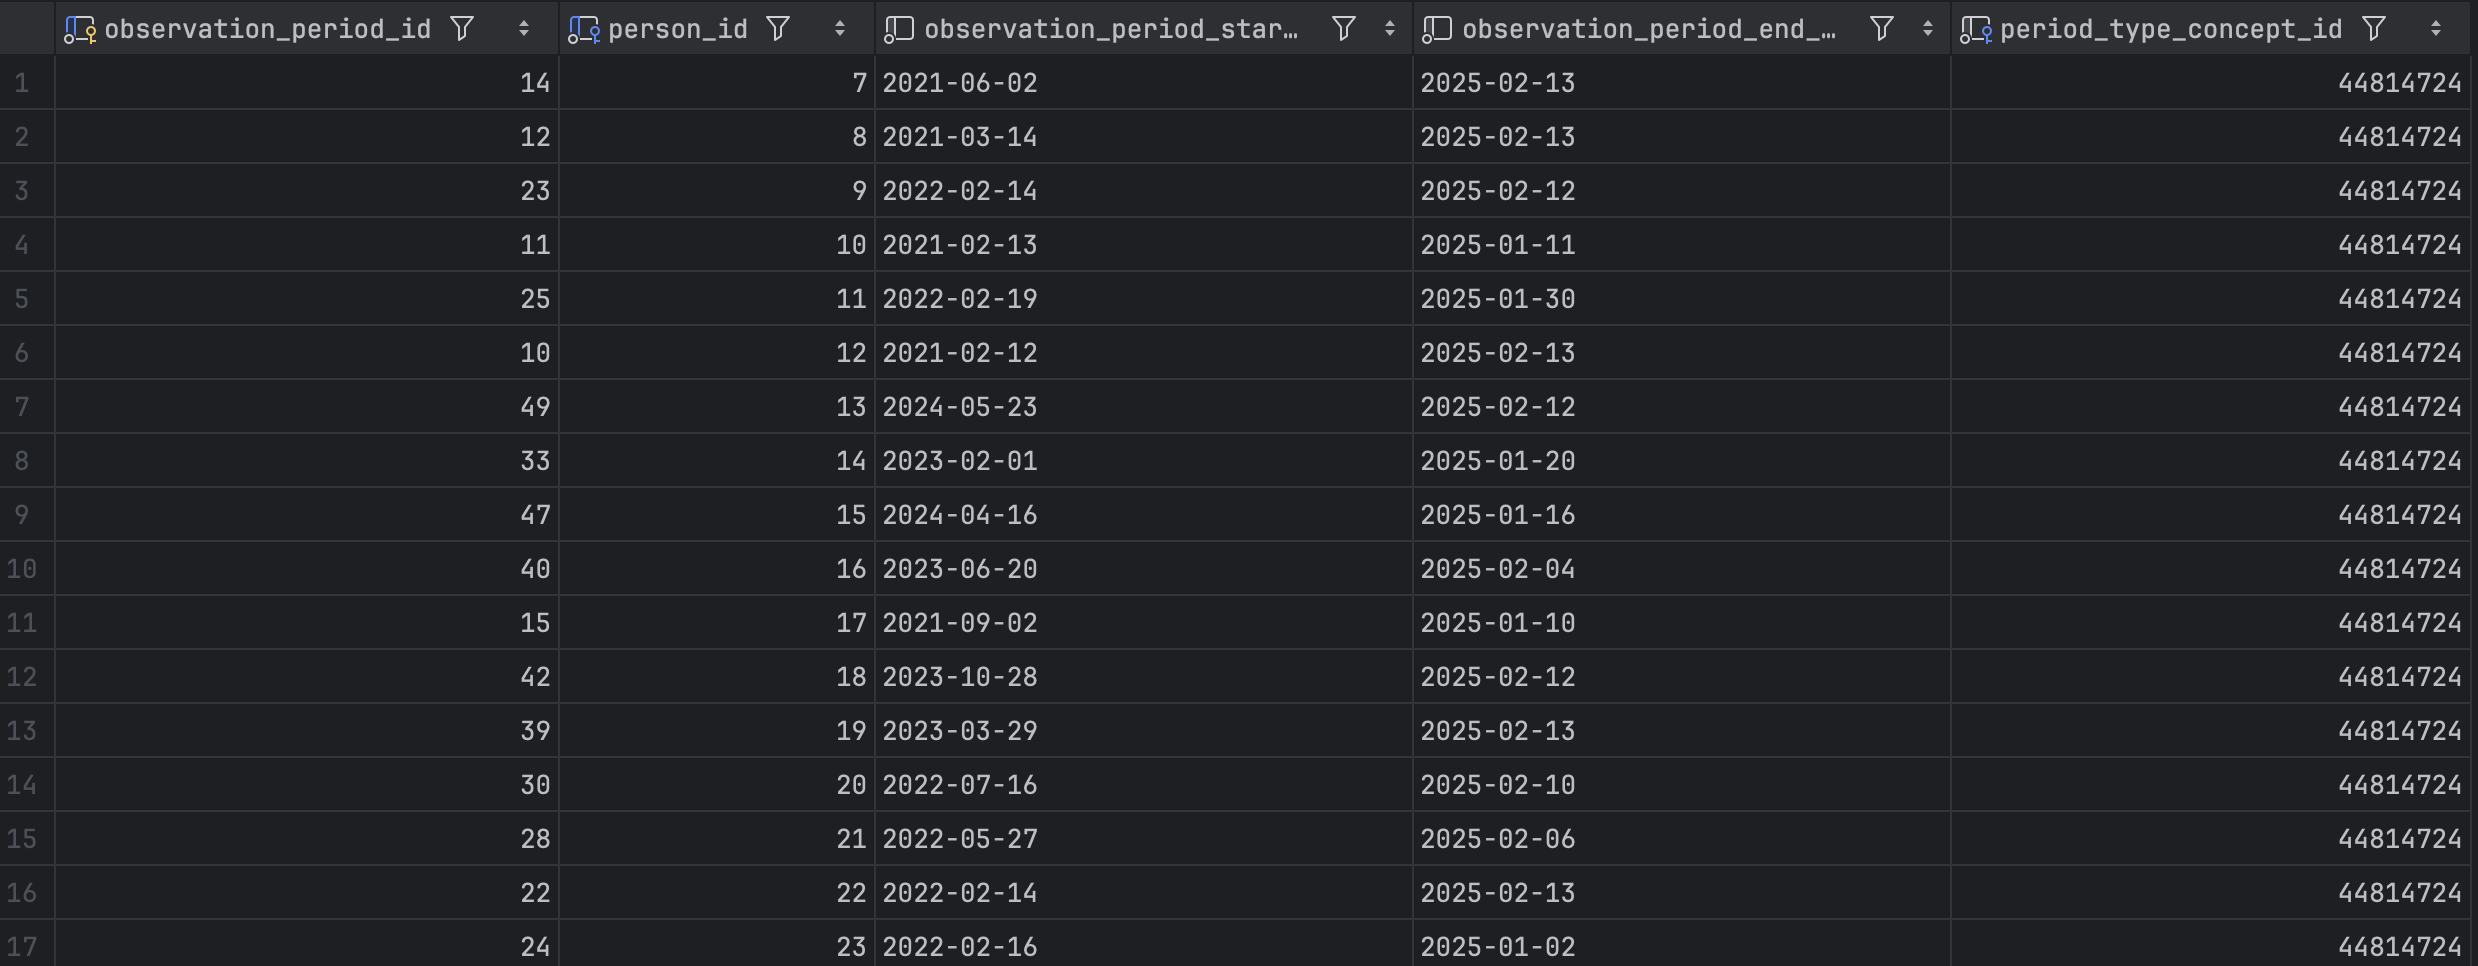
But running this query on the database shows that it exists:

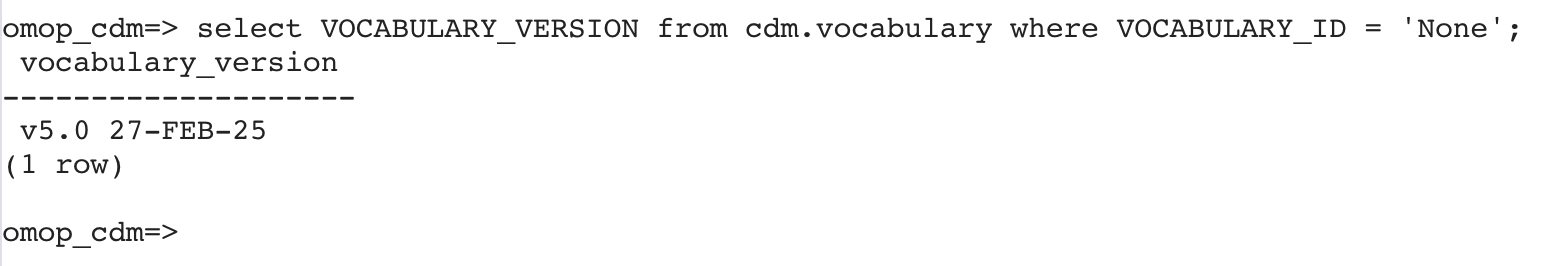
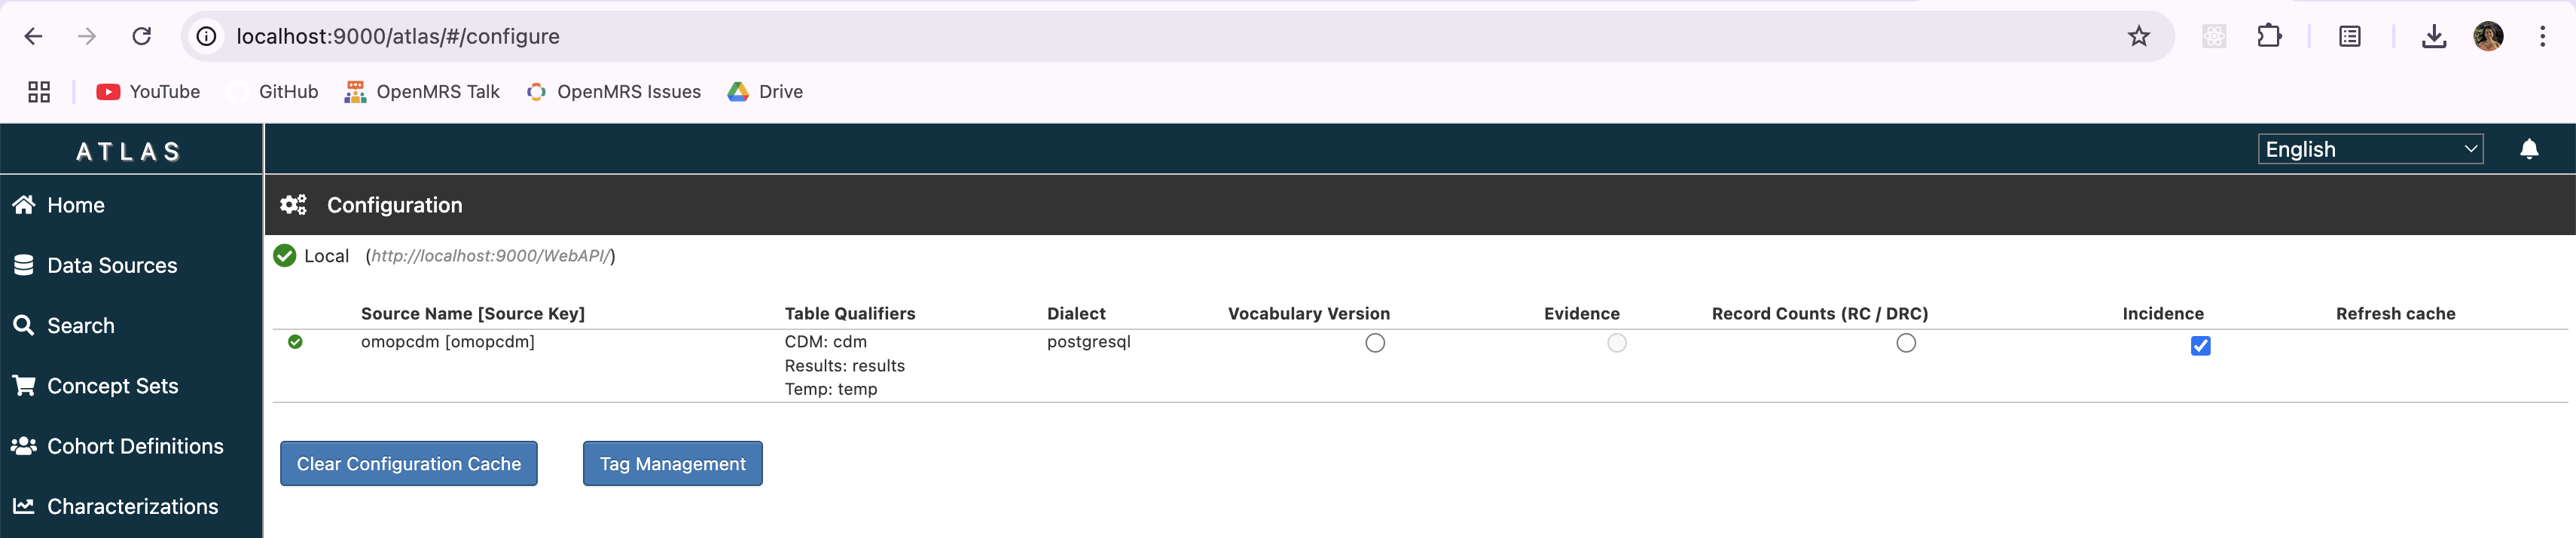
Atlas is configured to point to http://localhost:9000/WebAPI/. My tomcat is running on the port 9000, so I’ve updated my config-local.js in atlas to reflect that:

define([], function () {
	var configLocal = {};

	configLocal.api = {
		name: 'Local',
		url: 'http://localhost:9000/WebAPI/'
	};

	return configLocal;
});

I realize this may be a stupid question but, should I change the server.port in settings.xml in the WebAPI config too? A bit confused because without changing it http://localhost:9000/WebAPI/info gives me the expected output.

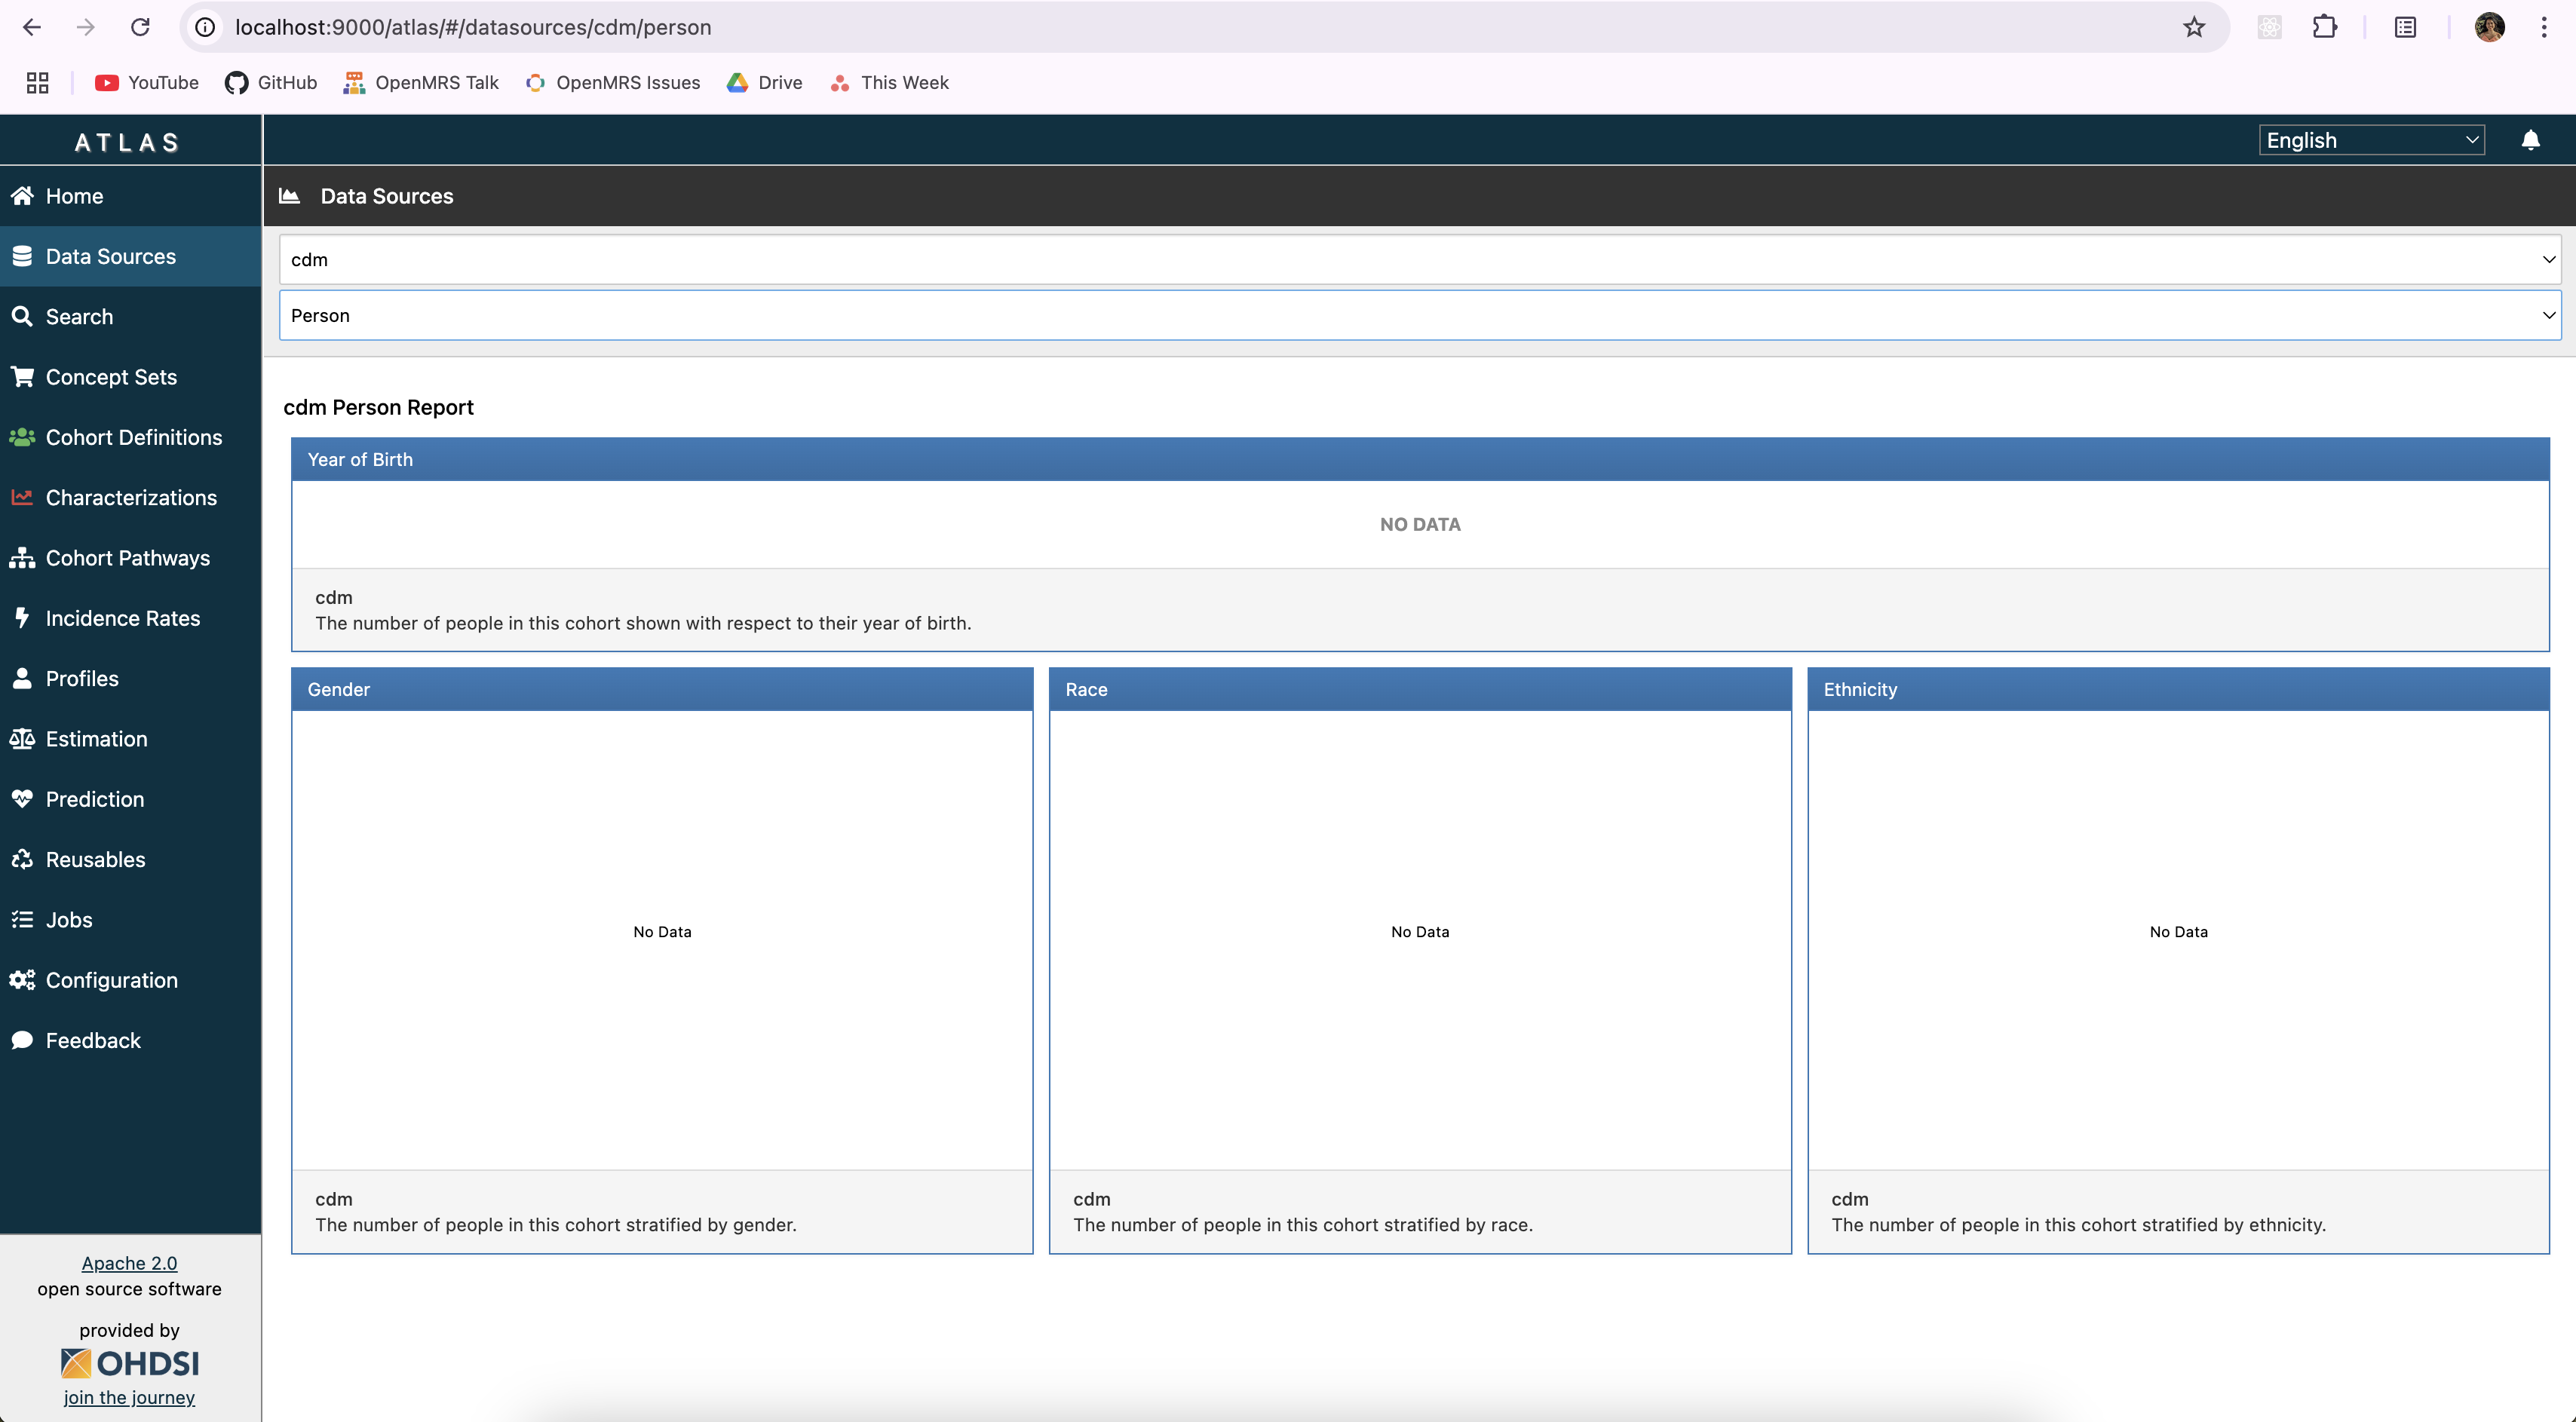
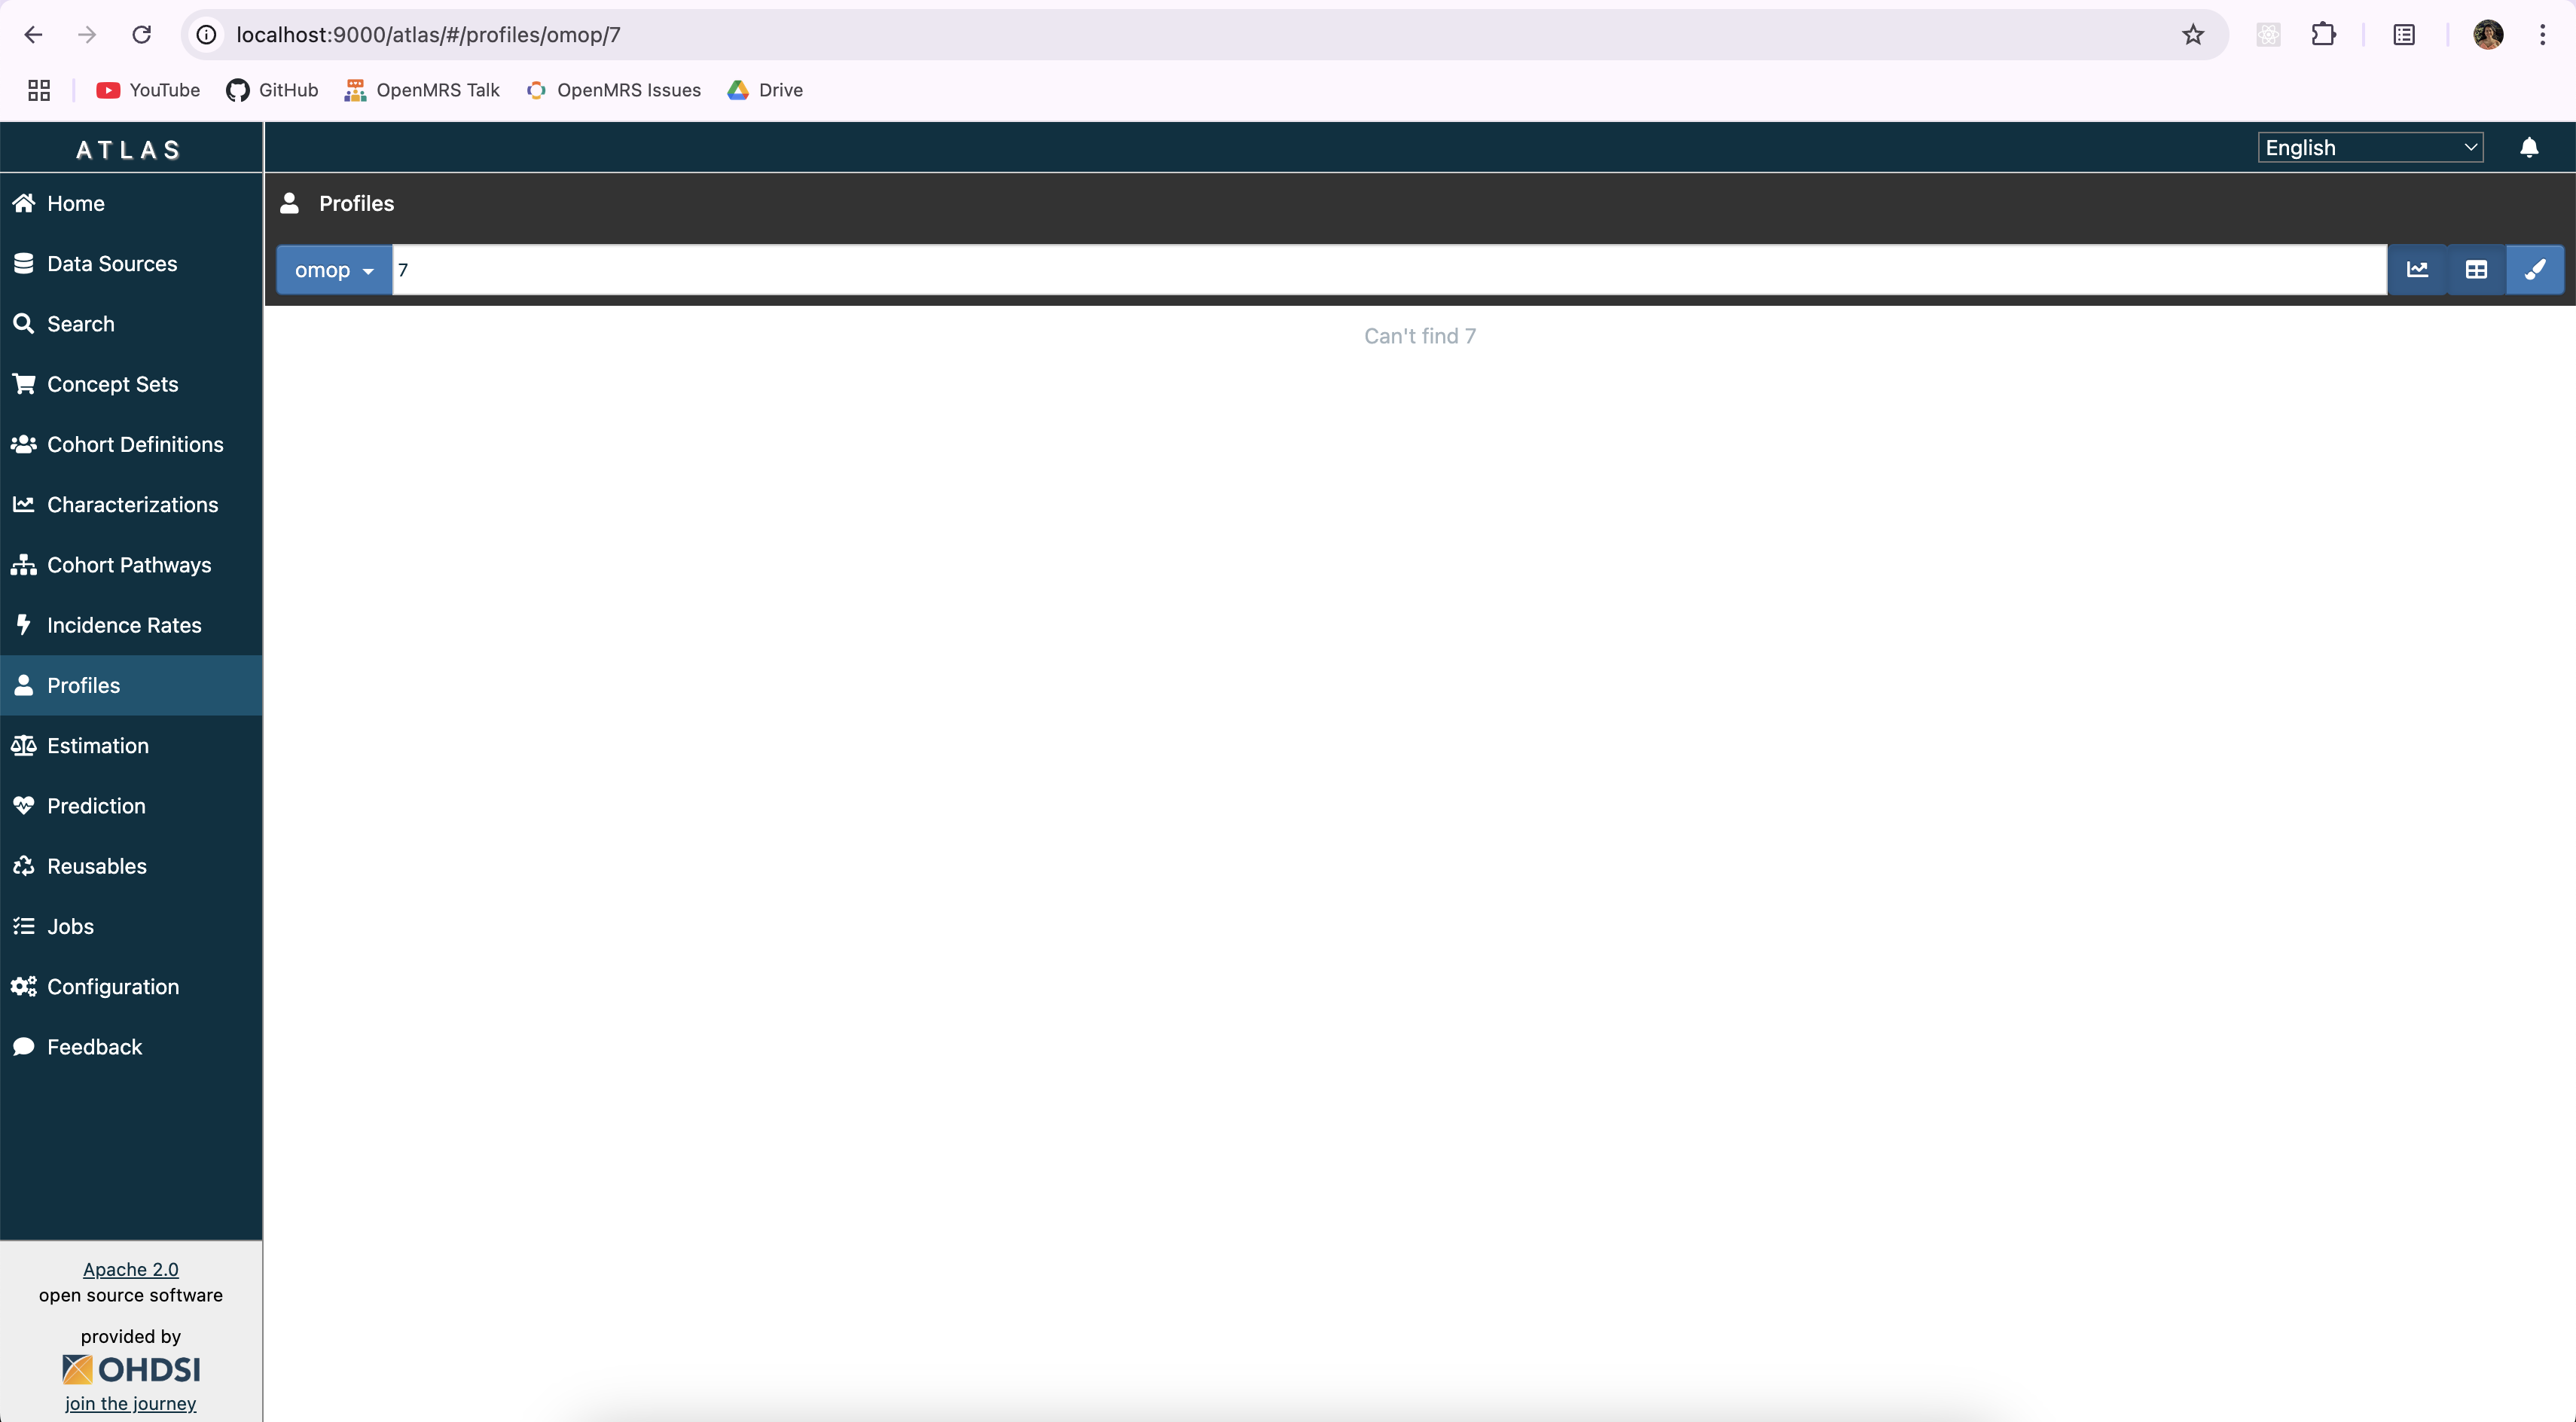
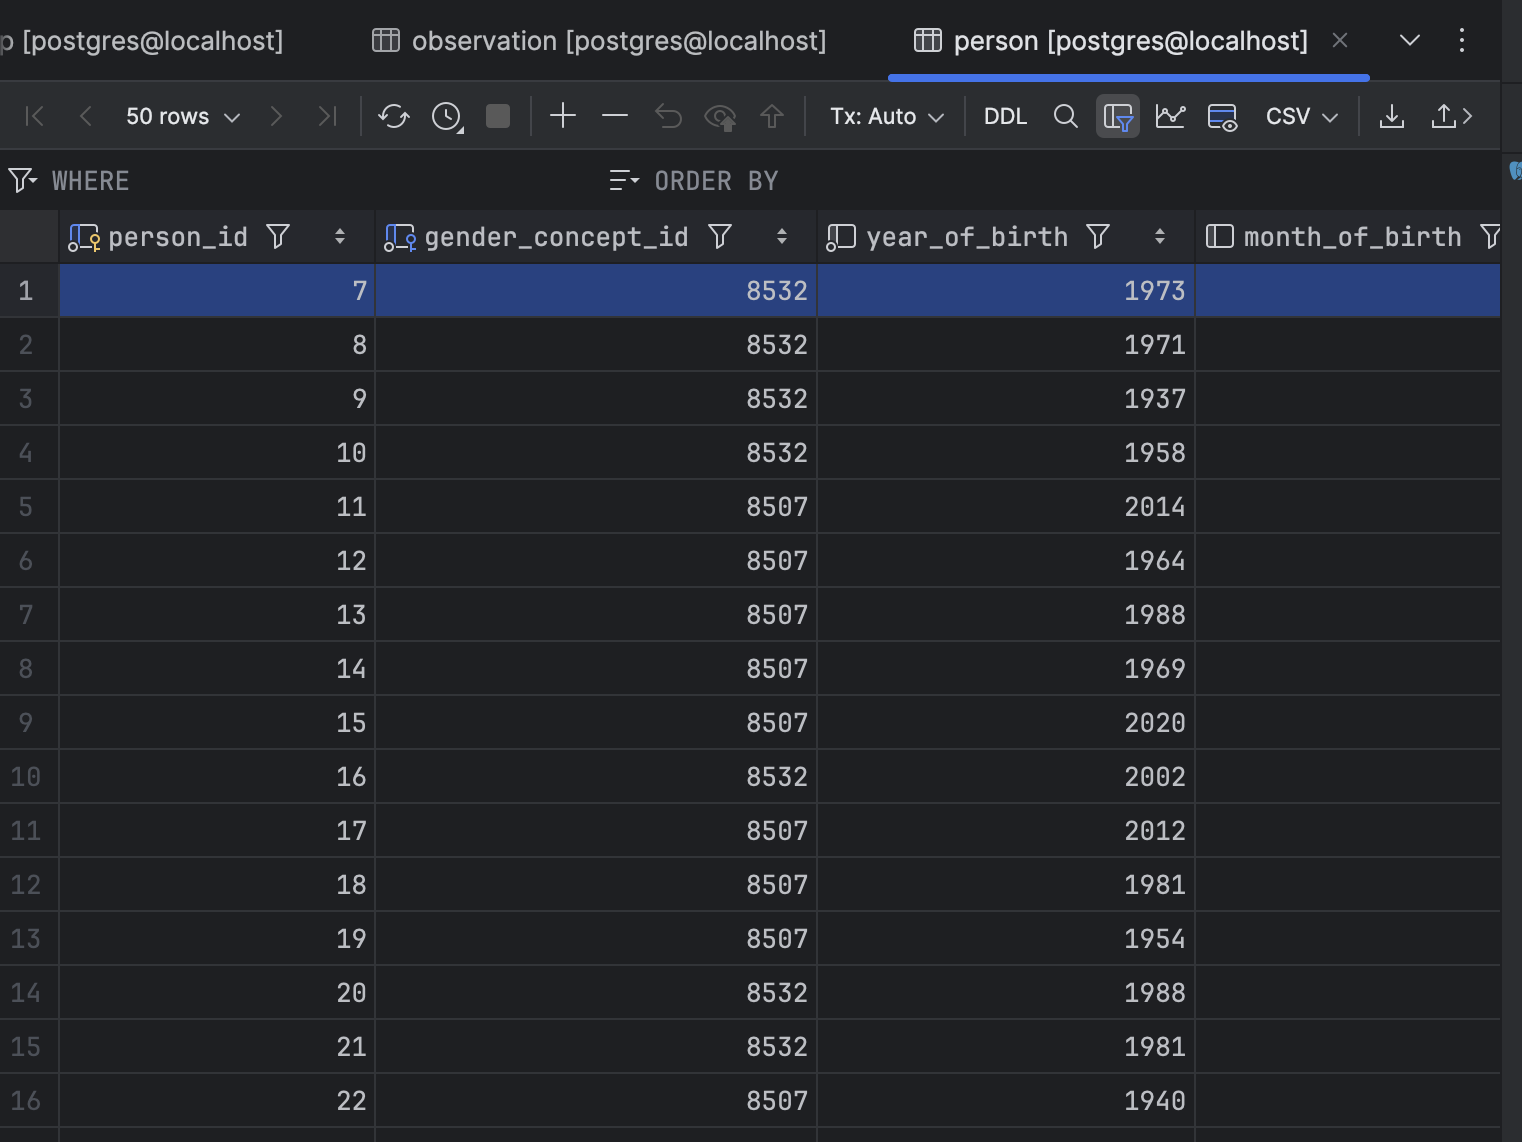
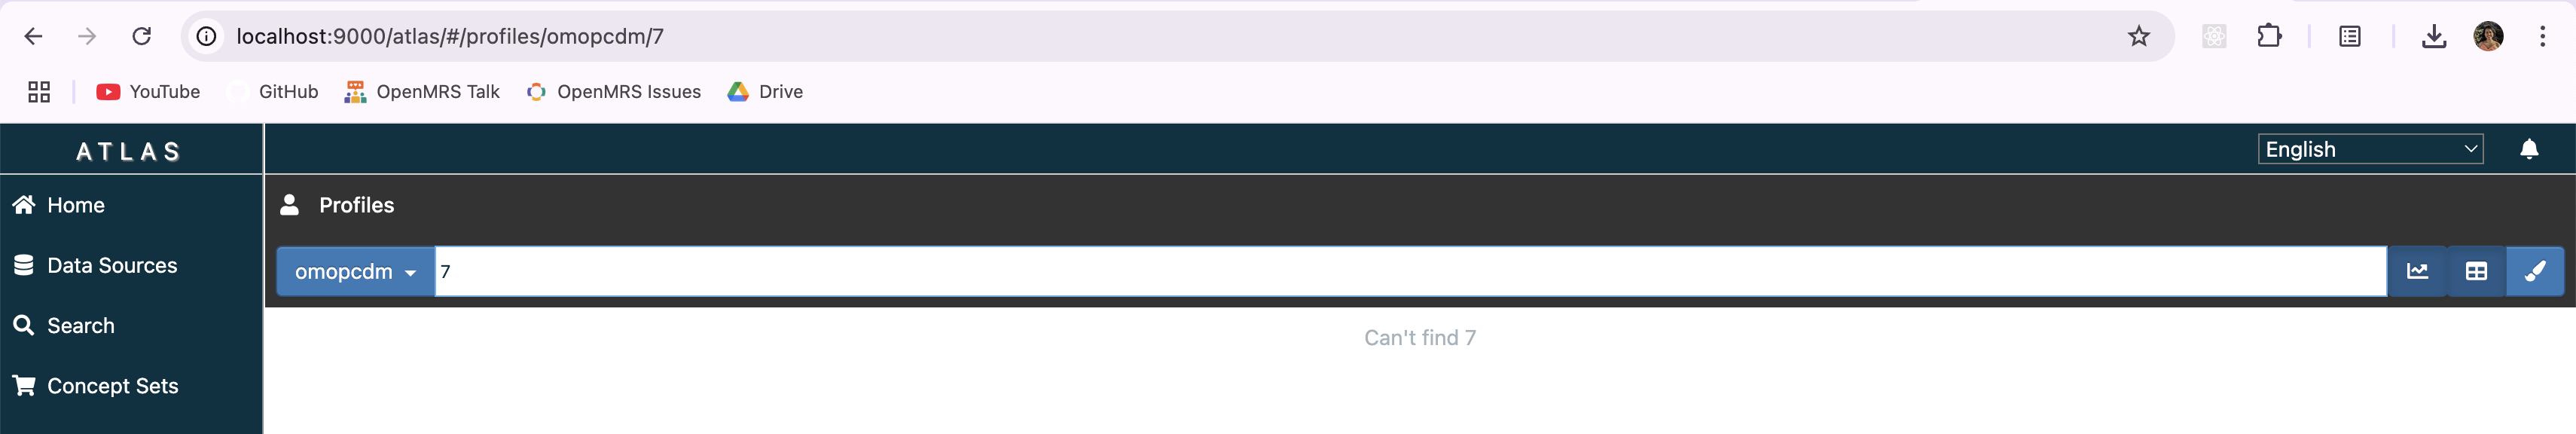
I can access Atlas on http://localhost:9000/atlas/#/home but when I search for a person on Atlas, I don’t see the person. One person exists in the database with person_id=7, but Atlas shows “No matching people found”

person_id gender_concept_id year_of_birth month_of_birth day_of_birth birth_datetime race_concept_id ethnicity_concept_id location_id provider_id care_site_id person_source_value gender_source_value gender_source_concept_id race_source_value race_source_concept_id ethnicity_source_value ethnicity_source_concept_id
7 8532 1969 4 23

But the person
cannot be found.

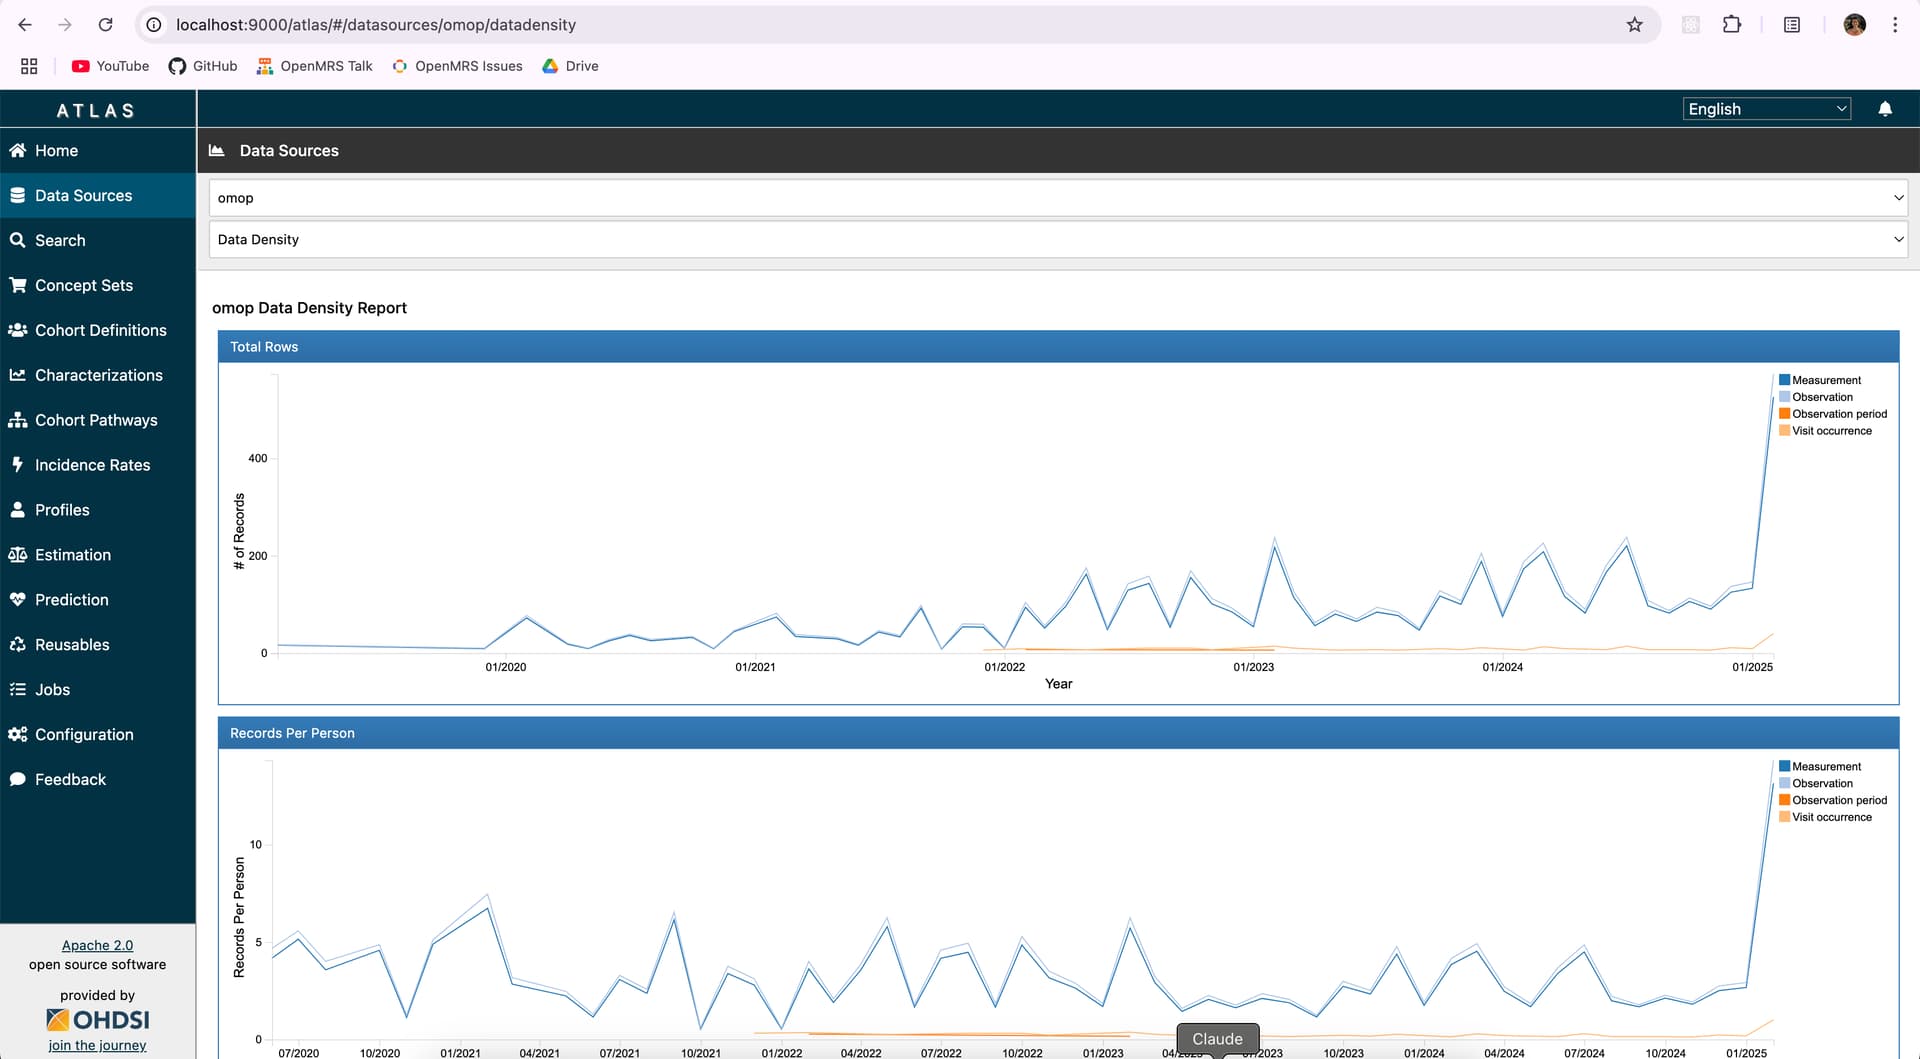
Since Atlas guidelines recommends characterizing data through Achilles, when I run achilles I only see the table achilles_analysis in the results schema, should I be seeing a achilles_results table too?
These are the commands I ran for achilles (I understand that these users were meant for only webapi, but since I’m just testing out locally I gave the ohdsi_admin_user access to the omop_cdm database as well):

  1. cd <- createConnectionDetails( dbms = "postgresql", server = "localhost/omop_cdm", user = "ohdsi_admin_user", password = "admin1", port = 5433, pathToDriver = "~/JDBCDrivers" # typically 5432 for Postgres )
  2. achilles(cd, cdmDatabaseSchema = "cdm", resultsDatabaseSchema = "results", sourceName = "omopcdm", createTable = TRUE, analysisIds = NULL, cdmVersion = "5.4")

I’m not sure why I’m getting an error with the vocabulary, or what I’m doing wrong.
Would greatly appreciate some help!

1 Like

Hey everyone,

I’ve since had some progress with this. I missed the part where I had to add the OpenSourceSubProtocolOverride to the source connection string and now it works.

Right now I have about 50 people in the person data. I’ve only populated the person, visit_occurence, and location (in addition to the concept, vocabulary, domain, relationship, drug_strength, concept_ancestor, concept_class, concept_relationship, concept_synonym). I have run achilles on my cdm database.

When I look at the dashboard, the chart is rendered correctly.


But when I look at person, it appears to be empty. Shouldn’t the number of people per gender be rendered? Am I missing something? Is there an extra step that I should do to get the visualizations that fall under the person option?

1 Like

Hi OHDSI community! For context on the reason we are asking these questions: This is related to the project described here:

Can you please let me know what version of Atlas and WebAPI you are running so we can give you more specific instructions.

1 Like

Hi, sorry about the delay, we’re on version 2.14.0 on the WebAPI and Atlas 2.14.1, the latest versions of both.

Forgive me if this is not the correct thread to ask for help on Achilles as well. We’ve made a bit of progress with converting data, so now we have person, location, measurement, observation, visit_occurence, note, but we Achilles now only makes three tables in the result schema achilles_analysis, achilles_results and achilles_results_dist, so now Profiles no longer work. We are on Achilles version 1.7.2. There doesn’t seem to be any errors in the logs, other than an error relating to the database connector pane, I’ve attached the logs as well, would be grateful if you could help us in figuring out why. Thank you!


log_achilles.txt (111.1 KB)
log_createIndices.txt (111.7 KB)
log_dropScratchTables.txt (43.5 KB)

I don’t see you listing observation_period table in that list. it’s the most important one in the CDM, and most statistics depend on it. Also, Achilles just creates those 3 tables, so that’s fine, and it’s not related to Profile.

It may be an error on the WebAPI side, so if you can access those logs and look for errors (please don’t attach an entire log to this thread) you might find something that indicates a problem, like permissions or something.

1 Like

I don’t see you listing observation_period table in that list. it’s the most important one in the CDM, and most statistics depend on it.

That was an err on my end, we do have observation_period.

Also, Achilles just creates those 3 tables, so that’s fine, and it’s not related to Profile. It may be an error on the WebAPI side, so if you can access those logs and look for errors (please don’t attach an entire log to this thread) you might find something that indicates a problem, like permissions or something.

Yeah I did look at the logs before and the reason I thought it was something to do with achilles is because whenever I try to search for the person id I see the error:

Caused by: org.postgresql.util.PSQLException: ERROR: relation "results.cohort" does not exist

Thanks Chris, as I was typing this I realized that the step in setting up the results schema, is not something optional. Its all working now.

1 Like

Thank you so much for your help @Chris_Knoll! We’ve now got demo data successfully displaying in Atlas. Our next step is to try and automate some of the pipeline so that OpenMRS community members (i.e., researchers using OpenMRS without our Support Team’s direct involvement) can set up their OpenMRS → Atlas pipeline easier.

1 Like

@Chris_Knoll could you please help us with another query.
I’m not seeing some of the charts in Observation Period Report.


This is the response from http://localhost:9000/WebAPI/cdmresults/cdm/observationPeriod - JSON Blob | 1370347286240092160
Are we missing a step to be able to generate these charts or could this be an error in our data? We do have all the columns filled in the observation_period table. We have only 50 rows in total in the observation_period table since we have only 50 records in the person table.

This is the record in the achilles_results table for analysis_id one, but I don’t see a record for the analysis_id 101 that is used in this query that I saw that the endpoint was running.

analysis_id stratum_1 stratum_2 stratum_3 stratum_4 stratum_5 count_value
1 50

And a question about measurements. Is the conceptPath made from the measurement concept’s ancestors? Could this be because of missing concept relationships or something else? If it is because of concept hierarchy, does this mean that a measurement concept needs to have a concept hierarchy that is the third child?