In my prototype for Vocabulary/Population Visualization I’ve been trying to use http://js.cytoscape.org/, which is a very amazing, open-source graph theory visualization library in many ways, but it only renders in Canvas, not SVG, which is great for performance in large graphs, and they’ve managed to give it impressive interactivity features despite the lack of distinct DOM elements for nodes and edges – still, it severely hampers the ability to extend interactive functionality and the high performance you get with Canvas isn’t necessary for the vocab use case.
It is likely that my prototype will need to be rewritten at some point to fit into ATLAS and other OHDSI toolsets, but that job will not be nearly so bad if the graph visualization library doesn’t have to be replaced.
Here are my requirements at the moment:
Not a force directed layout. Most D3 graph renderers use force directed layouts, but I need node placement to be stable and consistent.
Grid or manual layout instead. (I’ve already got an ok algorithm for placing nodes in rows and columns.)
Good edge bundling and routing. Actually, cytoscape.js is not working for me in this regard and I’m wondering whether I couldn’t do better with plain D3.
SVG rendering. I need to be able to zoom and drill on hover and click.
My guess is that if we have a decent graph library, developers may end up using it for things other than the vocab visualization. Does anyone have suggestions?
P.S. I had forgotten about http://sigmajs.org/. That might be a good alternative. Still eager for input if anyone has opinions.
P.P.S. Sigma.js doesn’t do SVG either.
P.P.P.S. Actually, maybe it does.
P.P.P.P.S. Here’s a list of graph-drawing libraries: We Love Graphs: JavaScript Graph Drawing Libraries
Sigfried: What content are you intending to plot with a graph/network
diagram, and who is the intended user/use case for interacting with the
visualization?
I’m also trying to understand the specific requirement to not use a force
directed layout. If you apply strong enough forces, you do get a stable
node placement.
I agree. You cannot control the topology, and that makes navigation impossible over time. People are good at learning hte topology. They know that Boston is “on top” of New York, and tht is “on top” of Philadelphia. If they have to figure that out each time they look at a map it would be detrimental.
@Patrick_Ryan, you’re right about stable placement with the right forces, but @Christian_Reich’s argument against force-directed layout is what I had in mind: not just that the layout be stable but that it be controlled and meaningful.
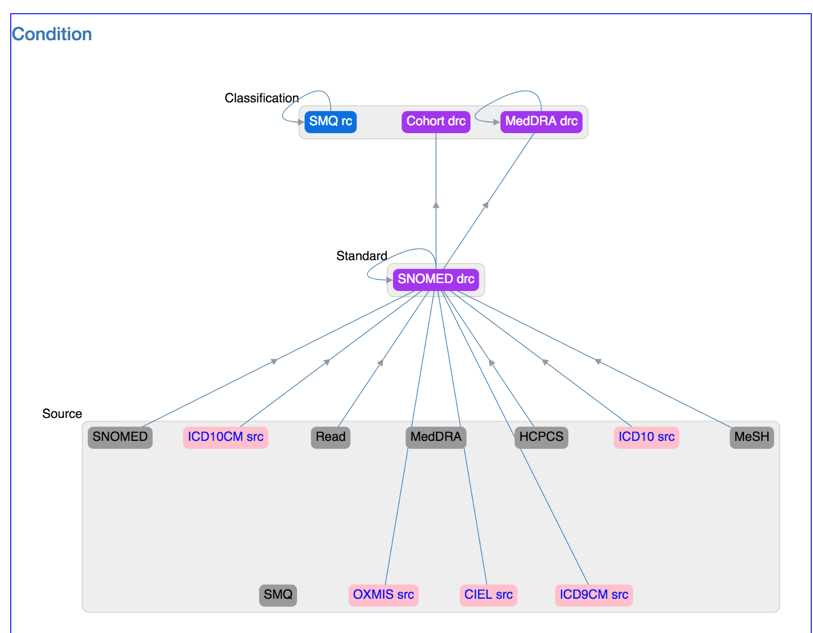
Thanks for asking. I should have said more about what I’m doing. Here’s what the “vocab-map” for one domain looks like at the moment:
So, the set of use cases and intended users is extremely broad at the moment, but, to some degree (no pun intended), any view of the vocabularies should be expressible as an acyclic directed graph and some of the features of a graph-drawing library will be appropriate. Whether we’re looking at a high-level overview, like the picture above, or exploring links and attributes of individual concepts or small concept sets, I think users will benefit from the spacial flexibility, information density, and interaction capabilities of a graph representation – as long as the layout is stable, meaningful, and not crowded with irrelevant information.