I currently have an instance of the WebAPI and Atlas running inside of a Broadsea Webtools Docker container. We are authenticating users with Atlas/WebAPI’s Basic Security Configuration.
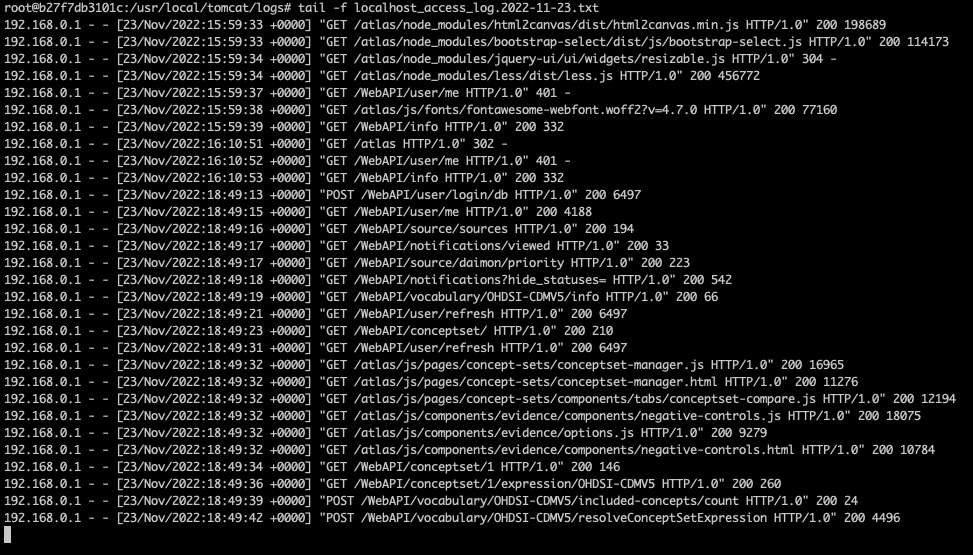
All is well and working, but we have a new security requirement that we need to be able to see WHO requested WHAT endpoint on WHICH date. I was hoping to just piggy-back off the Tomcat Access Logs in order to get this information. I’m able to exec into my docker container with docker exec -it <docker-container-name> bash and navigate to /usr/local/tomcat/logs and I see the following files:
However, I’m noticing that even though we are using the common tomcat access log pattern of %h %l %u %t "%r" %s %b, the authenticated user is not being passed into the %u placeholder like it should. Therefore, we’re unable to see who requested each endpoint.
Is this something that is missing because of my usage of the Basic Security Configuration of SHIRO, but would potentially be fixed if I authenticated in a more production-level way (i.e. SAML or AD)? I also have security.ssl.enabled=false in the environment section of my docker-compose.yml because we’re using a proxy server in front of the Atlas container, and thus Atlas doesn’t need to worry about SSL. If I enable SSL behind the proxy, it will not work since Atlas will try to enforce an encrypted connection between the proxy and the Atlas container, but the proxy is proxying the request without encryption and thus the handshaking will fail. However, is this part of the problem as to why the %u is not being filled with the authenticated user?
Any information at all about my options here would be so appreciated.
Setting the first to true will log the timestamp, user, ip address, url, and other descriptive data in the audit.log above. You can test after a reboot with a simple authentication and search. It’s not the tomcat log of course but it seems to serve the purpose.
If using Broadsea, set the following in the docker-compose environment file:
audit_trail_enabled=true
and setup the /tmp/atlas/audit folder as a host mounted volume in docker-compose.yml to persist the logs, e.g.,:
@Dillo this is extremely helpful! Thank you for coming back and updating me on this post. Coincidentally, we are a few versions back (running 2.8.2 since it was the last version to work with an Oracle DB out of the box) and it looks like the audit_trail_enabled property in the pom.xml wasn’t introduced until 2.10. That’s why I never came across it!
Either way, thank you so much for this info. I’m going to see if we can update a few versions (we need to transpose some of the migrations to play nice with Oracle) and test out this audit trail feature.
If you don’t mind me asking, how did you stumble across this? I couldn’t find any documentation from the OHDSI team anywhere.
@Chris_Knoll I totally agree that diving deep into the release notes would have helped me find this. I think because it was on a release I had yet to hit, I wasn’t as in tune with the notes of that version. I have since checked out the release notes and the associated ticket and am very excited this exists. Thanks for you pointing me in the right direction!
No worries, and it’s not your fault on anything, even after all these releases we’re still trying to find the most effective way to showcase these new features.
Glad it helped! I found it because I had already downloaded the latest WebAPI build into IntelliJ because I had been searching through code to understand how various things worked–then I think I searched for ‘audit’ in the code to see what popped up. It hadn’t occur to me to check release notes.