Hi,
Find attached incident report screen result. Can any one please explain in details each items in the screen.
In the report case count always shows 0 why? what is proportion, time at risk , rate.
thanks in advance
regards
Chidam
| OHDSI Home | Forums | Wiki | Github |
Hi,
Find attached incident report screen result. Can any one please explain in details each items in the screen.
In the report case count always shows 0 why? what is proportion, time at risk , rate.
thanks in advance
regards
Chidam
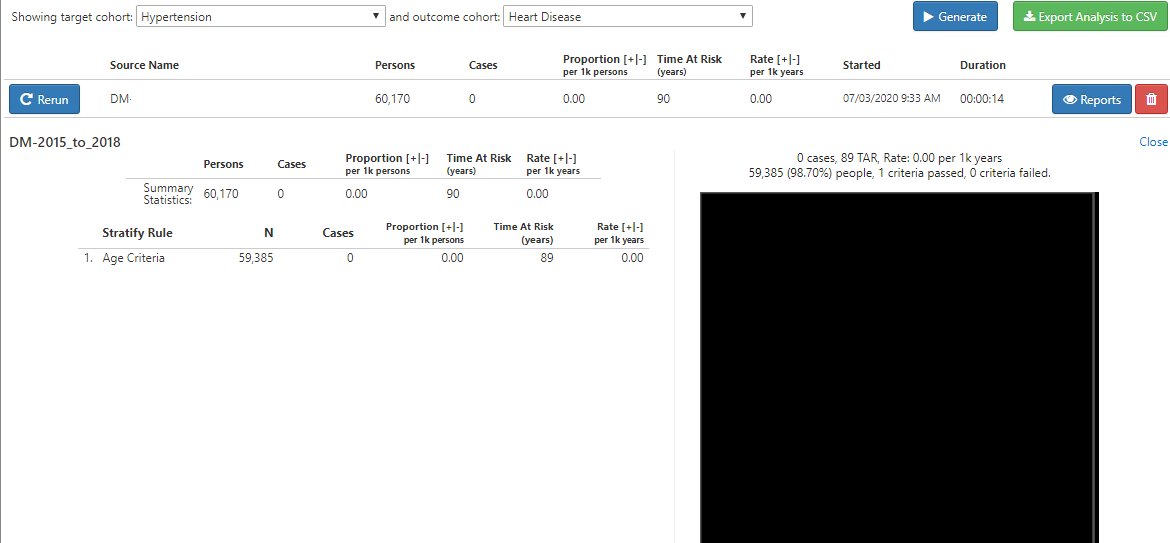
In your Hypertension cohort, you have 60,170 people. Zero (0) of those people had an outcome of Heart Disease in the specified time at risk. The total time at risk (from the 60,170 people starting at their time at risk start, up to their time at risk end) was 90 years.
Incidence proportion = cases / people = 0 / 60,170 = 0 cases per person
Incidence rate = cases / time at risk = 0 / 90 = 0 cases per year.
Your IR analysis includes a sub group: ‘Age Criteria’. There are 59,385 people in that sub-group, but you still have 0 cases, so your IR and IP will be 0, but notice Time at risk is now 89 years.
Something seems odd the way you’ve defined your time at risk: 60k people only contributed 90 years (~33k days) of follow up? And considering the follow-up is so short, it may explain why you found no cases.
90 years for 60k people? That like half a day per person. How did you define time at risk, @Chidam?
Thanks Chris,
Thanks for your explanation.
regards
Chidam
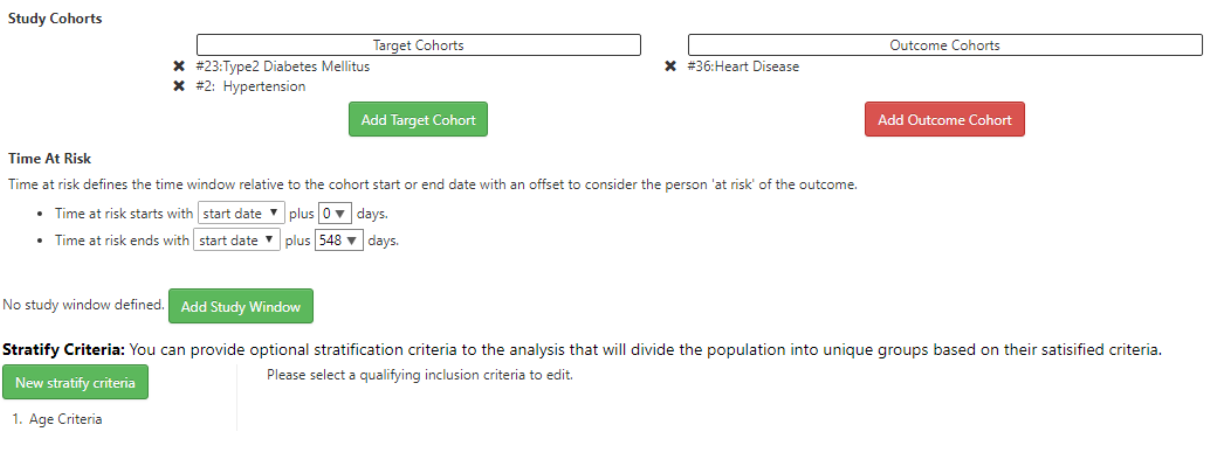
Ok, you have specified the TAR ends 548 days after the cohort start date. Other thing to consider is that the Observation Period end date will stop follow up of these people. That may explain why you don’t have hardly any follow up time for the 60k people in your cohort.