Hi all,
I just bumped into this topic and think I can contrubute some thoughts and graphs to the discussion. Hope you can use some of it.
I like the idea of generation a new growth chart from data. But it will be very important to pick the right database for it. Unfortunately in our own IPCI database (GP database) this can not be done. It will be heavily biased. You need to have a database where these things are recorded for all children in the population and not biased by any medical reason for a visit.In the Netherlands we should have such a registration because for the first 4 years after birth (almost) everyone goes to a specialized doctor because of national protocol. And here they monitor these things. Don’t know the English term but in dutch it is called the “consultatie buro”.
Bailey asks for profiling pictures for bloodpressure. Since Achilles does not support measurments (yet…) I have some graphs from our IPCI framework.
I’m currently working on a “cohort profiler” where we can compare characteristics of all of our codes for defined cohorts. I demonstrated a early version of this to Patrick some months ago. It has a lot of different overviews and graphs, I just picked two interesting ones for this topic. I just took two “cohorts”: male and females.
Here is a graph showing the patients age when registering the first systolic blood pressure (male in blue and females in red). Resolution and counts per month.
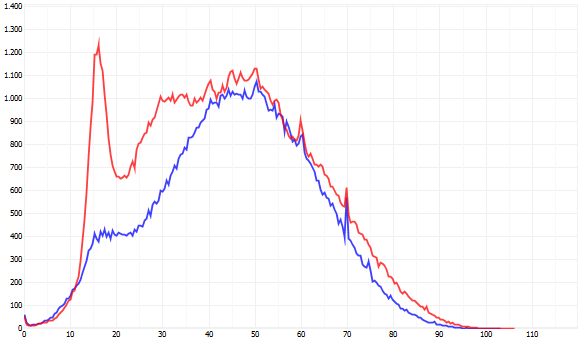
It clearly shows a huge peak around the age of 16. The reason for this is that it is part of the protocol when prescribing OAC for the first time. Most females start using this around this age. This reason for encounter is a pretty specif one because most of these patients are not there because of a medical reason in this case. The effect will be that the average in this age group will have a lot of “normal” values.
Other peaks at the ages of 60 and 70 because of protocols.
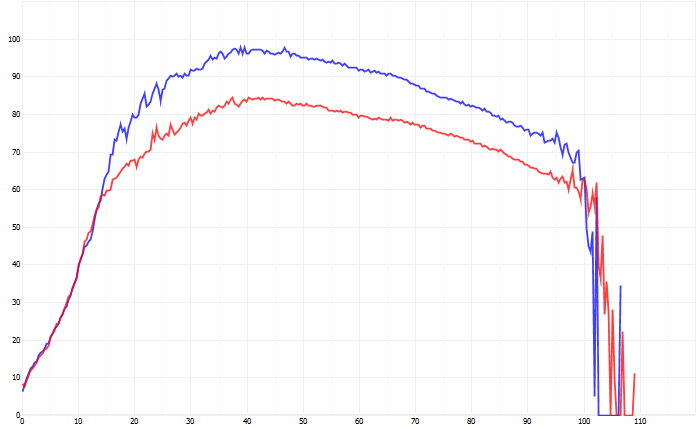
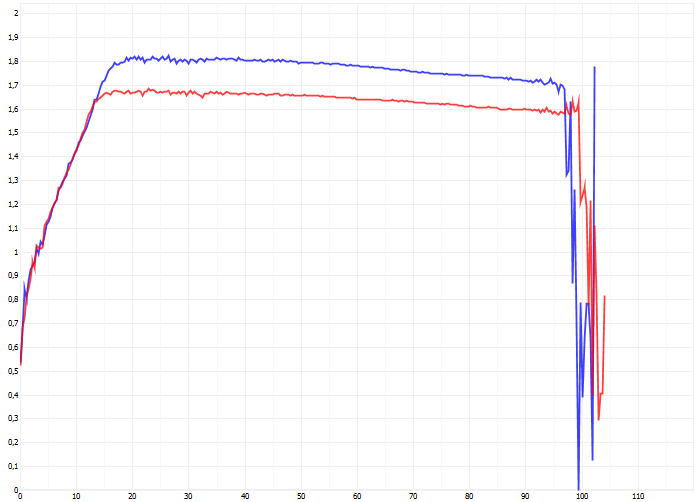
The next graph show the average bloodpressure by age of all measurements. Peaks at the extreme ages are caused by low number of patients.
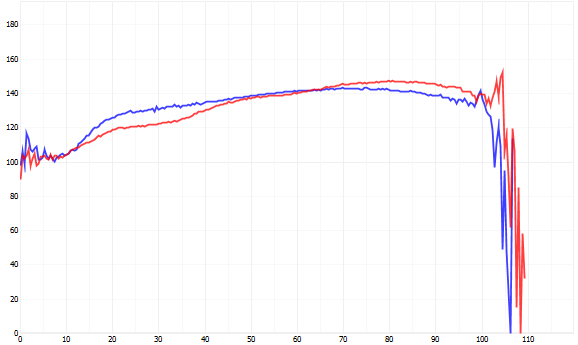
And indeed: when we compare the SBP between males and females, we see a drop from this age and further. I’m not a cardiologist, but probably caused by the effect described above. So, for the females around the age of 16-20 the average value of the SBP would be much closer to the “average SBP of the total population”. But in the other agegroups the result will be more and more biased.
Similar things will happen to weight, length and BMI.
This little example shows the bias effect in our IPCI database. I hope this can contribute to your discussions.
I hope someone in the community has the right database to do this. And of course this is country depended since the Dutch population is the tallest around on this planet. 
Greetings from the Netherlands,
Marcel de Wilde
