For a several new data quality analyses, I would like to see more example of data density plots for various datasets in the network. If you a willing to share your example in this forum or by email to me, I would be very grateful.
The problem I am referring to is that in a data set, there may be visit data that slowly start at some date, and only later a much more data rows appear.
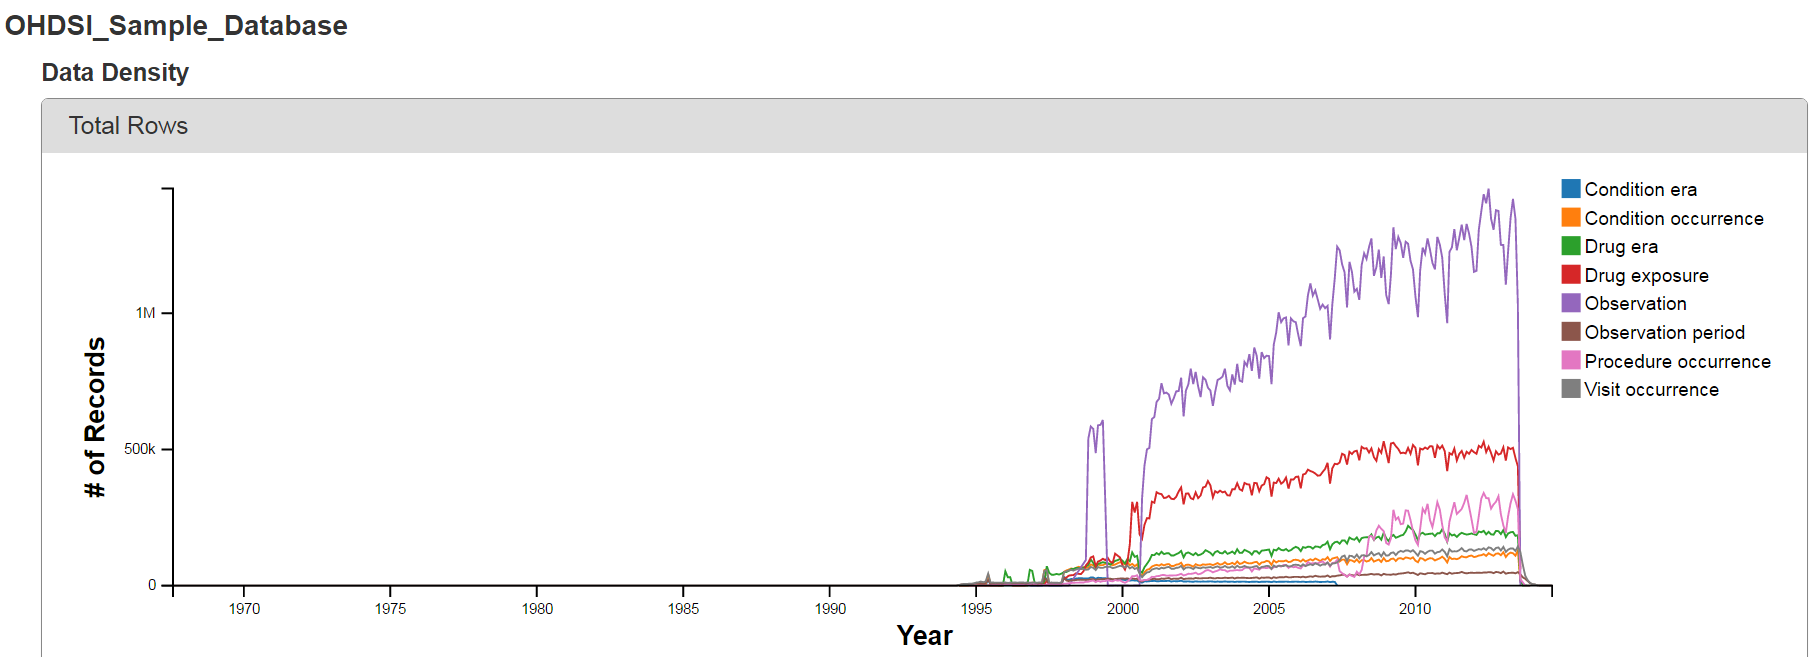
Data density plot in Achilles Heel (get to it like this)
(for a sample database) may show this pattern A:
So if I do min(visit_date) - it may look like the data start in 1920 (and this may be a typo error). For this reason, excluding years (or months) that contain less than 0.01% of all data for computing “when my data “kind-of” start” makes a lot of sense.
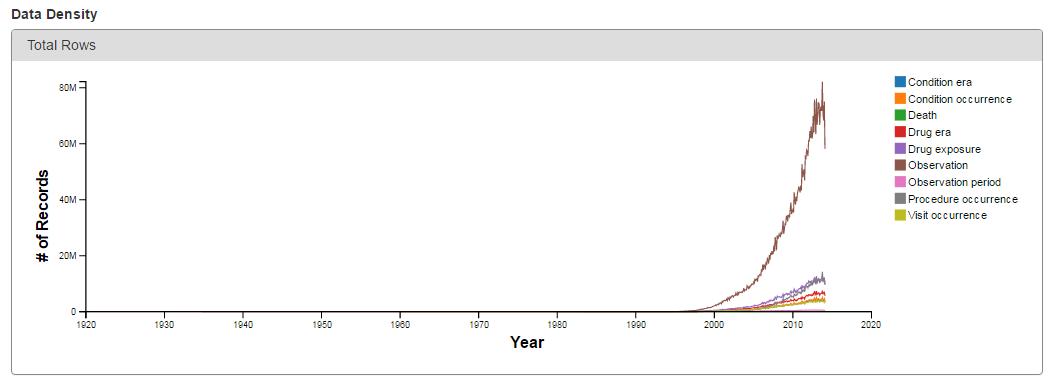
A nicer data set - may look like this (pattern B)
But even here - observation data show a big boost in year 2009.
My suggestion for computing ‘dataset era’ start date would be to take visit_occurrence table and take min and max month there (while excluding outlier <0.01% months).
Of course observation_period is another candidate but some EHR-ish sites differ from health-plan sites on how periods are being constructed.
Again, I would be very interested in other site’s data density plots and what people would like to use as “data start date”. (e.g., for purposes of your data set wiki page)
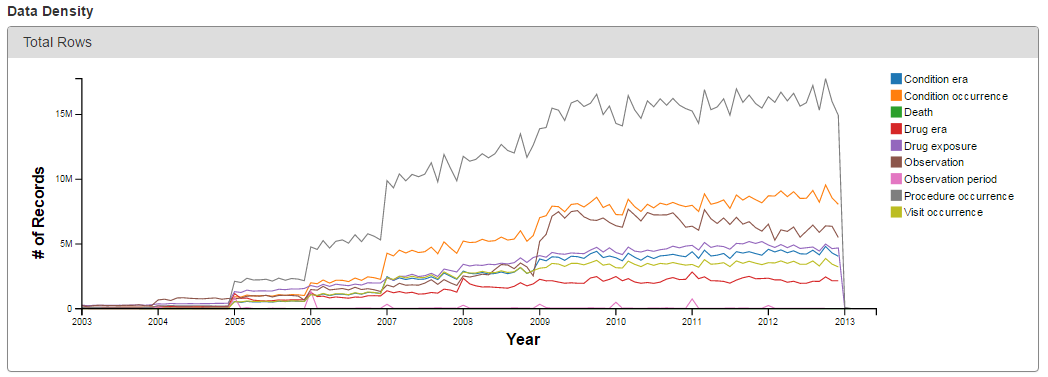
EDIT: One more example (C)