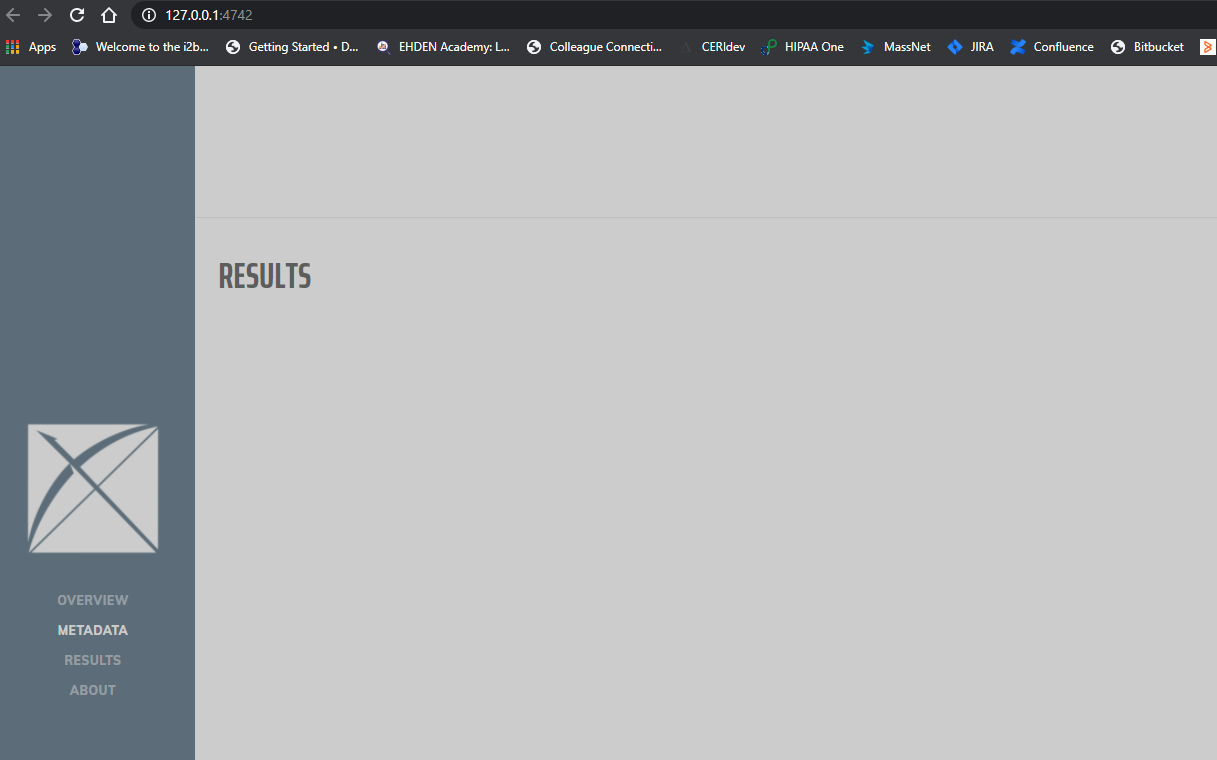
After successfully running the Data Quality Dashboard tool and obtaining a JSON result file, I am unable to view the overview, metadata or results sections within the web browser.
Following the provided instructions, I have at least one entry in the CDM_SOURCE table, I have installed http-server via npm, the JSON has been renamed to “results.json” and placed in inst/shinyApps/www. However, running http-server or the viewDqDashboard command in R both launch a webpage that doesn’t display results (please see attached).
I suggest you print the value for
jsonPath = file.path(getwd(), outputFolder, cdmSourceName, outputFile, cdmSourceName))
And confirm that is where the JSON file resides
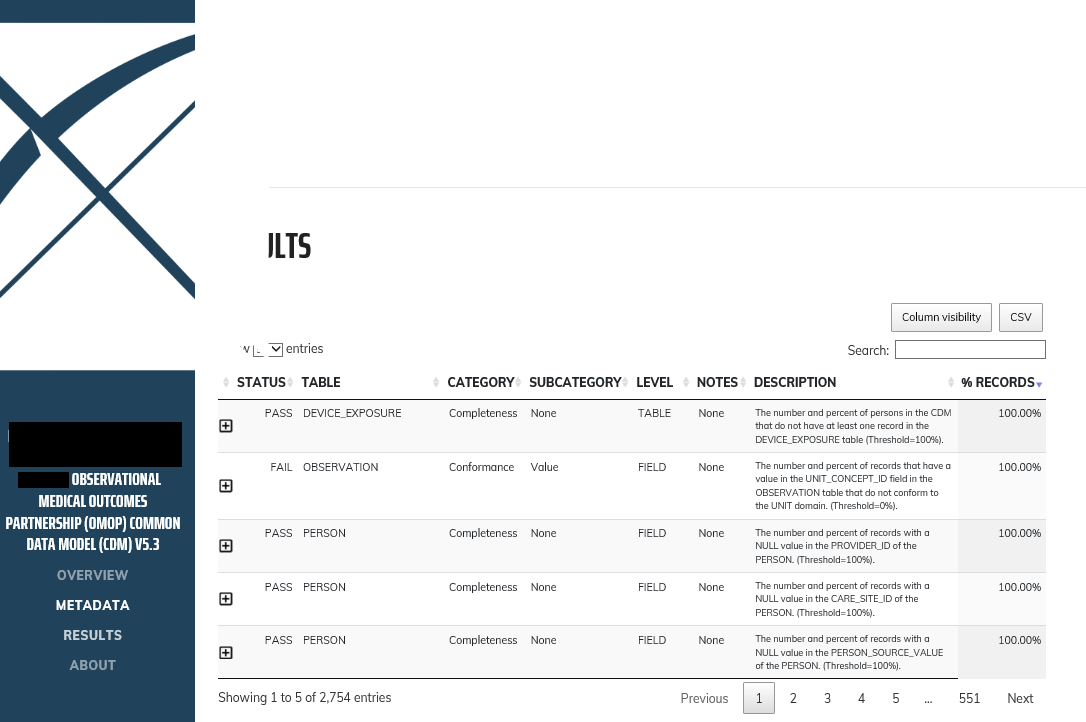
Thank you for the suggestion, you are correct that the file path needed to change. I’ve provided the correct path, and I’m now able to see data in the Results section of the webpage. However, the Overview and Metadata sections are still blank.
By the way, the problem I had was that putting DQD on a port different than 80 did not found the correct file in my server (there is an explicit condition to search for the results.json only if it has no port, it is port 80 or 8080)
Hi, Eddy, I am facing the same issue , but after I tring the way Don recommened, jsonPath = file.path(getwd(), outputFolder, cdmSourceName, outputFile, cdmSourceName)), my print( json Path)shows like, “C:/Users/xx/DQD/output/CDM_SOURCE/results.json/CDM_SOURCE” . actually my json file only located in C:\Users\xx\DQD\output\ic3 test-20230527011032.json’, I am confused how to change the file path.
I believe the folder/file naming convention has changed since that suggestion was made. I would try this instead:
However, since your json file name has a datetime appended, it looks like you’re using the auto-generated filename and not specifying outputFolder, in which case the above won’t work for you either. I might try just pasting in the whole filepath for your output file to the jsonPath param of viewDqDashboard to make sure that works.
For context, here is how the filename is autogenerated by DQD:
Thank you, Katy,
after running the viewDqDashboard() function, the DQD still not displaying results(show blank ) although I have generated the’ ic3 test-20230527011032.json. file’, and it has contents in it (8565 kb). I will try reinstall the R/R studio to the latest version since it returns’ Warning message:
R graphics engine version 16 is not supported by this version of RStudio. The Plots tab will be disabled until a newer version of RStudio is installed.’ after checking the R version. at least it would be a solution. what do you think if there are other possible ways to solve this problem?
I haven’t seen that error before so I agree with trying to update RStudio. I’d also recommend updating to R version 4+ if possible, and updating DataQualityDashboard to the latest version.
Are you getting any errors other than that RStudio version warning when you run viewDqDashboard?
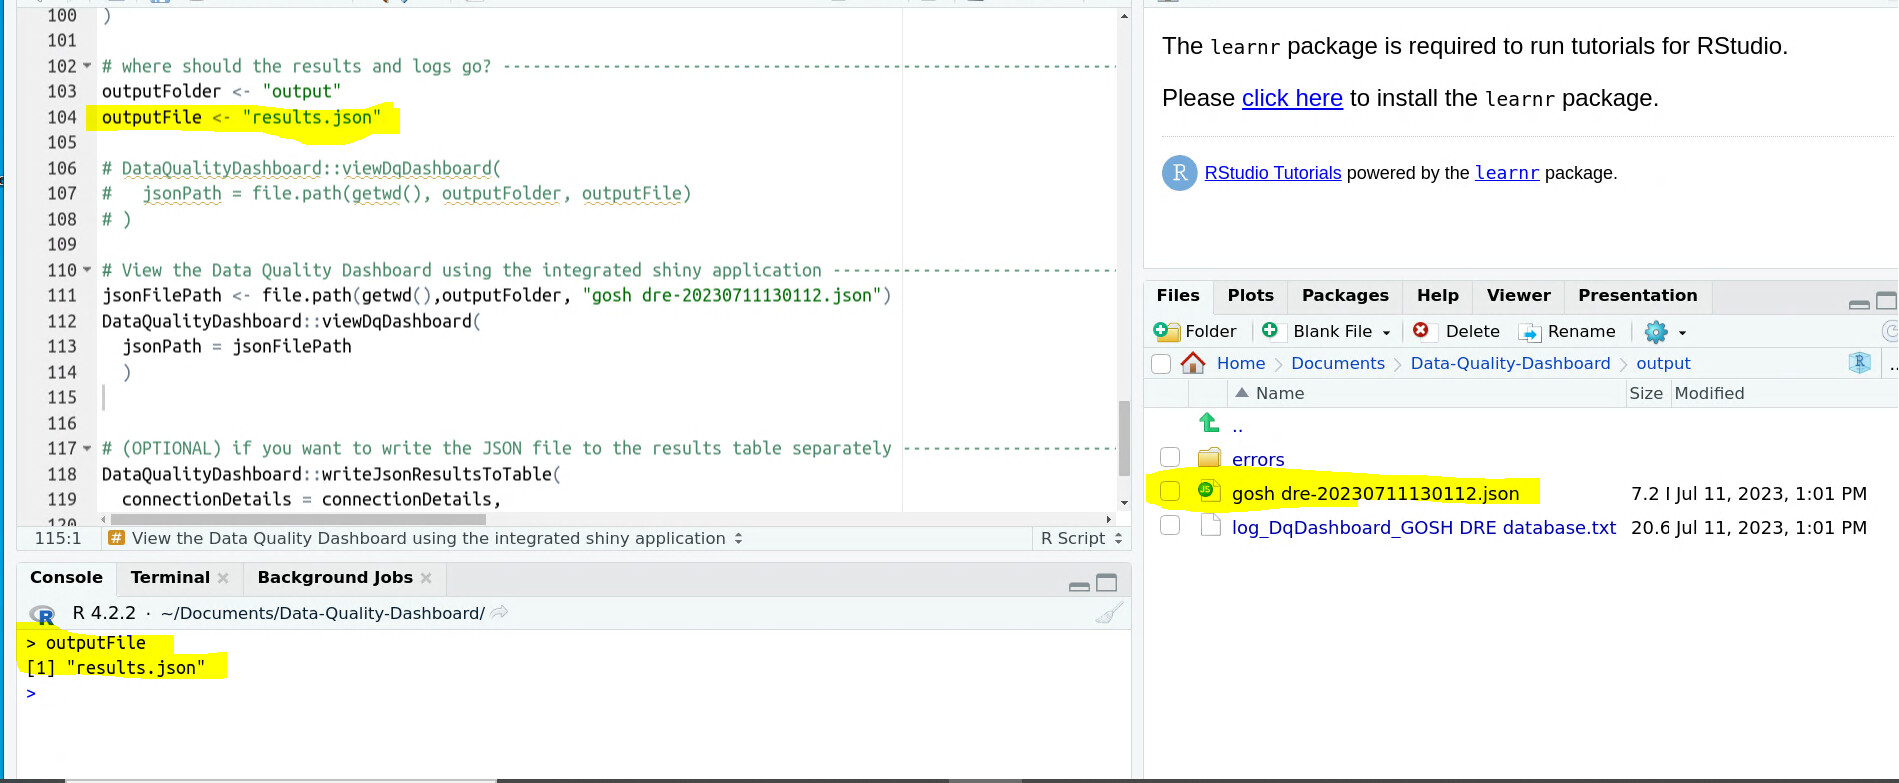
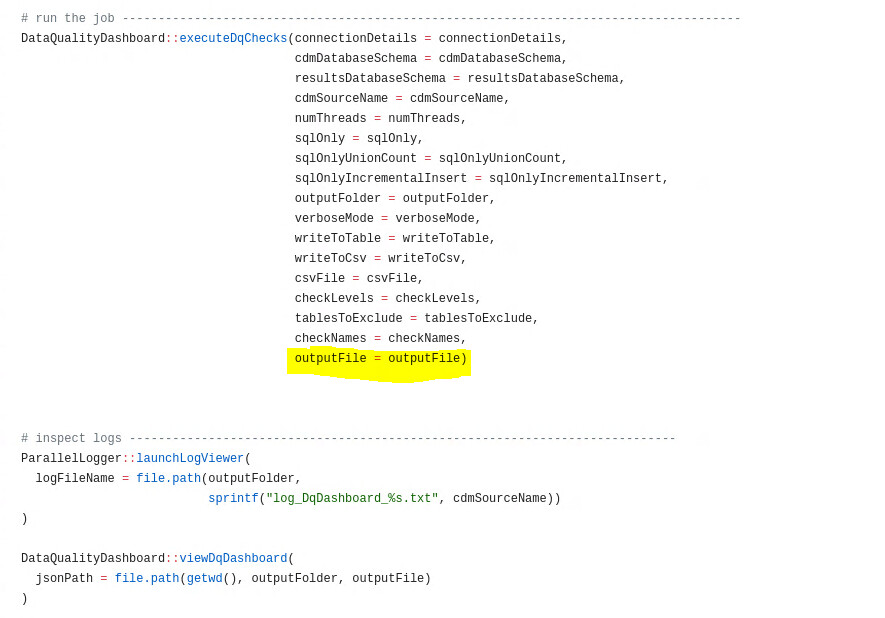
I have included a screenshot of the current logic created to get the DQD dashboard running. Not to sure why the outputFile as we have defined it is being replaced by the autogenerated one?
Hi there, thanks for raising this issue. I think the issue is that the outputFile param is not included in the executeDqChecks call in the sample “getting started” code. I will fix this in an upcoming release.
In the meantime, you can just add the param outputFile = outputFile to executeDqChecks in your script and then your results file should have the correct name.