i have completed the math for the case when PPV<100% and for the case when both PPV<100% and sensitivity<100%. find at the bottom of this post the detailed proof of the general case (which contains the case sensitivity 100% as a special case). a summary follows
===========================
-) case when PPV<100%,
if the number n of observed cases among exposed is doubled, but some of them were not true cases in the first place, we more-than-double the true cases, hence the true risk in the exposed is inflated more than expected. in formuals: let’s call v the PPV of the outcome, that is, the proportion of false positives among the n observed cases, then the number of true cases of the negative control in the exposed is vn. so the relative risk in the exposed of the positive control (when n new cases are injected) wrt the negative control is
(vn+(true new cases))/vn=(vn+n)/vn=1+1/v
since v<1, 1/v is bigger than 1, and therefore 1+1/v>2.
-) general case: PPV<100%, sensitivity<100%
now, the general case: v<1 and k>1, k being the inverse of sensitivity (k=1/sensitivity) and v being the PPV. the number of true cases of the negative control among the exposed is then kvn, among which (k-1)vn unobserved. the true prevalence of negative controls among the N exposed study participants is kvn/N, let’s call it p. the proportion of true unobserved negative controls among the n injected is (k-1)vn/(N-n), which after some manipulation becomes (p-p/k)/(1-p/kv). the number of truly new subjects injected by injecting n subjects is therefore n(1-p)/(1-p/(kv))
so the relative risk in the exposed of the positive control (when n additional cases are injected) wrt the negative control is
(kvn+(true new cases))/kvn=(kvn+ n(1-p)/(1-p/(kv)))/kvn=1+(1/kv)(1-p)/(1-p/(kv))
=================================
therefore injecting n cases increases the risk in the exposed by 1+(1/kv)(1-p)/(1-p/(kv)), which is 2 only if kv=1, that is, sensitivity is equal to PPV (in particular, if they are both 100%). some typical situations are represented in this graph: three values of p (1%, 5% and 10%), three values of PPV (50%, 75% and 100%), and the RR is represented a function of sensitivity.
RR.pdf (60.9 KB)
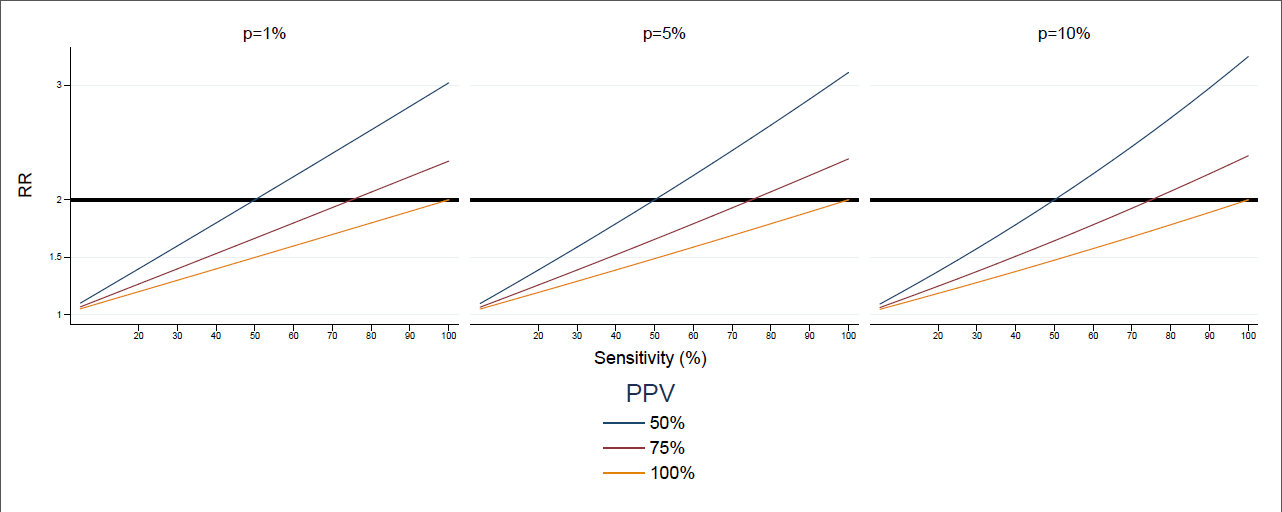
the formula takes values that range from 1.5 to 3 for combinations of PPV and sensitivity that may easily occur, like low sensitivity and high PPV. this is specifically the case of European databases, where sensitivity of the same condition may vary a lot between databases, and sensitivity of a database may vary a lot between conditions, as shown in this poster presented in rotterdam.
so my conclusion would be that replacing the assumption that RR is 2 with the formula above could be a way forward. this would require that reasonable scenarios for sensitivity or prevalence, or for sensitivity and PPV, or for PPV and prevalence are available - two of the three are enough, as discussed in this thread - for each negative control. providing such scenarios should be part of the development of the set of negative controls, and should be performed per database - althought some general principles may be validated and later applied at scale, and i think the methodology in the poster may be of help in that.
what do people think? @Christian_Reich: i didn’t understand what conspiracy you were picturing in your post (although i enjoyed the image a lot), does this discussion support your conclusion?
computation.pdf (138.6 KB)