Hello Everyone,
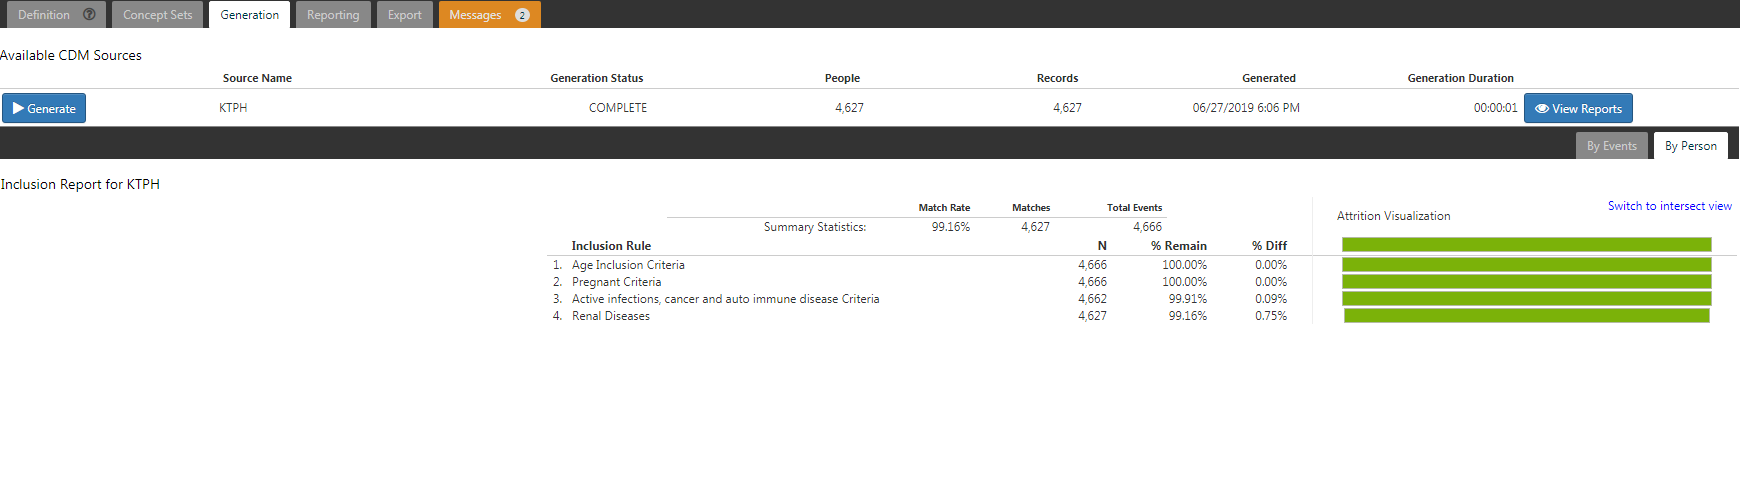
I am using Atlas to generate cohort and encountered the below scenario. As you can see my final cohort size is 4627 but different views have different number at the end. One is correct whereas the other is not right. I am just switching between the graphs. Please find the screenshot below?
As you can see Renal diseases has different values in different views
The report works off the same data, but presents it differently:
Intersection Report
Each Inclusion Rule is listed showing the number of events that matched each inclusion rule, independent of any other rule.
Attrition Report
The attrition report displays how each rule sequentially limits the final cohort population. So the first row is just when the first inclusion rule is applied. The second row is rule 1 and rule 2, and so on.
In your examples, you have most everyone meeting all criteria, so you don’t really see much happening in these reports. These reports are useful when you want to understand the magnitude of impact of your inclusion criteria (and your inclusion criteria has very minor impact on your base population).