Hello,
I was watching EHDEN academy tutorial on Atlas and have few questions for graphs generated under Data sources tab. Can help me with the below questions? Since am using public Atlas to learn this, we are unable to verify this through SQL (as we don’t have private atlas instance yet)
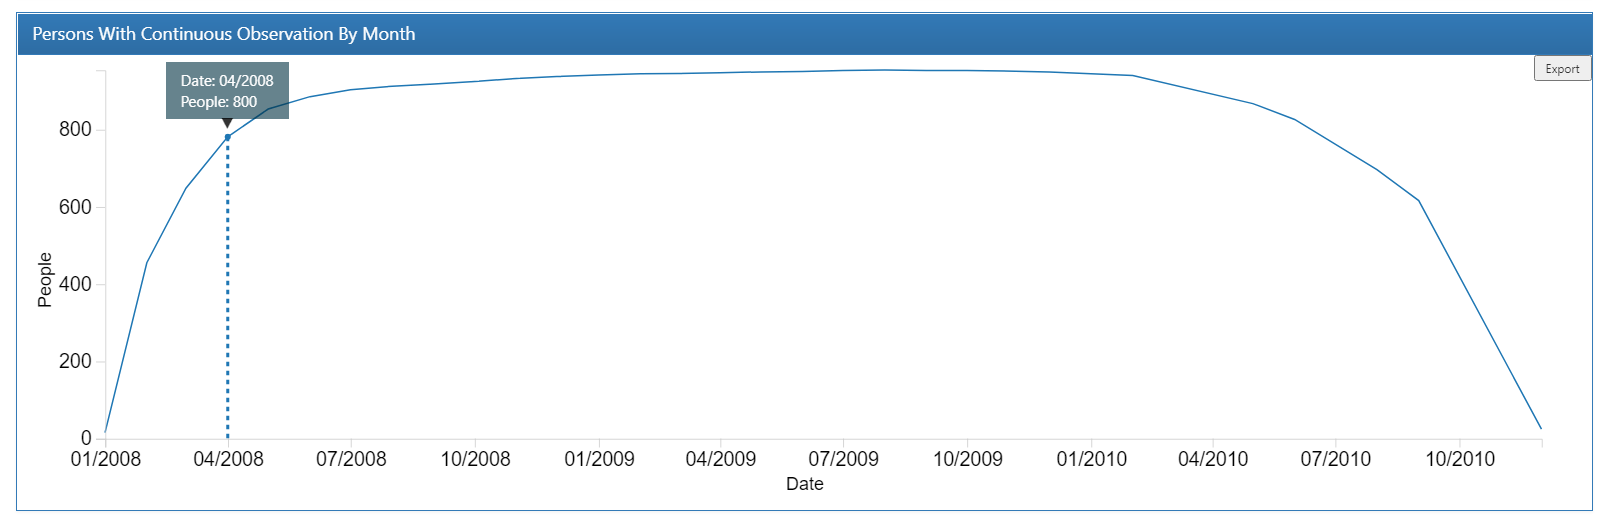
q1) In the above graph, what does continuous observation by month mean? For example, does it mean on 04/2008, we had 800 people (whose observation period was started?). Am I right to understand this?
q2) Let’s say a patient whose observation_period started on 04/2008 and ended on 10/2008. So, this patient will appear under 04/2008, 07/2008 and 10/2008. All the three calendar months?
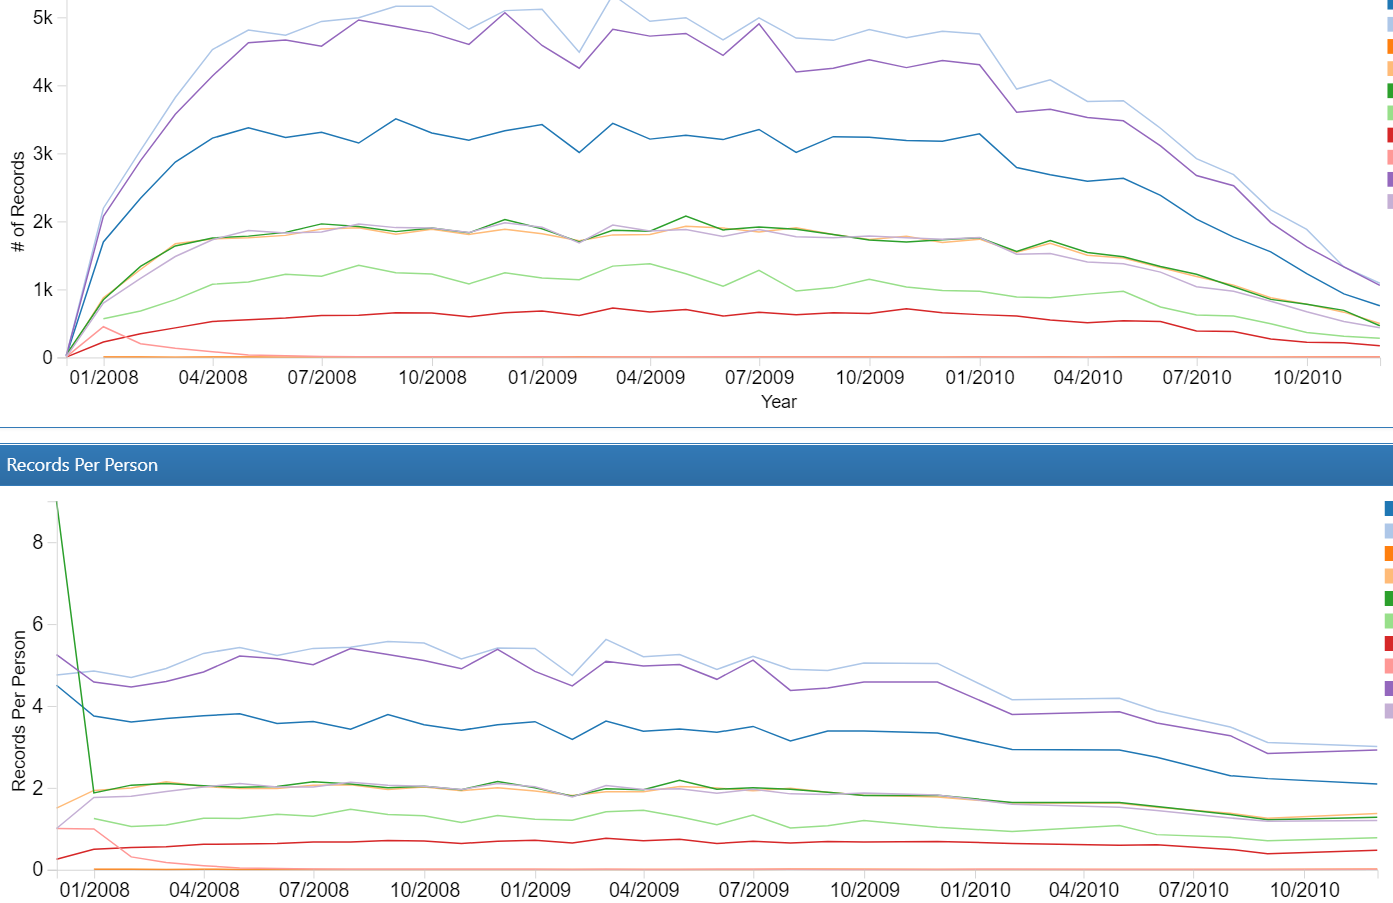
q3) In the above graphs (Total rows and Records per person), am I right to understand the counts are calculated based on the <domain_event>_START_DATE only? For ex: Total # of rows under condition_occurrence that had condition_start_date with 01/2008.
q4) Similarly for Records per person. The count is based only on <event>_start_date only?