How can I do that?@anthonysena@Chris_Knoll
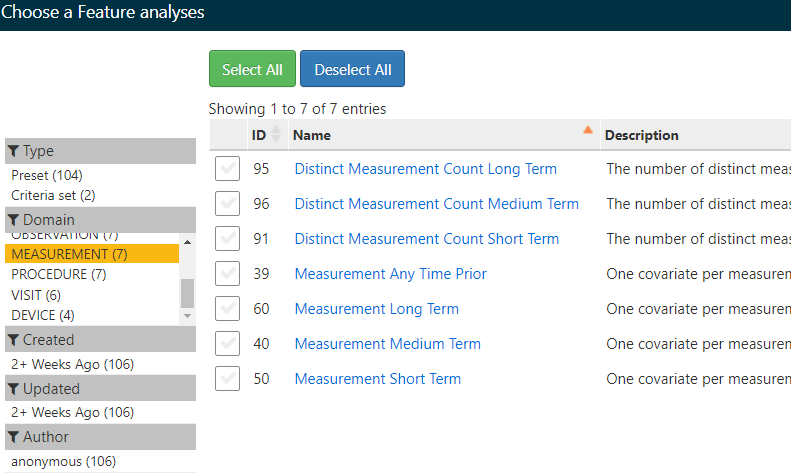
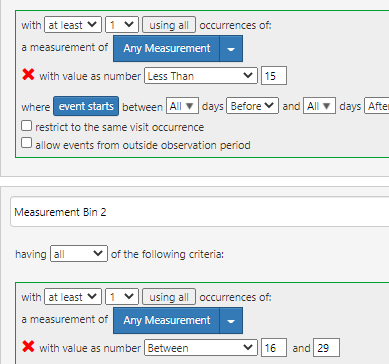
The “canned” analyses only offer limited choices for measurements. (see picture)
I don’t want to define 6 cohorts for this problem (I know it solves it) - because it is a classic use case for characterization. Don’t advise that!
Note that user has only Atlas access and can not do any custom code (Feedernet context).
I can hack the SQL right away (or an R package) - but it has to be done strictly inside Atlas. So I need advice for Atlas or some other “tool” (not plain SQL).
The result should tell me that out of 1000 patients, 800 have 90+, 120 have result 60-89, etc until all patients are classified. They are mutually exclusive.
You SQL seems to work on drugs. That seems not correct.
The custom feature is definitely the right direction! I have not seen a good tutorial for creating custom feature. (or overlooked it) (and I don’t have experience creating custom feature).
Think
select ...
            CASE
               WHEN value_as_number <15 THEN '<15'
               WHEN value_as_number >= 15 AND value_as_number <= 29 THEN '15-29'
               (more bins here )
            END as Bin
     FROM   measurement
Ok, I am seeing 2 ways to do this, depending on what you want:
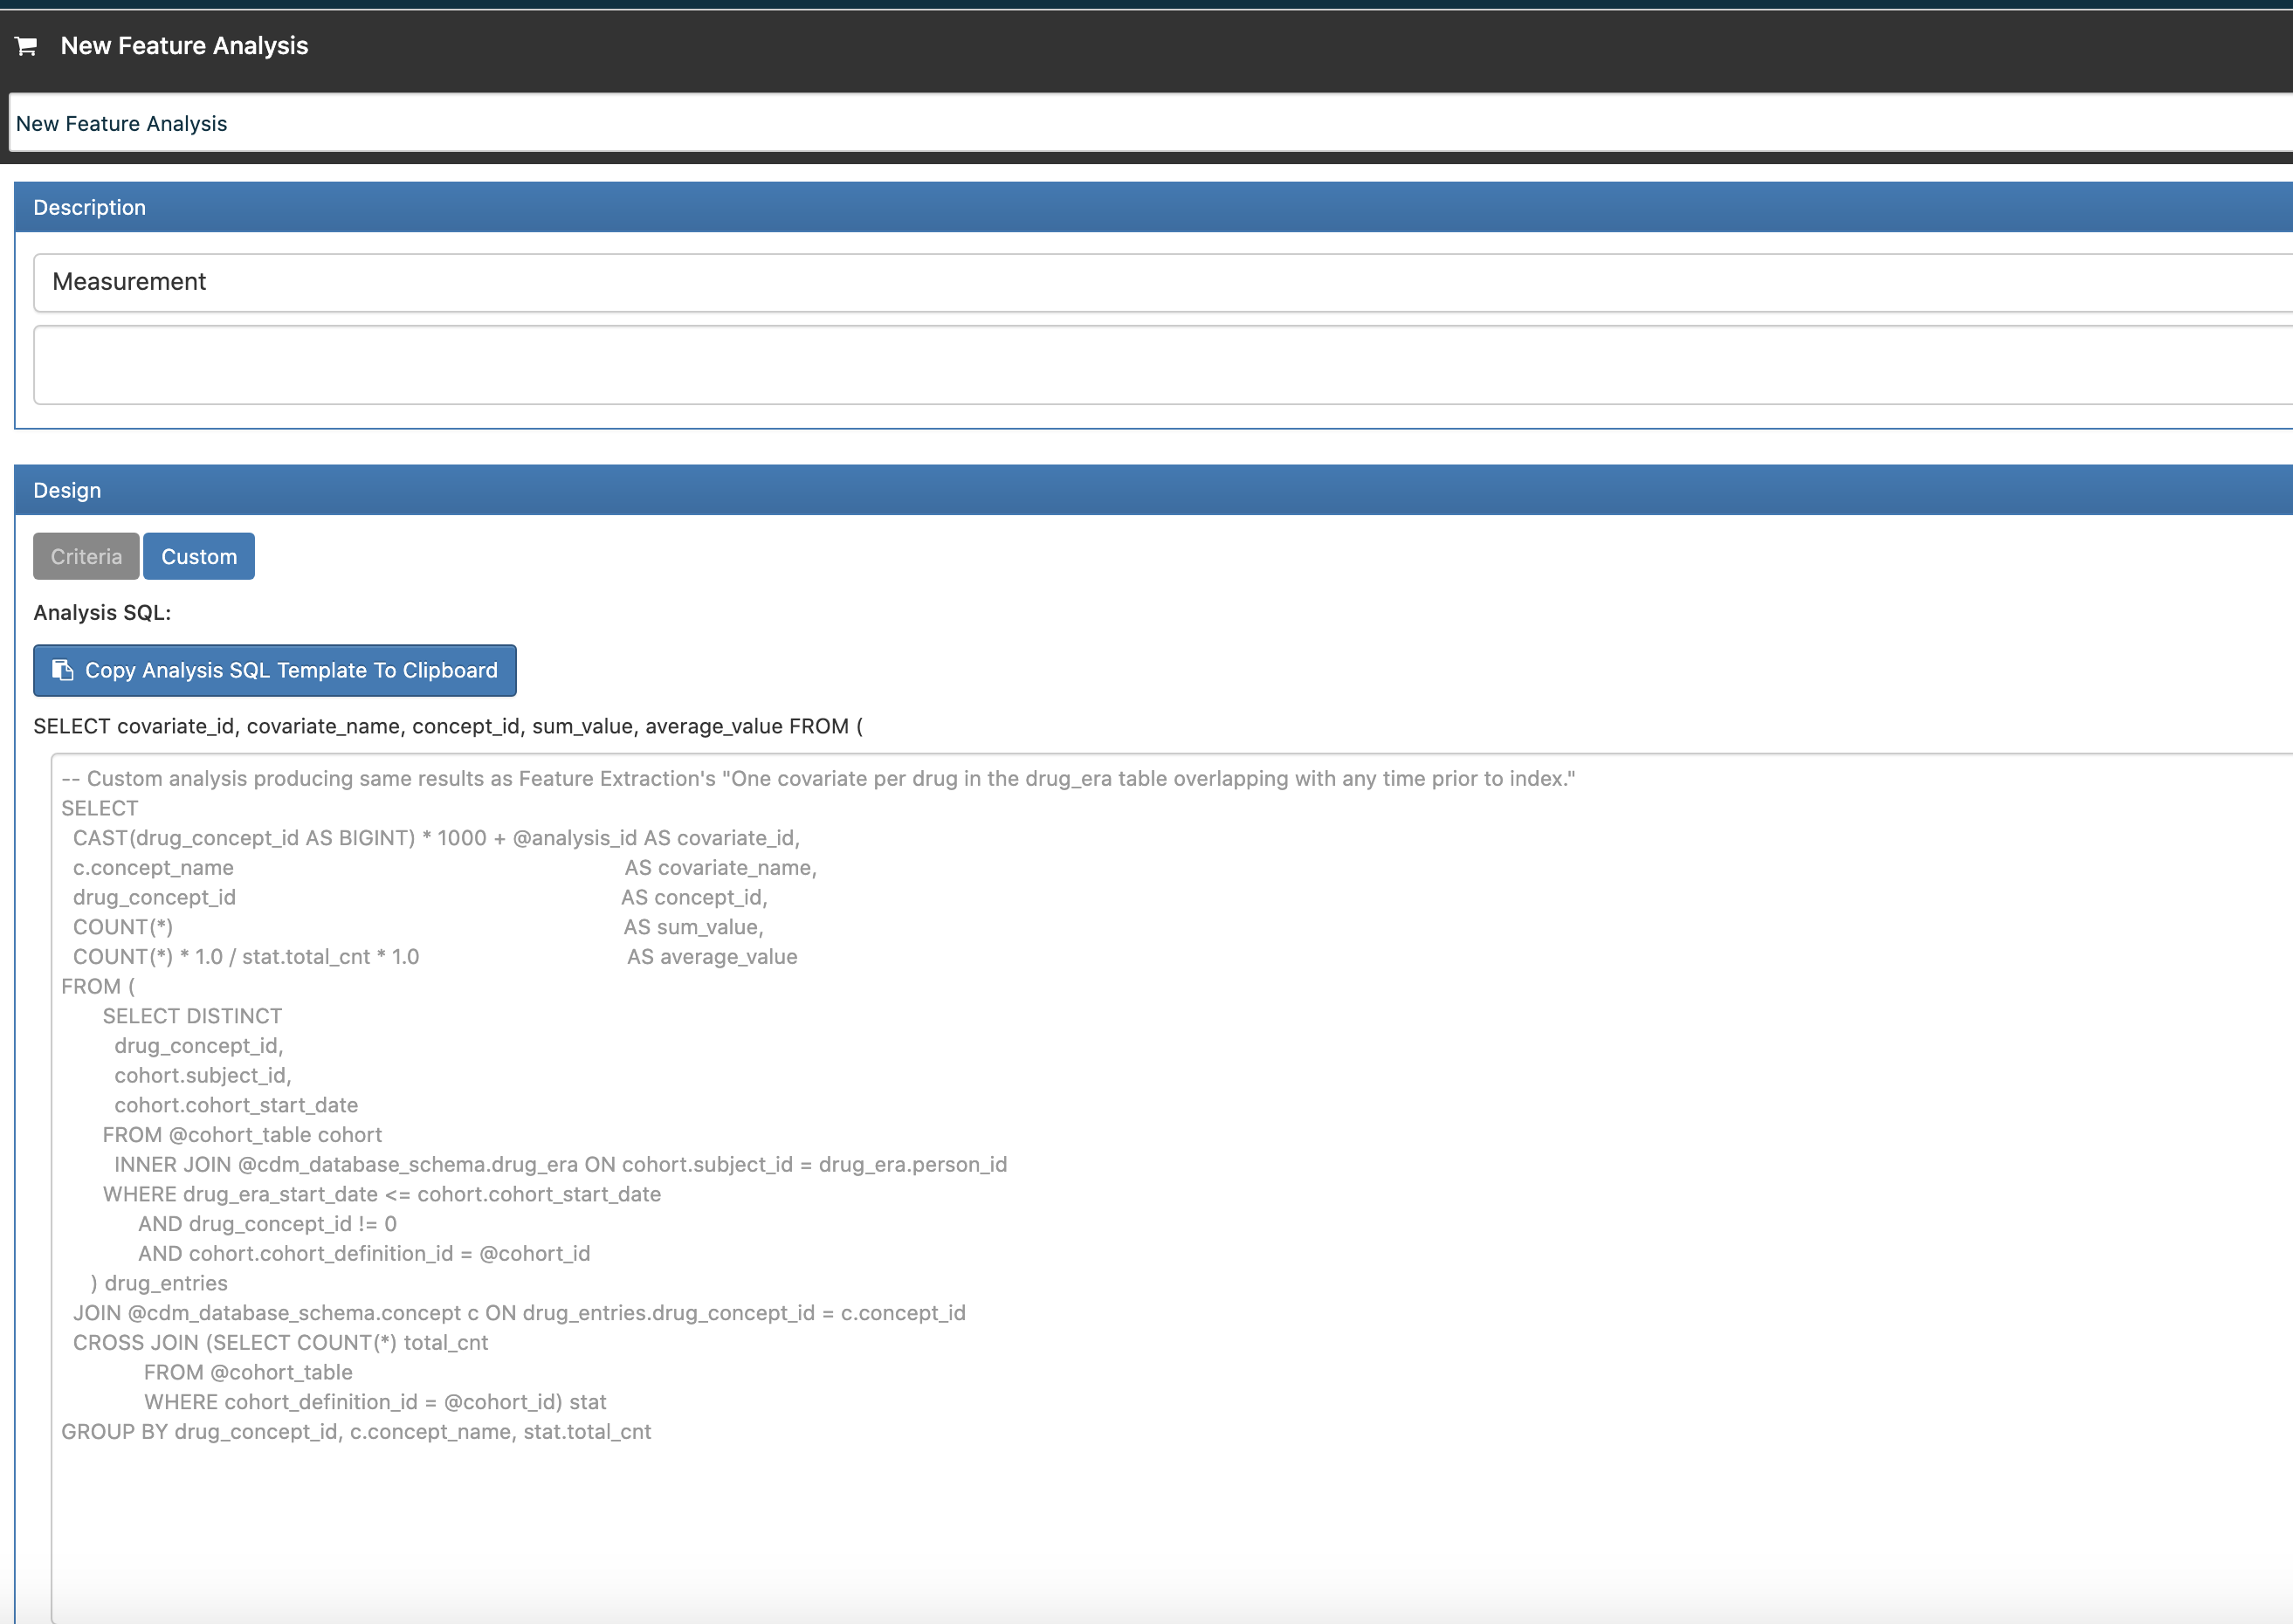
If you want a prevalence count within a population of a GFR measurement (at the various levels) then you’ll create a custom feature (not custom SQL, just use the Criteria expressions to define the criteria)… something like:
Has at least 1 measurement of GFR within {time window} with value as number ...
If you are saying it has to be the first one, then enable ‘first time in history’
The custom prevalence feature will tell you how many people in the population have the specified criteria.
The other way of looking at this is by stratifying the population by the same criteria, but this won’t give you counts, but rather it will create sub-populations and execute the characterization based on that sub group. I don’t think that’s exactly what you want in this case (you’lre looking for prevalence counts) but it is another way to split the cohort into sub-groups without having to write individual cohorts.
Custom featuers are defined externally, and then imported into the CC analysis.
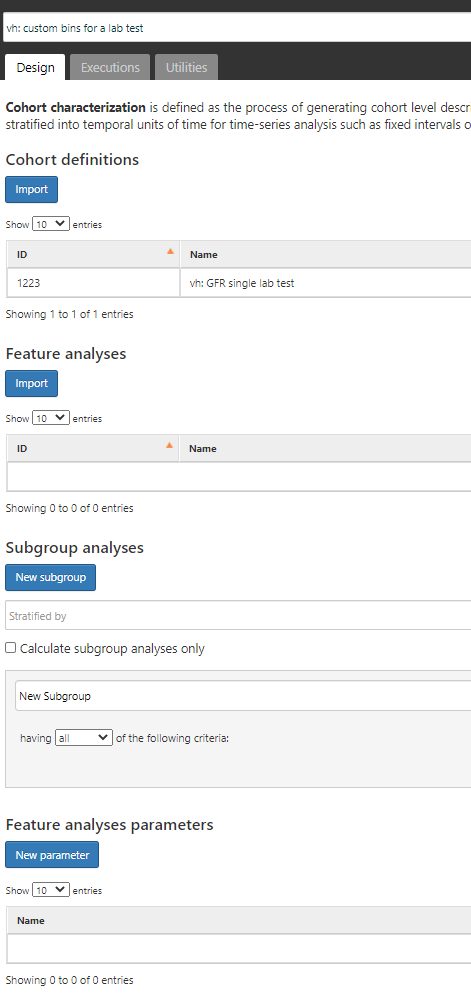
I started the custom feature for you here. I have updated your cc design to include the custom feature, so you just need to go into the custom feature, define your measurement criteria bins, and then execute the CC design.
This is very good. Thank you @Chris_Knoll.
I edited the first 2 bins. Do we need to repeat the measurement in the custom feature definition (ideally no, but I am guessing we may have to. (Q2)
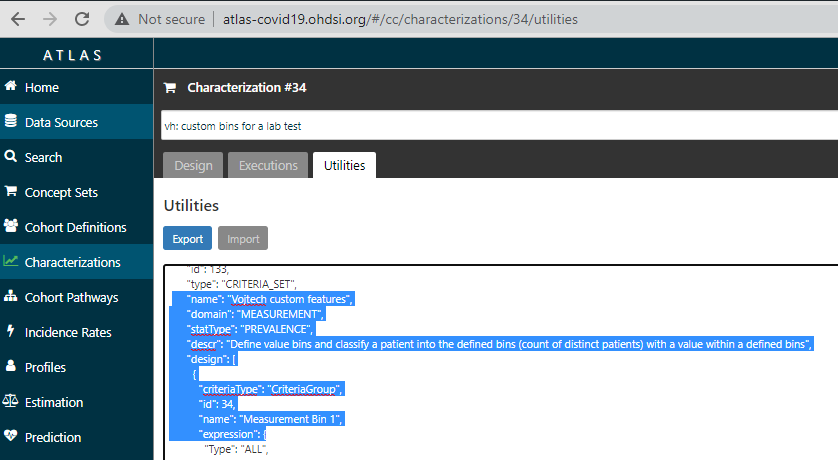
I verified that is seems like the export into .json will include the custom feature. SynPuf data on the COVID server do not have any labs so we will test on the Atlas server X - where lab values should be present.
btw - given the URL to custom feature here on COVID server ATLAS
Question1: If we need a new feature (on our server X), is there some secret trick (composing the right URL) to create it? (or you used non GUI stuff to create that new custom feature?)
Yes, you’ll need to define the individual criteria for each bin (it can’t read your mind about what the bins are). If you save the feature and then import it into a CC design, the CC export will contain the feature. When you then import the CC design into another Atlas instance, it will automatically import the referenced features, and link them to the imported CC design.
One thing I noticed is that you left the window criteria set to ‘event starts between all days before and all days after’ which finds any event (with the criteria), any time, in the same observation period. If you’re wanting to do something baseline, then you’ll want something like “between 180d before to 0 days before (if you want to include the index date) or to 1 day before (if you don’t want to include index date).” Also, note that nothing prevents the same person to appear in different bins due to a person recording multiple measurements…you’d have to structure the criteria logic to somehow select exactly one event if you wanted to do that, but that’s not how the criteria logic framework is designed to work, so you may just want to let people fall into multiple bins because that gives you a more ‘complete’ picture of what observations you found in the given time window.
You’re probably wondering if there’s a way to find the ‘max’ or the ‘min’ value within a time window and use that in the bin, but there is not a way to do that.
I thought about this further, and there is a way to make those bins mutually exclusive:
Define each bin such that:
Bin 1:
having all of the following criteria:
at least 1 GFR with measurement value < 20
  between 180d before and 0 days before index
and exactly 0 eGFR with measurement value >= 20
  between 180d before and 0 days before index
Bin 2:
having all of the following criteria:
at least 1 GFR with measurement value < 30
  between 180d before and 0 days before index
and exactly 0 eGFR with measurement value >= 30
  between 180d before and 0 days before index
Bin 3:
having all of the following criteria:
at least 1 GFR with measurement value < 40
  between 180d before and 0 days before index
and exactly 0 eGFR with measurement value >= 40
  between 180d before and 0 days before index
Bin 4:
having all of the following criteria:
at least 1 GFR with measurement value >= 40
  between 180d before and 0 days before index
… follow same pattern for making more bins.
This logic means that a person with multiple measurements will be placed in exactly one bin, which is the bin where there isn’t a bin with a greater value range higher than it.
Example: a person has measures 20, 25, 40 and 45:
The 20 bin won’t pass, because 25,40, 45 exists, leading up to the 45 measurement where there’s no bin greater than that one so it will be put into the bin for 45 (bin 4).
Another person only has 30…so bin 20 fails because 30 exists, but bin 30 will pass because no other measurement > 30.
The key is that you’ll need a final bin that looks like ‘at least one value > (max value of other bins)’ such that everyone who didn’t match one of the other bins gets put into that last one.