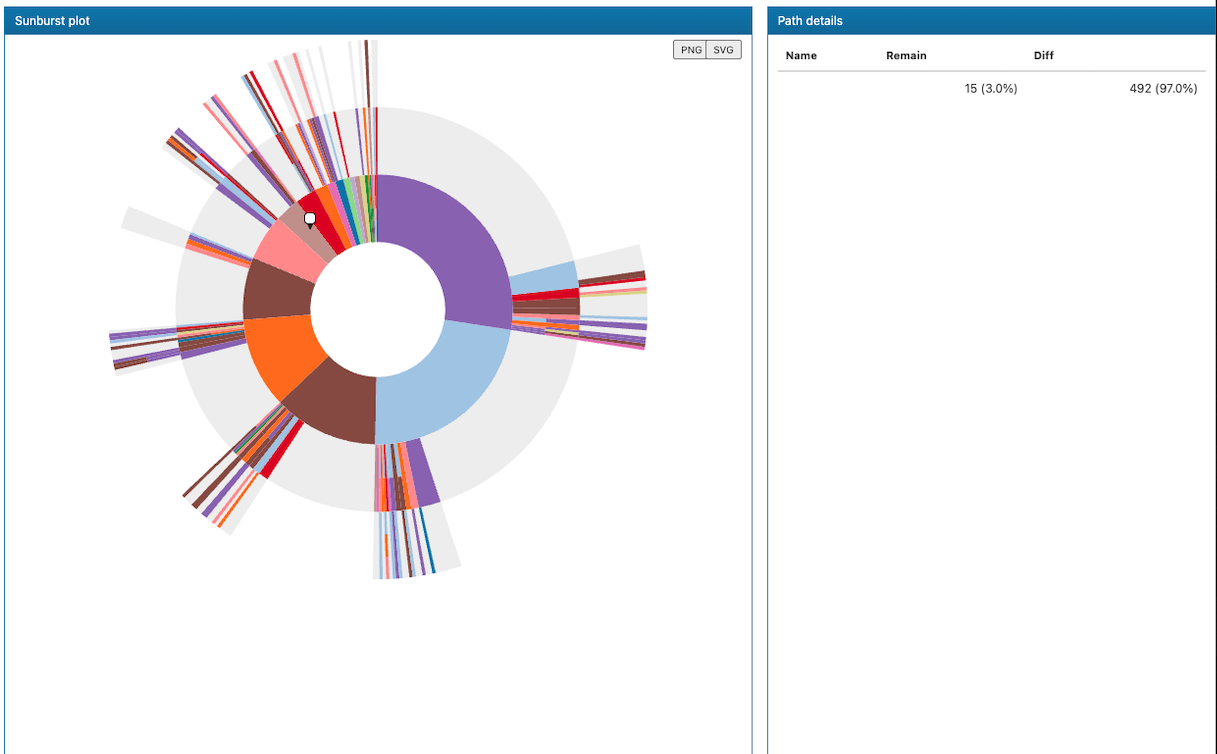
I was trying to generate cohort pathways and it resulted in a below sunburst plot.
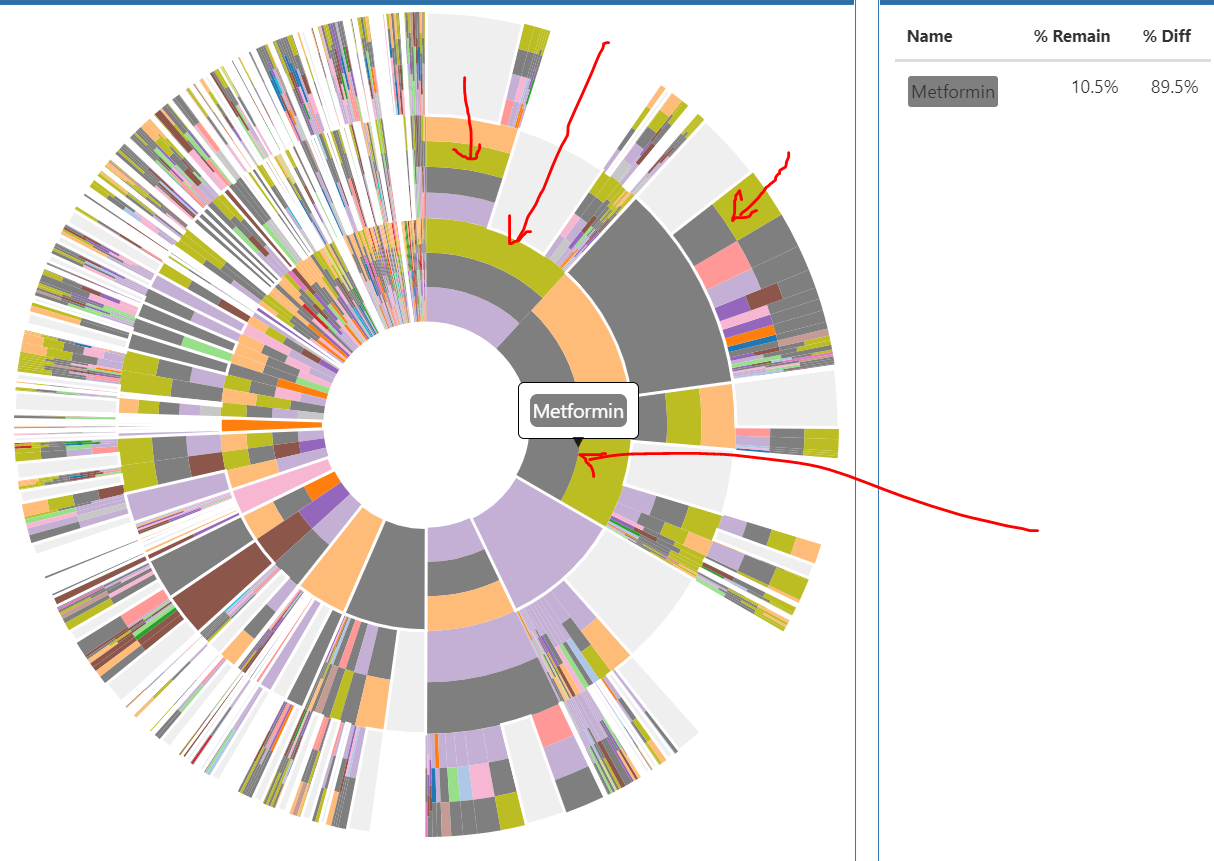
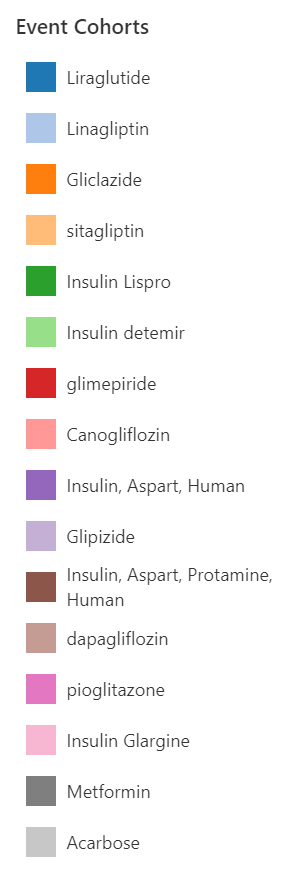
However, one thing I noticed was that the kind of green color (highlighted with red arrow) event is missing in the legend section
So, when I click the corresponding event (1st line treatment), I only see metformin but we don’t know what is the other drug that is used with metformin
Can you confirm the version you are using? There was an issue where event cohorts that only appear as part of a combo were not being displayed, but this should have been fixed here. This should have been fixed in the 2.8 release.
I am learning to use cohort pathways in Atlas.The version of my Atlas is 2.13. I am having issues with the labeling of sunburst chart.
My labels for the treatment goes missing when the number of event cohort is greater than 31. Is there a number limit for event cohorts when visualizing in the chart?
The color label starts repeating at some point.(same color for different drug)
There was a limitation (due to the event combination being stored as an int which would have limited to 31) but this should have been addressed. If you would like to open up an issue on github: Issues · OHDSI/Atlas · GitHub we can try to track it down and work on a fix.