I am trying to do treatment pathway analysis in Atlas and was looking at the paper by Hripscack et al. I was able to see that study has a follow-up period of 3 years…
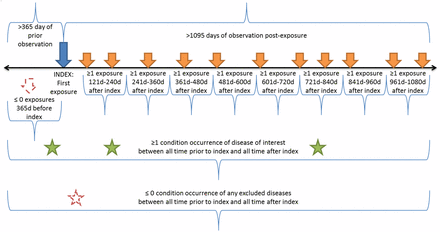
But may I know why do we look for exposure of one of the drugs in (every) 120 day after index date as shown below
Can someone help me understand in layman terms as to why to use this 120 day window?
I understand it’s author’s view/idea to have it. But may I understand why was/could it chosen that way?
For treatment pathways, as non-healthcare guy just analyzing data, I tend to look for exposure to one of drugs anytime after index date till 3 years (1095 days).
What’s the difference and why to have it as multiple episodes/window of 120 days?
In this study, the clinical motivation for requiring at least one exposure record every 120d was because we wanted to focus on patients that were likely ‘continuously exposed’ during the entire 3 year horizon. In this regard, a treatment sequence could be interpreted as all treatments a patient needed for 3 years…without confusion that the end of the sequence could be either cessation of treatment or loss-to-follow-up. This isn’t the only ‘right’ way to design the study, but the choice of your target cohort definition will influence how you interpret the results.
It was this research that, in part, motivated the development of the ‘Cohort Pathways’ feature in ATLAS as a standardized analytic tool that could be applied more broadly. So, while the PNAS paper wasn’t done in ATLAS (because the feature didn’t exist back then), it could be done now in the tool (and in fact, could be done much better, because we can now explore concurrent exposure and go beyond first exposure).
Here’s a quick demonstration design to show what that would look like:
I was just popping in to say that my research use cases are generally more operational, so I would be interested in patients getting drugs every 120 days because I want to see what kind of service gaps we have. That’s a metric of great interest for my programs.
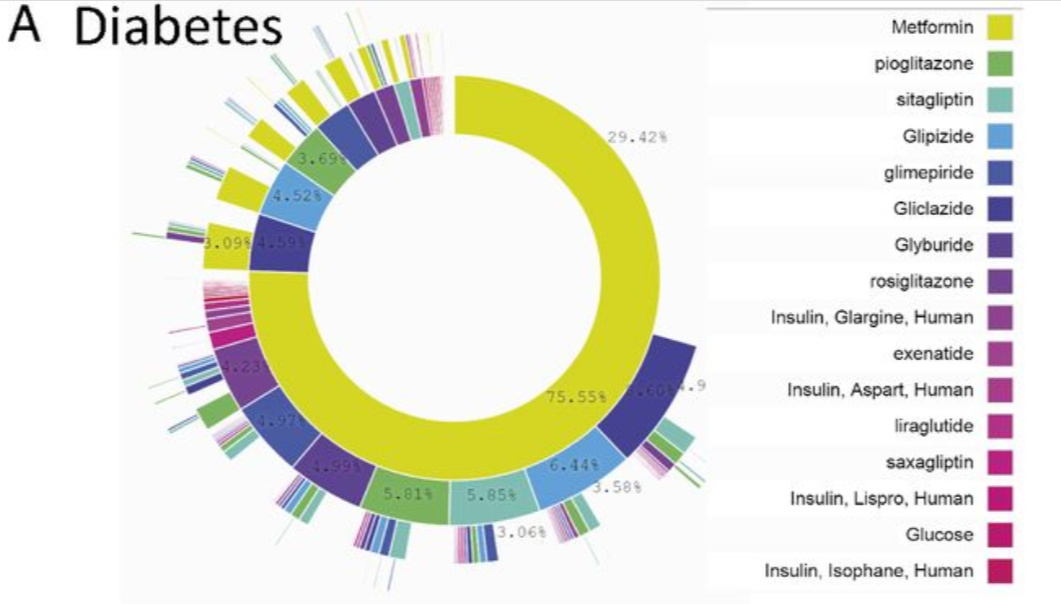
While I was reading the above paper by Hripscack et al, I was able to see a line which says that “Of note, 10% of diabetes patients, 24% of hypertension patients, and 11% of depression patients followed a treatment pathway that was shared with no one else in any of the data sources.”
From the above, if we consider only T2DM patients, May I ask which part of the sunburst visualization helps find this info? I have cropped the image and pasted here for you to refer.
Can you guys please help me in interpreting this to find the info about unique treatment pathway?
The rate of unique pathways cannot be gotten from the diagram because they would be too thin to show up on the diagram. The supplied data with the paper also cannot be used because it was rolled up to pathways with at least 11 cases (i.e., pathways were truncated to become non-unique). Only the original private data, which has pathways for unique patients, can be used to calculate those numbers.