OHDSI Home | Forums | Wiki | Github

Standard table 1

In yesterdays community call, @Christian_Reich made an interesting comment that we don’t have a standard table 1. To be clear what he meant, table 1 in pretty much every epi paper is a description of the population included in the study. Some examples are this table, this table, and this table (except here it’s table 2). My question: Would it be possible to create a standard table 1 for OHDSI studies?

But first, I’d like to discuss the purpose of such a table. I have a feeling peope are conflating the following purposes:

  1. To characterize the population so we can understand when our results are valid, and to what extent we may generalize to people outside of the study population
  2. To characterize how the target and comparator population differ (two of the examples referenced above show this, but one before and one after adjusting for confounding).

We already have tools for characterizing a population (in ATLAS) or for characterizing balance before and after an adjustment strategy (in CohortMethod), but the problem with those is that they include everything, so tens of thousands of variables, which would require a very small font to fit in that six-page limit for our paper. So the question is which variables to include. In the past, we’ve left it to experts to pick these variables, because experts fully understand the real world and which variables are effect modifiers (and therefore relevant for generalizability) and which variables are confounders (and therefore relevant for covariate balance). However, maybe in OHDSI we would like something more data-driven.

Here are some options for an OHDSI table 1:

  1. Refuse to provide a table 1 on the basis that it is simply an arbitrary selection of variables to show.
  2. Refuse to provide a table 1, and point to an interactive tool allowing readers to explore all cohort characteristics.
  3. Provide a table 1 that is generated by a to-be-developed tool for creating custom tables 1.
  4. Provide a table 1 that is standard across all our studies, with a predefined selection of variables (E.g. age, sex, some set of major comorbidities, some set of major drug classes, some set of disease scores)

Any thoughts?

nice framing of the problem.

a quick addition in terms of options to explore:

when a researcher manually selects the set of ~20 variables to put into
their table 1, there is presumably some logic behind it. some variables
are likely fixed for all studies because they are universally expected
(age and gender), but the rest are chosen for a particular reason. id be
helpful to dig into what those reasons are. a few possibilities, from my
own experience:

  1. the covariate is an expected confounder, so you want to show youve
    thought of it. the covariate is either suspected to be strongly associated
    with treatment choice, strongly associated with outcome incidence, or at
    least a little of both.

  2. the covariate is highly prevalent, such as a common comorbidity within
    the disease state, and its thought to be valuable to communicate that a
    large fraction of the population has this other chacteristic (whether or
    not its an effect modifier).

  3. the covariate may be disproportionately prevalent, relative to general
    background rate of the covariate or expected value from other cohorts.
    since its an ‘unusual’ characteristic of the cohort, even if not highly
    prevalent, it may be interesting. clinical example: secondary malignancy
    rate prior to exposure in a cohort of new users of some chemotherapy.

  4. the covariate was notably imbalanced prior to statistical adjustment
    (e.g. propensity score matching in comparative cohort analysis), so you
    want to show why groups may have not been comparable.

  5. the covariate is notably imbalanced after statistical adjustment, and
    you want to show one of the potential sources of residual bias.

im sure there are other reasons, and id be great to use this thread to
capture them here.

for each of the reasons, it seems it should be possible to define a
heuristic that that could be applied to the ‘large scale characterization’
results we currently generate, to pick out the interesting variables and
present them in a simple form. i would strongly argue that this should be
done in addition to, not instead of, sharing the full large scale
characterization results, but the small table 1 can make its way into the
main body of a manuscript and the larger results likely require an
interactive dissemination strategy that would be considered supplementary.

@Patrick_Ryan: That’s it! Why wouldn’t we give them the top 1-5 in a nice table?

Only problem with exposing co-variates is that they tend to be awkward. Real-life Table 1s nicely gloss over this by hand-picking something that will not be an easy catch for the reviewer (e.g. “The author has to delineate why his model uses ingrown toenail as one of its main covariates”). Because they look either trivial or absurd, and you have to put a lot of wording into the dicussion to explain them. And they still will be awkward.

I like this thread and the ideas presented.

  1. I would create a standard set, which is the Achilles dashboard perhaps doubled or tripled in size. Include some common disease categories, such as any cancer, cardiovascular, diabetes, etc. This is Table 1.

  2. Create a set of tables using each of Patrick’s heuristics. These are supplemental Table S1’s that go into the supplement. Create heuristics that editors say to themselves, boy I wish every paper had these tables. I.e., make this an expected step to improve reproducibility.

  3. Support the interactive tool to explore their other hypotheses about what would be important to show. This goes in as a link to an Internet site.

  4. Make it easy for the researcher to move things from #2 or #3 to #1.

George

2 Likes

Community consensus open-access article with additional suggestions:, not quite as oriented toward fitness-for-use as described by Pat:

Ed Hammond, as part of the NIH Collaboratory work, has been investigating what a “Table 1” of data quality also needs to look like.

There are other motivations driving the selection of variables for Table 1 besides the validity of results/covariate balance. Expert selection ensures that studies are meaningfully connected with prior studies and that knowledge of what drives outcomes accumulates.

I see two potential problems with a data-driven approach to selecting variables for Table 1s:

  1. It would imply disregard for the accumulated evidence that the community of researchers use to model the outcome.
  2. It would imply greater trust in data-driven solutions to modeling the outcome than might be warranted.

Reviewers would and, I think, should have a problem with this. In many cases they’d ask for a justification and/or require inclusion of an explanation of why a Table 1 excluded covariates of known importance.

Sebastien Haneuse’s work on selection bias is relevant. You know better than I do that the covariate data at hand, however broad, may not cover the phenomena needed to account for group differences in an outcome. In some cases, optimal covariate matching on 10,000 irrelevant variables will fail to balance groups on the one critically important phenomena that accounts for their different outcomes.This is a broad category of risk to the inferences from observational research using secondary data.

The implications of this fact suggest another motivation for Table 1s in observational studies: compare the variables that a primary data collection effort would be sure to include vs. the data that were available to use in the observational study. Standardizing this approach would ensure more rather than less connection to prior research. More specifically, it might insist that Table 1s include a variable list with: A) standard demographic characteristics: Age, gender, race, socioeconomic status regardless of their association with the outcome(s); and B) covariates that have been shown to be correlated with the outcome(s), regardless of whether they were measured directly by any variables used in the analysis. This evidence might be got by scraping in the same way that evidence for drug-outcome pairs have been so brilliantly collected and exposed by Rich and everyone involved with LAERTES.

In any event, the justification for something like this seems clear and widely recognized. The STROBE statement recommends that publications “Indicate number of participants with missing data for each variable of interest”.
By extension if there are no data at all for a variable of interest it should not be left out as is typically done, but noted as absent - perhaps by including rows for those missing variables with indicators that they were unmeasured.

The expanded dissemination enabled by OHDSI might go on to define a standardized addendum to Table 1 that summarizes any available evidence relevant to the question of whether measured covariates were sufficient to enable covariate balance. In particular it might summarize the evidence from prior studies in which the pattern of missing variables and the covariate balancing approach was similar to the study being reported.

Bottom line: We might not want to pick an approach that implicitly assumes covariate balance has been achieved. We’ll be better off exposing evidence that allows assessment of how likely it is to have been achieved - in keeping with all the other great work you and others have done.

I like the topic and was arguing for some basic dataset characteristics in this forum reply in the Alendronate study thread.

I created an R function (and file) that can be added to OHDSI studies to include in exported .zip file some minimum data about a dataset. To my disappointment, I did not get email reply back from Marc (when I emailed him the .R file with the function (the patch he suggested).

The generation of some data about dataset is described on GitHub [readme section here] (https://github.com/OHDSI/StudyProtocolSandbox/tree/master/DataQuality#1generate-miad-minumum-information-about-a-dataset) in the DataQuality package.

The Kahn paper argues for table 1a. (not table 1). I think OHDSI (and similar) studies that use multiple datasets are unique and novel in their use of the multiple datasets. Readers deserve to be told more about the included datasets. There is a level of aggregated dataset and level of individual datasets. Both levels are important to describe. Science is enhanced by contrasting results on various datasets (as seen in the treatment pathway study).

Instead of replicating table 1 and deep academic discussion about what gets in or out (which is valid) - I think there is additional problem that is unique to multi-datasets studies (“OHDSI like”) studies …and discussion of table “1a” (or even “1b” (not just data quality; which is in 1a)) and communicating the composition of the datasets that together comprise the aggregated" population.

Its important for OHDSI to conform to other international guidelines/standards in this space. In particular the STROBE initiative (https://www.strobe-statement.org/index.php?id=strobe-home)
For those unfamiliar with STROBE, this is a description from their website ‘STROBE stands for an international, collaborative initiative of epidemiologists, methodologists, statisticians, researchers and journal editors involved in the conduct and dissemination of observational studies, with the common aim of STrengthening the Reporting of OBservational studies in Epidemiology.’
Further, they have checklists and guidelines for reporting of studies: https://www.strobe-statement.org/index.php?id=available-checklists
each guideline is based on different study designs, etc.
I think this would be a good starting point for OHDSI to use.

To @hripcsa 's recommendation, here is a link to ATLAS with a conceptset
definition that contains top-line concepts which would could use for the
‘standard set’, to augment the other work that is needed. Just posted it
as a strawman: http://www.ohdsi.org/web/atlas/#/conceptset/152006/details

The main points to highlight: I tried to navigate SNOMED to find
non-overlapping concepts that appear to be high-level enough to be
inclusive but low-level enough to be clinically meaningful on their own.
The only exceptions to the non-overlapping rule was the breakdown of a few
common cancers, in addition to having overall malignancies, and a couple
prominent cardiovascular conditions. For drugs, I selected ATC classes.
For both conditions and drugs, I based on this on an empirical analysis
looking at a ‘universe of all cohorts, defined as new users of each drug
and newly diagnosed conditions’ and examined the mean and standard
deviation of the prevalence of each concept, to find entities that were
either common on average or highly variable across cohorts (or both).

Thanks @Vojtech_Huser for bringing this up, not sure how I missed your
earlier post on the other thread. I agree we’d like to have some minimal
information about a dataset independent from the clinical question, and
probably that should reside in the Table 1a of data quality. This
shouldn’t be an either/or proposition. There’s clearly a need for a more
systematic process to generating a ‘Table 1’ that is about characterization
for the problem of interest, whether you are doing a study in one database
or across an entire network. Additionally, there’s a need for the ‘Table
1a’ that is about data quality assessment. I think it best not to
conflate those two issues though, since they are really achieving separate
aims.

Thanks @Mary_Regina_Boland, I agree that meeting the STROBE checklist
should be a minimal requirement for all our work. I think this discussion
is still important though, because STROBE isn’t terribly specific about the
content within the items of the checklist. In the ‘Results’ under
‘Descriptive Data’, they list 3 items that should be highlighted:

(a) Give characteristics of study participants (eg demographic, clinical,
social) and information on exposures and potential confounders
(b) Indicate number of participants with missing data for each variable of
interest
© Summarise follow-up time (eg, average and total amount)

So, I guess to frame the current discussion in this light, the outstanding
item is, for (a), how do we select WHICH characteristics to adequately
summarize the study participants, information on exposures and potential
confounders?

Thanks @Andrew, so if I’m hearing you right, other heuristics, beyond the
5 I listed earlier may be:

  1. select the covariate because it has been reported in prior studies, and
    that will allow more meaningful comparisons of new results with prior
    findings.

if I’ve got that right, than the ‘data-driven approach’ to execute that
heuristic is to have the ability to extract covariates from prior
literature. I there there’s been some work in automated extraction of
‘Table 1’ from clinicaltrials.gov, perhaps that would be a place for
someone to start?

Hi @Mary_Regina_Boland,

Thanks for pointing to STROBE. I agree OHDSI should follow established standards wherever possible (unless we have valid arguments for why we disagree with the standards :wink: ). However, as far as I can see STROBE is not very specific on what should go into table 1. Here’s what I could find for cohort studies:

Oops, sorry, just now reading Patrick’s post :wink:

Yes. That’s the kind of thing I was thinking. I didn’t know about the trials.gov work.

The other thing I was proposing was a convention that highlights variables that were not measured but ideally should have been.

I started my post before but finished it long after yours. So it was a bit redundant with yours. Sorry.

@schuemie @Patrick_Ryan: so a few features I like about STROBE is that the requirements differ based on the type of study design - for example, cohort studies, observational, cross-sectional, etc. The table 1 is going to have to depend in part on the type of study being conducted and the disease, outcomes of interest. That was the rationale behind leaving the STROBE checklists more general in nature and less prescriptive. Some key features should always be presented in OHDSI table 1’s that are also in STROBE (e.g., c. in the screenshot you shared) the follow-up time for the average patient in the study is an important feature that should be captured along with demographic, clinical and social features where available.
Obviously since the guidelines are general, it is less prescriptive then a handy OHDSI library with a function for generateTable1(), but I think its a good starting point. Especially given that researchers are likely going to have to fill out one of these forms if they publish their studies in an epi journal anyways…those are my two cents

I’ve been working on the table 1 problem, and have the following solution (which will be wrong for everyone, I know, but at least it is something):

Using the upcoming version of the FeatureExtraction package one can generate cohort characteristics for a cohort of choice (the package allows many options, but that is another story). The resulting cohort characterization data object contains ‘covariates’ which have covariate IDs and analysis IDs. Given such a data object and a simple specification table like this one, a table 1 is generated as shown below. In this table I’ve used the concepts identified earlier by @Patrick_Ryan, for example looking them up in the analysis with ID 210 (occurrence in the condition_era table in the year prior to cohort_start_date). Note that race and ethnicity are not in the example, because these were not captured in the database.

For the average user, that means that with two R statements (one to generate the covariates, one to generate the table) you can have a table like below. For the power users they will have the flexibility to modify the variables that enter the table by modifying the specifications. But if people want more flexibility they’ll have to wrangle the data themselves.

Here’s the table (two parts), exported as PDF to preserve layout. Originally these are R data frames, so you can use them in many ways.

Part1.pdf (193.2 KB)
Part2.pdf (171.4 KB)

Still to add is the option to show two cohorts in one table, similar to this table 1 by Graham et al.

Still work in progress, but wanted to let everyone know what I’m working on.

1 Like

Why is that?

Oh, sorry, that is just my expectation (based on years of experience) that no matter what functionality I implement people will always want the thing the software doesn’t do :wink:

I am surprised you as the worlds leading researcher on overt or hidden bias said something like this!!! :slight_smile: 
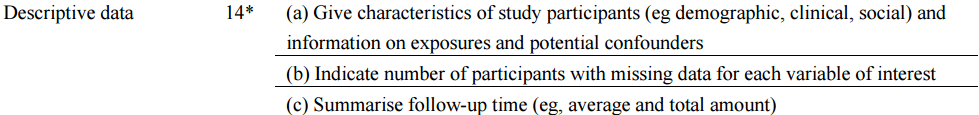
You only hear the few who complain. The ocean of happy followers and Martijn admirers - are silent.

2 Likes
t