
When I read the book of ohdsi and use the atlas to make a prediction, I found that I cannot understand the results, just like the picture show, what is the mean of preference score? where it is from?
1 Like
I think this video is informative on how you would use the preference score.
The preference score is the probability that a person is in a target population. For prediction, it would the the probability of the person having the outcome, and what these graphs are showing is the amount of ‘overlap’ you would find in preference scores at different preference score levels (ie: the density of a preference score of .25 in between the groups compared to a preference score of .75 between the groups.
In the example you presented, you see that there is overlap between the two groups. This is indicating that the prediction could not discriminate between the outcome and the non-outcome groups. This is bad for prediction, because you would want to have a predictive model that would discriminate from those with an outcome from those without the outcome (that’s the point of a prediction).
For effect estimation, we’d use the same kind propensity score model (where the propensity score is the probability that a person would receive the target treatment), but we would want to see an overlap like in your example because it means that the model can not discriminate between those who would be selected for treatment. If it can’t discriminate, this indicates that the population is similar enough that the comparison group could be used as a counterfactual for purpose of performing a comparative effect analysis.
Hope this helps.
-Chris
Thank you very much, @Chris_Knoll, because current I can not open this web, when I have the access to watch the video, I think I can better understand what you said.
So, you have explained the preference score and the propensity score, but what about the prediction score?
Apologies, I don’t have a specific definition, so I’d ask @jennareps or @schuemie for definition of those scores.
The preference score is described in more detail in this paper by Alex Walker.
@JuanPi : I’m not sure what you mean by 'Prediction score". Did you mean the predicted probability of the outcome?
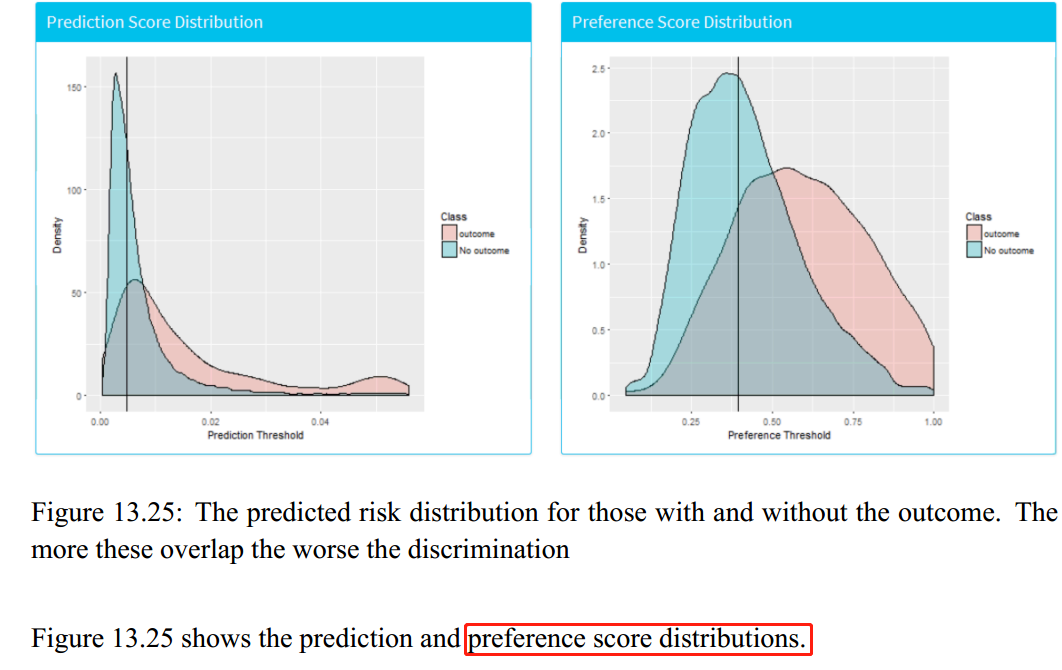
I’m glad I wasn’t the only one confused! But the ‘Prediction Score’ is shown in the above Figure 13.25, the left is labeled ‘prediction score’ other is labeled ‘preference score’. I think I understand the preference distribution plot, but I don’t know how to define prediction score. (aside from saying it’s the distribution of probabilities found in the given population).
1 Like
That is correct. The left plot is showing the distribution of predicted probabilities for both the population that had the outcome, and those that didn’t. Ideally, you’d want people that ended up having the outcome to also have a high predicted probability, and those that didn’t get the outcome to have a low predicted probability. In this specific example, you can see there were many people with the outcome who did not have a very high predicted probability.
The right plot is basically showing the same as the left, except a transformation was applied to the x-axis so the plot isn’t all squashed to the left.
Excellent informaton! I looked at the section on Preference Score and I’m going to attempt to take a stab at answering the above question:
I believe the prediction score graph is the ‘raw’ propensity score numbers you get from each of the populations, ranging from 0 to 1. It produces a density plot showing you how the propensity scores was distributed throughout the population. The plot shows that much of the population is between the 0.0 and 0.02 range of scores.
The point of a preference score is to make it look like those people that have similar probabilities look like they would have a 50-50 chance of being target or comparator group, something you can’t see by looking at the raw probability scores alone.
I hope I have that correct but this is how it’s described from the article:
…imagine that no patient predictors differentiate use of Treatment A from use of Treatment B, and that the ratio of prevalence of Treatment A to Treatment B is 1/9 (ie, Treatment A has a 10% share of the treatments that are either A or B). All the coefficients of the propensity score would be zero and all subjects would have a propensity score of 0.10. The intercept of the regression equation would be ln[0.1/(1–0.1)] = −2.20. The procedure for deriving a preference score would subtract ln(1/9) = −2.20 from the logit of the propensity score of each subject, making each logit preference score zero. A zero
logit preference corresponds to a 50% preference, since logit(0.5) = 0. Everybody would correctly get a preference score of 0.50 because nobody would possess a characteristic that made treatment with A more or less likely than use of Treatment A overall.
(From page 13, last paragraph of Preference Score section)
Now I understand what is the prediction score, the probabilityof the outcome.
But I’m confused with the preference score. Is it the probability of being in the Target (instead of the Comparator) or is the same than the propensity (the probability of receiving the Treatment)? Aren’t they the same?
I think you should read that article, they describe the preference score as a value that is more interpretable. I think this is because they adjust the value by looking at the relative population size between the Target and Comparator. But, there’s more mathematics involved but it it results in the effect that Martijn described:
I think you want to know exactly what the transformation was, but I’m not sure and there may be different ways to implement. I think the idea is similar to creating a standardized mean difference in order to create a value that can be interpreted for population comparison purposes.
Preference score is different than the probability of being in the target. The probability is the same as the propensity, which are both the prediction of being in the Treatment group.
To calculate a preference score from a set of treatment probabilities for two groups, you can use a variety of approaches depending on the specific context and goals of your analysis. Here’s one common method:
- Assign treatment probabilities to each group: Let’s say you have two groups, Group A and Group B, and you have treatment probabilities for each group, denoted as pA (probability of treatment for Group A) and pB (probability of treatment for Group B).
- Calculate the expected treatment: Multiply the treatment probabilities by the proportion of individuals in each group. Let’s assume you have nA individuals in Group A and nB individuals in Group B. The expected treatment for each group is given by:
- Expected Treatment for Group A = pA * nA
- Expected Treatment for Group B = pB * nB
- Calculate the preference score: The preference score represents the difference between the expected treatments for the two groups. It can be calculated using various methods, but one commonly used approach is to subtract the expected treatment for Group B from the expected treatment for Group A:
- Preference Score = Expected Treatment for Group A - Expected Treatment for Group B
The resulting preference score will provide an indication of the relative difference in treatment probabilities between the two groups. A positive score suggests a preference for Group A, while a negative score suggests a preference for Group B. The magnitude of the score can also provide insights into the strength of the preference.
Remember to consider the specific context and goals of your analysis, as different scenarios might require adjustments or additional considerations in the calculation of the preference score.
1 Like