
Dear all,
This message aims to introduce our new project. We are currently working on the automatic detection of abnormal measurements of vital parameters in anesthesia (such as hypotension or tachycardia).
An algorithm has been developed in order to analyze time-series data during an anesthesia. The data used come from the Anesthesia Information Management System (AIMS).
Each parameter is characterized by a threshold value. When the values exceed these thresholds, they are considered abnormal. The time spent with abnormal measurements directly impacts the patient’s life (specific post-operative management).
This algorithm for automatic detection of time series containing abnormal parameter values was applied to haemodynamic and ventilator parameters (heart rate, SpO2, arterial pressure).
Variations of these parameters on extreme values has been proved to be linked to postoperative complications such as kidney and myocardial injuries :
(Hospital stay and mortality are increased in patients having a "triple low" of low blood pressure, low bispectral index, and low minimum alveolar concentration of volatile anesthesia - PubMed)
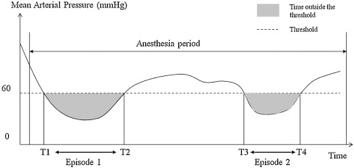
For example the graph below represents two episodes of time where the measurements of the mean arterial pressure is abnormal ;
The results of this package will be released :
- The list of episodes (with one line per episode). Header like this :
| Episode Id | Duration | Extreme value | Area under the curve |
- The list of subjects with information on the total duration of the episodes (one line per subject) :
| Subject Id | Total duration | Number of episodes | Extreme value | Area under the curve |
You can find the methodology as bellow :
(Methodology to automatically detect abnormal values of vital parameters in anesthesia time-series: Proposal for an adaptable algorithm - ScienceDirect)
In this context, we are working on the development of an R package to implement this algorithm within OMOP CDM and generalize it to several types of studies.
This package will be adapted to studies needing to compute time periods. For instance :
- In psychiatry, the SANS score (Scale for the Assessment of Negative Symptoms) can be assessed on a time scale to detect periods of abnormal values.
- In biology, blood sugar can be assessed on a time scale to detect periods of hypoglycemia for a diabetic patient.
Moreover, we have some questions about results storage on OMOP CDM.
- Is it fair to store the episodes in the condition_era table (with the episode in condition, the start and end dates of the episodes) ?
The total duration of time-series by subject could be implemented in the measurement table.
-
Values (such as extreme values, area under the curve) could be stored in other tables and linked by the fact_relationship table. Do you have any suggestions ?
-
How are scripts shared within the OHDSI community?
Please feel free to share your study ideas on which this package could be used and to send us your recommendations.