OHDSI Home | Forums | Wiki | Github

Addressing Selection Bias in Retrospective Claims Analyses

I am new to OHDSI- mainly been a fly on the wall learning more about the group and their interests. But I feel this group has the expertise to provide me with some help.

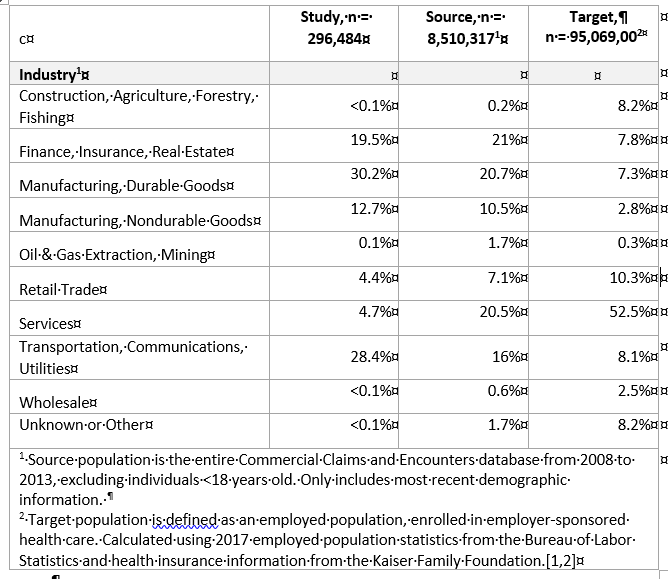
I have done several retrospective claims analyses but a lingering issue is selection bias. I use Truven’s Commercials Claims and Encounters database but the demographics in that database does not match it’s target population (employed with employer sponsored health insurance).

Can someone point me in the direction of a good paper that addresses this selection bias issue? Specifically, how does one statistically adjust their estimates to match the population of interest when you have to use external data to understand that population of interest.

I’d be happy to discuss/elaborate more if needed.

1 Like

Why are you saying that, @fraser.gaspar? The age distribution does (goes down sharply after 65 years). What other demographics do you connect to being commercially insured?

Hi @fraser.gaspar, that is a great question! I’m not aware of a specific paper that touches on this, but there is a ton of literature on sampling weighting in surveys that I think is relevant here. Maybe you can check that out?

Hello- I have not done a full comparison yet, but there are a couple of things that I have flagged in my mind…

The first is that the employer industry distribution does not match that of the United States. For example, less than 1% of Truven’s population (2008 to 2013) is in “construction, agriculture, forestry, and fishing.” But in the United States ~8.2% of the employed population with employer-sponsored health benefits is in the construction sector. I’ve attached part of a table I’m working on now that shows more of what I’m talking about.

Second, since Truven only includes large firms, it does not represent employees in small/medium sized firms. I do not have great numbers to compare yet but at least 50% of the US population works in the small/medium sized firms and 50% of employees at these firms have employer sponsored health insurance. So that’s a chunk that’s missing.

I appreciate you and @schuemie’s responses.

I think the other issue you should consider is what the value of “representativeness” is. If you are evaluating treatment effects, then it is likely less important. If you are creating national estimates, then it is more important. Ken Rothman has a paper on why representativeness should be avoided: https://www.ncbi.nlm.nih.gov/pmc/articles/PMC3888189/

1 Like

@Mark_Danese Don’t the typical advantages and shortcomings of large observational data sets tend to favor trading off high control for high generalizability? Representativeness is one of the key advantages that justifies the use of dirtier data.

@fraser.gaspar Wealth and income help determine the population on whom data is available and how much data is collected from them, because the ability to pay is directly related to the capture and use of billing codes. And since wealth and income are highly correlated with health and patterns of care, it would be great to make progress on an approach that models and accounts for that bias which the OHDSI community could leverage.

I will just take two paragraphs from the linked article that makes the point better than I did (emphasis mine):

Scientific generalization relates to the elaboration of the circumstances in which a finding applies. Newton’s laws of mechanics explain many physical phenomena, although we now know that they are not applicable on very small scales, at high speeds or in strong gravitational fields. On a more modest level, consumption of contaminated shellfish can cause hepatitis A infection, but this relation is largely nullified by consumption of beverages containing at least 10% alcohol along with the shellfish.4 The added knowledge about the modifying effect of alcohol is part of the generalization of the relation between consumption of contaminated shellfish and the risk of infection with hepatitis A. It is not representativeness of the study subjects that enhances the generalization, it is knowledge of specific conditions and an understanding of mechanism that makes for a proper generalization.

It is true that statistical inference, the process of inferring from a sample to the source from which it was drawn, is greatly aided by having a representative sample. The mistake is to think that statistical inference is the same as scientific inference. Science works on the assumption that the laws of nature are constant, but if we conflate statistical inference with scientific inference we get the reverse principle, in which the results of a study are applicable only in circumstances just like those of the study itself, and applicable only to people who are just like those in the study population.

@Mark_Danese Thanks for drawing attention to the cool article!. Rothman’s points seem well taken, in general. I’m less sure, though, of their usefulness in application to @fraser.gaspar 's goal. If he wants to illuminate the causal mechanisms that explain an effect (discover laws of nature and so forth), he would be well advised, as Rothman points out, to control for confounding through a sampling scheme that usefully limits the representativeness of his sample. The coarseness of large claims databases usually makes them a poor data source for those purposes, though. Rather than questions that require high internal validity, the scale of claims databases allows them to shine as sources for addressing questions that require high external validity. Representativeness in those cases is the point.

t